Abstract
In cochlear implants (CIs), increasing the stimulation rate typically increases the electric dynamic range (DR), mostly by reducing audibility thresholds. While CI users’ intensity resolution has been shown to be fairly constant across stimulation rates, high rates have been shown to weaken modulation sensitivity, especially at low listening levels. In the present study, modulation detection thresholds (MDTs) were measured in five CI users for a range of stimulation rates (250 – 2000 pulses per second) and modulation frequencies (5 – 100 Hz) at 8 stimulation levels that spanned the DR (loudness-balanced across stimulation rates). Intensity difference limens (IDLs) were measured for the same stimulation rates and levels used for modulation detection. For all modulation frequencies, modulation sensitivity was generally poorer at low levels and at higher stimulation rates. CI users were sensitive to modulation frequency only at relatively high levels. Similarly, IDLs were poorer at low levels and at high stimulation rates. When compared directly in terms of relative amplitude, IDLs were generally better than MDTs at low levels. Differences in loudness growth between dynamic and steady stimuli might explain level-dependent differences between MDTs and IDLs. The slower loudness growth associated with high stimulation rates might explain the poorer MDTs and IDLs with high rates. In general, high stimulation rates provided no advantage in intensity resolution and a disadvantage in modulation sensitivity.
Keywords: modulation detection, intensity discrimination, loudness growth, cochlear implant, high rate stimulation
1. INTRODUCTION
Temporal envelope information is important for speech recognition when spectral cues are degraded and/or distorted (Shannon et al., 1995; Turner et al., 1995; van Tasell et al., 1987, 1992). High stimulation rates provide better temporal sampling, allowing higher modulation frequencies to be encoded within each channel’s electric pulse trains. High stimulation rates also typically increase the electric dynamic range (DR) by lowering detection thresholds (e.g., Kreft et al., 2004; Galvin and Fu, 2005). Additionally, high stimulation rates are thought to increase the stochastic response properties of the activated neurons (Rubinstein et al., 1999; Wilson et al., 1997a,b), thereby reducing the unnatural phase-locking activity of neural firing patterns. However, no clear or consistent advantage has been shown for speech recognition with high stimulation rates (Brill et al., 1997, 1998ab; Friesen et al, 2005; Fu and Shannon, 2000; Holden et al., 2002; Lawson et al., 1996; Loizou et al., 2000a; Skinner, 2003).
While high stimulation rates might better transmit temporal envelope cues, CI users’ modulation sensitivity ultimately limits the reception of these cues. CI users’ modulation detection thresholds (MDTs) are highly level dependent and poorest at low listening levels (e.g., Donaldson and Viemeister, 2000; Fu, 2002; Shannon, 1992). More recently, stimulation rate has been shown to affect modulation sensitivity (Galvin and Fu, 2005; Pfingst et al., 2007), with low rates producing better MDTs than high rates, especially at low listening levels. Mean modulation sensitivity across the entire dynamic range (DR) has been significantly correlated (p<0.01) with speech performance of both auditory brainstem implant (ABI) users (Shannon and Colletti, 2005) and CI users (Fu, 2002). In Shannon and Colletti (2005), r2 values were 0.48 between mean modulation detection and sentences; in Fu (2002), r2 values were 0.97 between mean modulation detection and consonants and 0.71 between mean modulation detection and vowels. Temporal cues important for speech perception (e.g., consonant recognition) are often presented in the lower portion of the DR, where modulation sensitivity is poorest; higher stimulation rates might further reduce this already poor modulation sensitivity.
Amplitude MDTs have been strongly correlated with intensity discrimination limens (IDLs) in normal-hearing (Wojtczak and Viemeister, 1999) and CI listeners (Donaldson and Viemeister, 2000). In Donaldson and Viemeister (2000), MDTs were measured for a fixed stimulation rate (800 pulses per second, or pps) and low modulation frequency (4 Hz), and at 5 listening levels that spanned the DR. High stimulation rates produce larger DRs, but do not increase the number of just-noticeable differences (jnds) in amplitude across the DR (Kreft et al., 2004). It is unclear how IDLs relate to MDTs with different stimulation rates (which produce different DRs) or higher modulation frequencies.
Previous studies have shown that loudness, as a function of current level, grows more slowly with high stimulation rates (e.g., Zeng and Shannon; 1995: Fu, 2005). Loudness has also been shown to grow more slowly at low levels and more quickly at high levels (Shannon, 1985). For dynamic stimuli, loudness has been shown to be determined by the peak amplitude at high stimulation levels, and by the root-mean-square (RMS) amplitude at low levels (Zhang and Zeng, 1997). Thus, stimulation rate, stimulation level, and the type of stimulation might affect loudness and loudness growth.
Modulation sensitivity is strongly related to intensity resolution. Despite the differences in thresholds and DRs, different stimulation rates provide similar numbers of amplitude jnds. Yet modulation sensitivity worsens with high stimulation rates, especially at low levels. We hypothesize that differences in loudness growth between stimulation rates, and between steady and dynamic stimuli, might explain why high stimulation rates reduce modulation sensitivity but not intensity resolution. In the present study, MDTs and IDLs were compared for a wide range of stimulation rates (250–2000 pps), stimulation levels (spanning the entire DR and loudness-balanced across stimulation rates), and modulation frequencies (5–100 Hz). CI users’ perceptual capabilities in these tasks have important consequences in CI processor design, where high rates have yet to provide any consistent improvements in performance.
2. METHODS
2.1 Subjects
Two Nucleus-24 and 3 Nucleus-22 users participated in the experiment. All CI subjects were post-lingually deafened and all had more than 2 years’ experience with their implant device. Relevant subject details are shown in Table 1. These subjects participated in the previous Galvin and Fu (2005) study. The 20-Hz modulation frequency data for the 250 pps and 2000 pps stimulation rates are from Galvin and Fu (2005); all remaining data were collected subsequent to the completion of the Galvin and Fu (2005) study.
Table 1.
Relevant demographics for CI subjects.
| Subject | Age | Etiology | CI device (strategy) | CI experience (years) | Vowel % | Consonant % | Reference electrode, mode (1000 pps) | Experimental electrode, mode |
|---|---|---|---|---|---|---|---|---|
| S1 | 72 | Unknown | Nucleus 24 (ACE) |
5 | 68 | 65 | (14,18) BP+3 |
(22) MP1+2 |
| S2 | 61 | Unknown | Nucleus 22 (SPEAK) |
15 | 73 | 72 | (9,13) BP+3 |
(14,18) BP+3 |
| S3 | 45 | Trauma | Nucleus 22 (SPEAK) |
13 | 92 | 81 | (9,13) BP+3 |
(14,18) BP+3 |
| S4 | 61 | Hereditary | Nucleus 22 (SPEAK) |
14 | 78 | 75 | (9,13) BP+3 |
(14,18) BP+3 |
| S5 | 62 | Hereditary | Nucleus 24 (SPEAK) |
2 | 83 | 85 | (9,13) BP+3 |
(17) MP1+2 |
2.2 Stimuli
For all subjects, single-channel MDTs and IDLs were measured for four stimulation rates: 250, 500, 1000 and 2000 pps. Nucleus-22 users were tested in BP+3 stimulation mode, while Nucleus-24 users were tested in MP1+2 mode. Stimuli were delivered to a single electrode (see Table 1; the same electrode was used by each subject in Galvin and Fu, 2005). The stimulation modes were selected to be similar to those used in subjects’ clinically assigned speech processors. The Nucleus-24 subjects used MP1+2 in their clinically assigned processors. The Nucleus-22 subjects used BP+1 in their clinically assigned processors. To achieve adequate DRs with the 250 pps stimulation rate, Nucleus-22 subjects were tested using BP+3. Note that BP+3 is currently the default mode in the clinically assigned processors for Nucleus-22 users migrating from the Spectra to the Freedom processors.
All stimuli were biphasic pulse trains (300 ms in duration, 100 μ sec pulse phase duration, and 45 μ sec inter-phase gap). The relatively long pulse phase duration and inter-phase gap were used to achieve adequate DRs for Nucleus-22 users with the 250 pps stimulation rate and BP+3 stimulation mode. Stimuli were delivered via custom research interface developed at House Ear Institute (Wygonski and Robert, 2002). For the modulated stimuli, amplitude modulation was applied to the carrier pulse train using the following equation: [f(t)][1+m*sin(2*π*fm*t)], where f(t) is the unmodulated pulse train, m is the modulation index (i.e., ΔA/A, where A is the reference amplitude in microamperes), and fm is the modulation frequency. Four modulation frequencies were tested: 5, 20, 50 and 100 Hz. MDTs were measured for 8 stimulation levels (loudness-balanced across rate conditions) that spanned the DR, resulting in a total of 128 conditions (8 levels × 4 stimulation rates × 4 modulation frequencies). IDLs were measured for the same stimulation rates and levels used in the modulation detection experiment, resulting in a total of 32 conditions (8 levels × 4 stimulation rates).
2.3 DR estimation and loudness balancing
Before measuring MDTs and IDLs, the DR of the experimental electrode was estimated for all stimulation rates. Absolute detection thresholds for unmodulated pulse trains were measured using an adaptive 3-alternative forced-choice (3AFC) procedure (3-down/1-up). During the test, the stimulus was randomly presented to one of the three intervals. The amplitude of the stimulus was adjusted according to subject response. The initial step size was generally 1.2 dB and the final step size was 0.4 dB. The final 8 of 12 reversals for each run were averaged to obtain the threshold. Maximum acceptable loudness (MAL) levels were obtained using a method of limits; MAL was defined as the loudest sound that the subject would be willing to listen to for an extended period of time. The experimenter slowly raised the stimulation level until achieving MAL. There were 3–6 test runs for thresholds and MALs, and the means from all test runs were averaged to obtain the mean threshold and MAL levels. For each electrode, the estimated DR was obtained by subtracting the mean threshold from the mean MAL.
Stimulation levels were loudness-balanced across stimulation rates to reference levels of the electrode configuration shown in Table 1, using unmodulated pulse trains. The reference electrode parameters were the same as those used in Galvin and Fu (2005): BP+3 stimulation mode, 1000 pps stimulation rate, 300 ms duration, 100 μ sec pulse phase duration, and 45 μ sec inter-phase gap. Eight reference levels were evenly distributed across the DR (in terms of linear microamperes), corresponding to 5, 15, 25, 35, 45, 55, 65 and 75% of the reference electrode’s DR. Stimulation levels for each stimulation rate were loudness-balanced to these reference levels using a 2AFC, double-staircase adaptive procedure (Jesteadt, 1980; Zeng and Turner, 1991). Two intervals were presented to the subject; the intervals contained either the reference electrode-level configuration or the comparison electrode-level configuration. The subject was asked to select the louder interval, and the amplitude of the comparison level was adjusted according to the subject’s response. The final 8 of 12 amplitude reversals for each run were averaged, and the mean of 4–6 runs was used as the “loudness-balance reference level” for each stimulation rate.
2.4 Modulation detection
MDTs were measured using an adaptive 3AFC procedure. The modulation depth was adapted according to subject response (3-down/1-up); subjects were asked to choose the interval that was different. No trial-by-trial feedback was provided. Stimulus presentation consisted of 3 intervals in which one randomly selected interval was modulated. The initial step size (in percent modulation depth) varied according to the portion of the DR, as low listening levels required a larger initial modulation depth (e.g., 20 – 50%) than did high levels (e.g., 2 – 5%). The final step size was generally one-third the initial step size. The final 8 of 12 reversals for each run were averaged to obtain the MDT; 3–6 test runs were conducted for each experimental stimulation rate and modulation frequency at each listening level. The modulation thresholds (in percent) modulation frequency at each listening level. The modulation thresholds (in percent) were converted to log scale (20*log m) to allow for easier comparison across test conditions and listening levels.
2.5 Intensity discrimination
IDLs were measured for the same stimuli used in the modulation detection experiment (without modulation). An adaptive 2AFC procedure was used in which the current amplitude was varied according to subject response (3-down/1-up); subjects were asked to choose the interval that was louder. No trial-by-trial feedback was provided. The initial step size (in dB) varied according to the portion of the DR, as low listening levels required a larger initial amplitude (e.g., 2 – 4 dB) than did high levels (e.g., 1 – 2 dB). The final step size was generally one-third the initial step size. The final 8 of 12 reversals for each run were averaged to obtain the IDL; 3–6 test runs were conducted for each experimental stimulation rate at each listening level.
3. RESULTS
3.1 Threshold, MAL, DR
Mean detection thresholds decreased with increasing stimulation rate (-2.59 dB per doubling of rate). There was little change in mean MALs with stimulation rate (−0.23 dB per doubling of rate). A one-way repeated-measures analysis of variance (RM ANOVA) showed a significant effect for stimulation rate on thresholds [F(3,12) = 156.86, p<0.001], but not on MALs [F(3,12) = 1.09, p=0.391]. Figure 1 shows individual subject’s DRs for different stimulation rate; mean DRs are shown to the right. A one-way RM ANOVA showed that DRs were significantly affected by stimulation rate [F(3,12) = 53.71, p<0.001].
Figure 1.
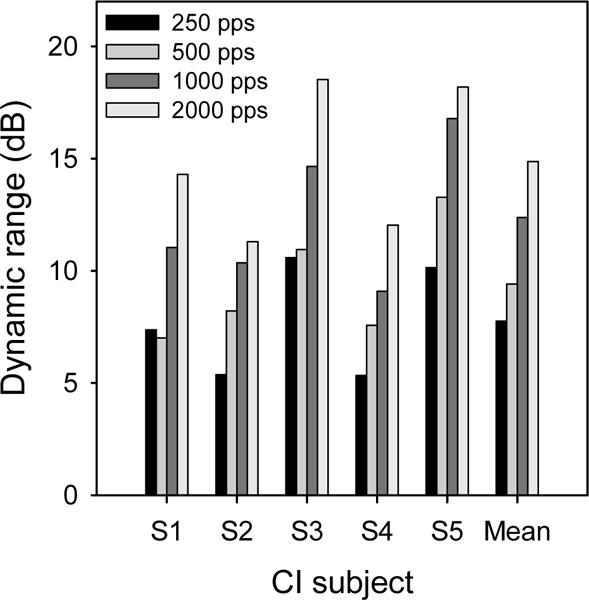
Estimated dynamic ranges for experimental stimulation rates, for individual CI subjects.
3.2 Modulation detection
In general, modulation sensitivity improved with stimulation level. However, modulation sensitivity was poorer with high rates, especially at low stimulation levels. Modulation frequency had only a minor effect. A three-way RM ANOVA showed significant effects for stimulation level [F(7,28) = 44.94, p<0.001], for stimulation rate [F(3,12) = 26.33, p<0.001], and modulation frequency [F(3,12) = 7.92, p=0.004]. There were significant interactions between stimulation level and stimulation rate [F(21,84) = 4.43, p<0.001] and between stimulation level and modulation frequency [F(21,84) = 3.34, p<0.001], but not between modulation frequency and stimulation rate [F(9,36) = 1.11, p=0.378].
Figure 2 shows mean MDTs for experimental stimulation rates as a function of loudness-balanced reference levels; the different panels show data for experimental modulation frequencies. In general, MDTs were similar between the 250 pps and 500 pps stimulation rates, and between the 1000 pps and 2000 pps rates. MDTs were better with the lower stimulation rates than with the higher rates, especially at lower levels. For example, mean MDTs for the 25% DR reference level were 15.62 dB better with the 250 pps stimulation rate than with the 2000 pps rate. At the 75% DR reference level, there was only a 0.16 dB difference in MDTs between the 250 pps and 2000 pps rates.
Figure 2.
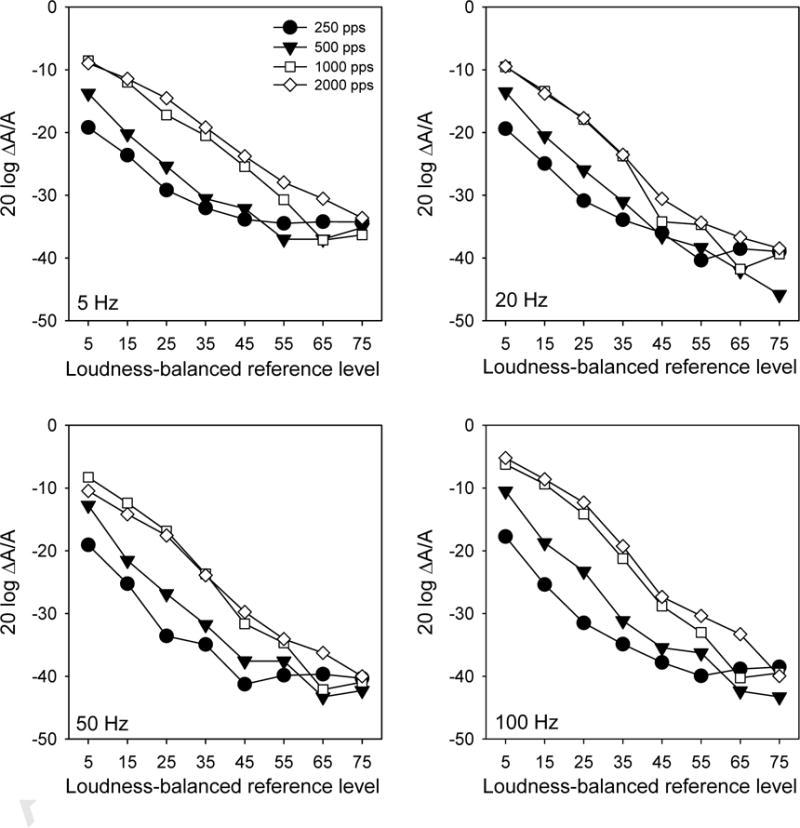
Mean MDTs (across subjects) for experimental modulation frequencies (different panels), as a function of loudness-balanced reference level.
Figure 3 shows the same data as in Figure 2, re-plotted in terms of stimulation level effects for experimental modulation frequencies, as a function of stimulation rate. For all stimulation rates, MDTs were poorest at low listening levels. MDTs generally increased with stimulation rate, except at highest stimulation levels where the MDT functions were more flat.
Figure 3.
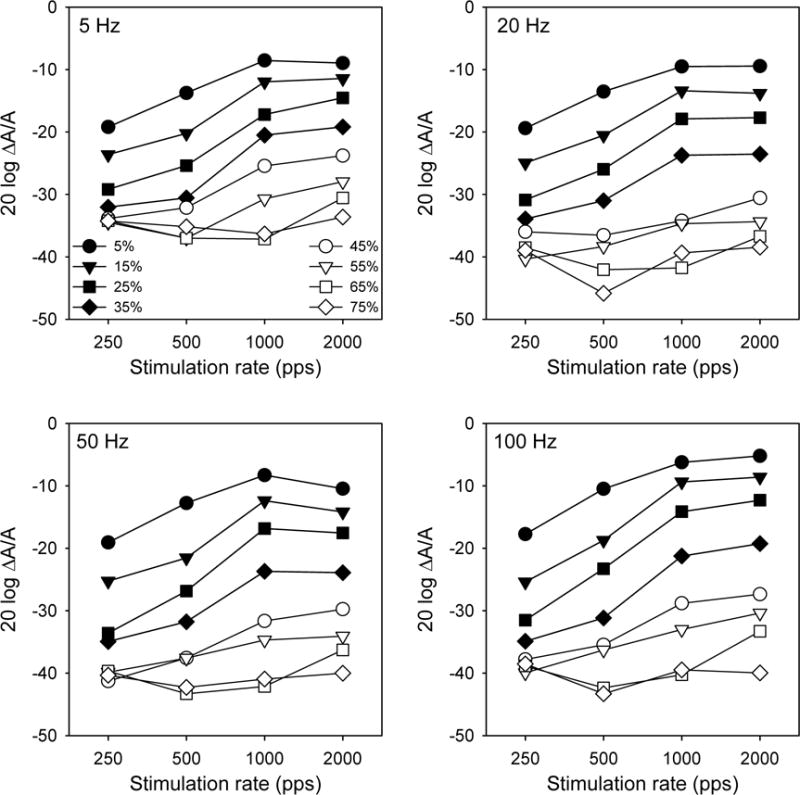
Mean MDTs (across subjects) for experimental modulation frequencies (different panels), as a function of stimulation rate.
3.3 Intensity discrimination
Similar to MDTs, IDLs were reduced as the stimulation level was increased. IDLs were generally lower with low stimulation rates than with high rates, especially at low levels. The left panel of Figure 4 shows mean IDLs for the experimental stimulation rates, as a function of stimulation level. A two-way RM ANOVA showed significant effects for stimulation level [F(7,28) = 23.4, p<0.001] and stimulation rate [F(3,12) = 11.3, p<0.001]; there was a significant interaction between stimulation level and rate [F(21,84) = 2.2, p=0.006]. In terms of relative amplitude, mean MDTs (right panel of Figure 4) were higher than mean IDLs (left panel of Figure 4) at low stimulation levels, and lower than IDLs at high levels.
Figure 4.
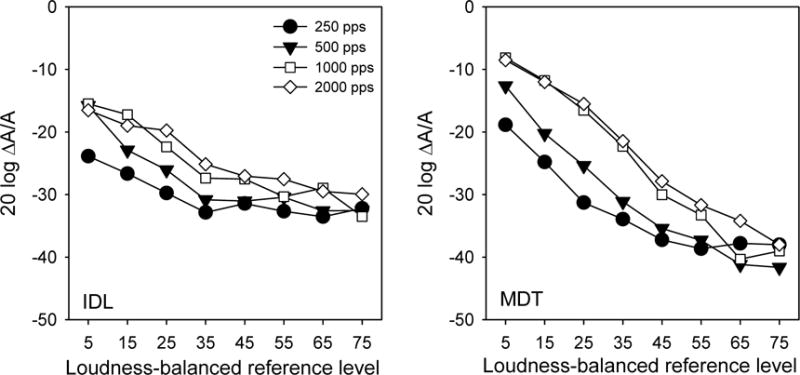
Left panel: mean IDLs (across subjects) as a function of loudness-balanced reference level. Right panel: mean MDTs (across subjects and modulation frequencies) as a function of loudness-balanced reference level.
Kreft et al. (2004) found that, although DRs were larger for high rates, the number of jnd steps was comparable across rate conditions. Similarly, the number of jnd steps for the experimental stimulation rates was estimated according to:
| (1) |
where DL is difference limen for intensity discrimination for a given reference level (in microamperes), and RL is the loudness-balanced reference level used for intensity discrimination. Figure 5 shows the number of jnd steps for individual subjects; mean data are shown to the right. A one-way RM ANOVA showed no main effect of stimulation rate [F(3,12)=0.326, p=0.806], although differences were apparent among subjects.
Figure 5.
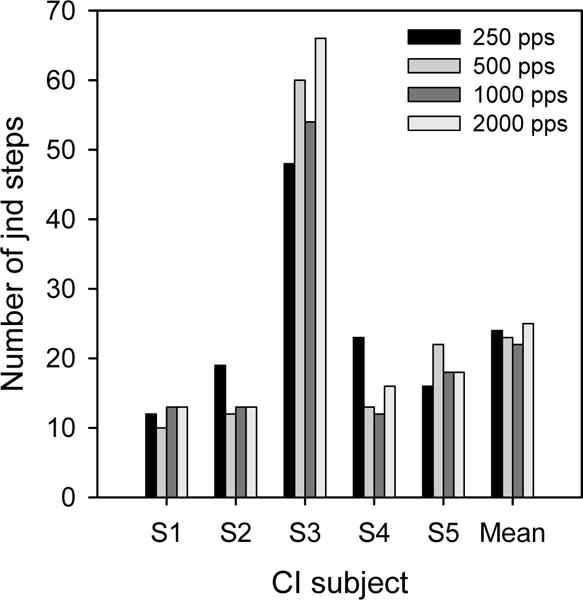
Number of amplitude jnd steps across the DR for experimental stimulation rates, for individual subjects.
3.4 MDTs, IDLs and loudness growth
The shapes of the MDT and IDL functions (Figure 4) were similar. MDTs and IDLs were directly compared, similar to Donaldson and Viemeister (2000). IDL data were converted to 10 log ΔI/I, i.e., 10 log [ΔA2/A2 + 2(ΔA/A)] as in Pfingst et al. (1983). The left panel of Figure 6 shows mean IDLs as a function of mean MDTs across modulation frequencies for different stimulation rates. The right panel of Figure 6 shows the mean slope (across subjects) of the regression between MDTs and IDLs for the different stimulation rates, as a function of modulation frequency. Across these experimental conditions, a steeper slope implies that modulation detection depended more strongly on intensity cues, while a shallower slope implies that modulation detection depended less strongly on intensity cues. In general, the slopes were steeper for 5-Hz modulation, and the slopes were shallower for the 250 pps stimulation rate. A two-way ANOVA was performed on the mean regression slopes shown in the right panel of Figure 6; there were significant main effects for stimulation rate [F(3,9) = 20.9, p<0.001] and modulation frequency [F(3,9) = 29.0, p<0.001]. Post-hoc Bonferroni t-tests showed that the slope for the 250 pps stimulation rate was significantly shallower than that for the 500 pps and 1000 pps rates, and that the slope for the 500 pps rate was significantly steeper than that for the 2000 pps rate (p<0.05). Post-hoc Bonferroni t-tests also showed that the slope for the 5-Hz modulation was significantly steeper than that with the 20-Hz, 50-Hz and 100 Hz modulations (p<0.05); there was no significant difference between the remaining modulation frequencies.
Figure 6.
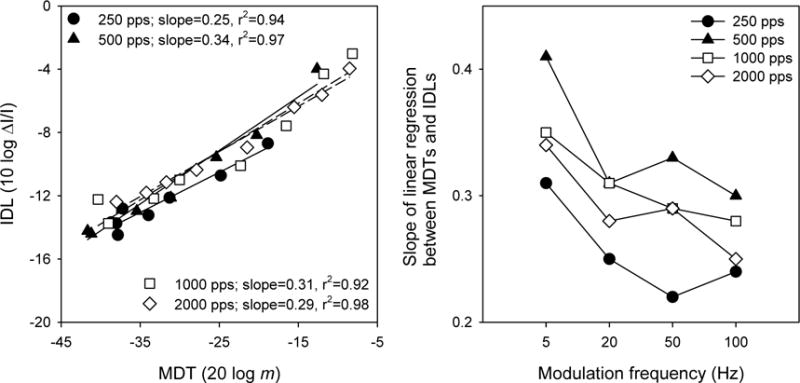
Left panel: mean IDLs (across subjects) as a function of mean MDTs (across subjects and modulation frequencies) across the entire DR, for low (filled symbols) and high stimulation rates (open symbols). The line shows the linear regression between IDLs and MDTs. Right panel: mean IDLs as a function of mean MDTs for the lower (filled symbols) and upper portions of DR (open symbols). The lines show the linear regressions between IDLs and MDTs for different portions of the DR.
Given the level-dependence in MDTs and IDLs within and across stimulation rates, MDTs and IDLs were compared to the loudness growth functions for each stimulation rate. Loudness growth for each stimulation rate (relative to the 1000 pps reference electrode rate) was characterized by the amplitude ratios between successive loudness-balanced reference levels. Smaller ratios imply faster loudness growth, as less relative current is needed to obtain the next reference level. The MDT and IDL data shown in Figures 2 and 4 were converted to ΔA/A (in linear microamperes). Thus, relative changes in amplitude for MDTs and IDLs were plotted as a function of loudness growth ratios (i.e., relative changes in amplitude between successive loudness-balanced reference levels). The top panels in Figure 7 show the amplitude ratios of mean MDTs and IDLs across the entire DR, as a function of loudness growth ratios. Linear regression analysis showed fairly strong correlations between loudness growth and MDTs (r2 = 0.65) and IDLs (r2 = 0.70); both correlations were highly significant (p<0.001). The slope of the regression was more than twice as steep for MDTs than for IDLs, suggesting that loudness growth contributed more strongly to modulation detection than to intensity discrimination. The bottom panels of Figure 7 show the amplitude ratios of mean MDTs and IDLs for different portions of DR, as a function of loudness growth ratios. For the lower portion of the DR (filled symbols), loudness growth was strongly correlated with MDTs (r2 = 0.71) and IDLs (r2 = 0.77). For the upper portion of the DR (open symbols), loudness growth was only weakly correlated with MDTs (r2 = 0.34) and IDLs (r2 = 0.33). All correlations were highly significant (p<0.001). For both MDTs and IDLs, the slope of the regression was more than three times steeper for the lower portion of the DR than for the upper portion of the DR, suggesting that loudness growth contributed more strongly to modulation sensitivity and intensity discrimination at low listening levels than at high listening levels.
Figure 7.
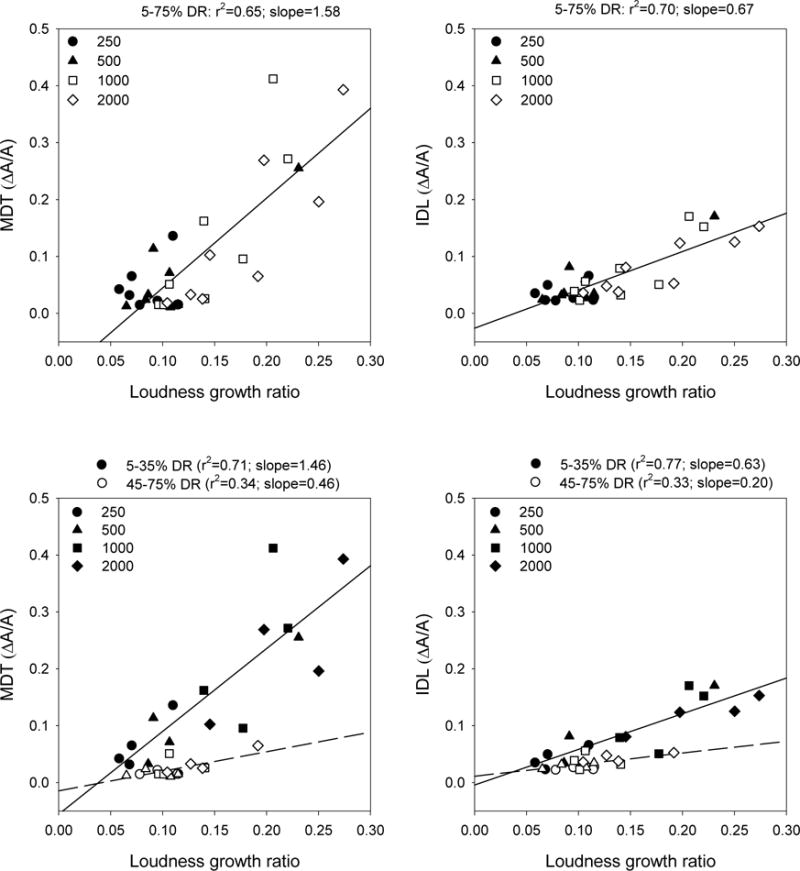
Top left: mean MDTs (across subjects and modulation frequencies) as a function of loudness growth (i.e., ratios between successive loudness-balanced reference levels), across the entire DR. Top right: similar plot for mean IDLs. In both plots, the lines show the linear regressions across all stimulation rates and across the entire DR. Bottom left: mean MDTs as a function of ratios between successive reference levels, for different portions of the DR. Bottom right: similar plot for mean IDLs. In both plots, the lines show linear regressions across all stimulation rates for different portions of the DR.
4. DISCUSSION
4.1 General discussion
The present data generally support the hypothesis that differences in loudness growth between stimulation rates might explain why high stimulation rates reduce modulation sensitivity but not intensity resolution. Loudness growth effects were most prominent for the lower portion of the DR (see bottom panels of Figure 7). While not directly measured in the present study, differences in loudness growth between dynamic and steady stimuli might have also contributed to the present results. At low levels, modulation detection required a greater relative change in amplitude than did intensity discrimination.
Consistent with previous studies (e.g., Galvin and Fu, 2005; Pfingst et al., 2007), the MDT data suggests that, despite the extended DRs, better temporal sampling and possible stochastic neural firing enhancements associated with high rates, modulation sensitivity worsened with high stimulation rates, especially at low listening levels, where sensitivity might be most useful (e.g., consonant recognition). Low rates improved modulation sensitivity by as much as 16 dB at low stimulation levels. Also consistent with previous studies (e.g., Donaldson and Viemester, 2000; Fu, 2002; Galvin and Fu, 2005; Pfingst et al., 2007), modulation sensitivity was highly level-dependent, becoming poorer as the stimulation level was reduced. MDTs were much less affected by modulation frequency, except for the poorer MDTs with 5-Hz modulation for the upper portion of the DR. Similar patterns were observed for intensity discrimination, with high rates and low levels producing significantly poorer IDLs. The larger DRs associated with high rates did not improve the intensity resolution, as the number of jnd steps remained nearly constant across stimulation rates, consistent with Kreft et al. (2004).
The present results are largely in agreement with and add to the findings of Donaldson and Viemeister (2000). In the present study, MDTs and IDLs were measured for four stimulation rates, and MDTs were measured for four modulation frequencies, as opposed to a single rate (800 pps) and modulation frequency (4 Hz) in Donaldson and Viemeister (2000). When IDLs were plotted as a function of MDTs, the mean slope values were close to that of Donaldson and Viemeister (0.36); slope values for 5-Hz modulation were most comparable to Donaldson and Viemeister’s slope with 4-Hz modulation. When IDLs were compared to MDTs for each stimulation rate and modulation frequency, the low-frequency modulation (5 Hz) produced steeper slope values while low stimulation rates (250 pps) produced shallower slope values. Despite some difference in stimuli and methodology, the present results strongly support Donaldson and Viemeister’s (2000) observation that modulation detection and intensity discrimination are “driven by a similar decision variable.” The present data further suggest that stimulation rate and modulation frequency might significantly influence this process.
While modulation detection and intensity discrimination might involve a common perceptual process, differences in MDTs and IDLs across stimulation rates were observed in the lower portion of the DR. Difference in the slope values between MDTs and IDLs for both portions of the DR suggest that overall loudness might have contributed more strongly to modulation detection than intensity discrimination. The slope and r2 values shown in Figure 7 suggest that the relative changes in amplitude for MDTs or IDLs as a function of loudness growth were quite different between the upper and lower portions of the DR. For the lower portion of the DR, the higher r2 values suggest that loudness growth was a stronger predictor of MDTs and IDLs. The asymptotic performance for MDTs and IDLs limits the predictive value of loudness growth for the upper portion of the DR. While the reference levels >45% DR increased in loudness, MDTs and IDLs were unchanged, and near device minimum in terms of amplitude steps. The steeper slope values for the lower portion of the DR also suggest that loudness growth also contributed more strongly to modulation detection and intensity discrimination.
In general, increasing stimulation rates reduce threshold more than MAL levels. If the number of neural spikes within a given time window determines threshold, then a greater number of spikes (as with high stimulation rates) will result in lower detection thresholds. The number of spikes might contribute differently to threshold and loudness, depending on the loudness level. The perceptual mechanism used for determining threshold might also differ greatly from those used for loudness judgments, intensity discrimination and modulation detection. Relative to 250 pps, the reduced threshold with 2000 pps might have resulted in a larger, but less efficient DR. With high rates, greater changes in relative amplitude were needed for loudness balancing, modulation detection and intensity discrimination in the lower portion of the DR.
In the present study, differences in loudness growth across stimulation rates were characterized by the ratios between successive loudness-balanced reference levels. This characterization is quite different from subjective loudness scaling used in some CI studies (e.g., Chatterjee et al., 2003), and more similar to methods used in loudness-balance studies (e.g., Fu, 2005; Zeng et al., 1998). In general, loudness grows more slowly at low levels and more quickly at high levels (e.g., Shannon, 1985). Thus, a greater change in relative loudness might be needed to detect modulation/intensity differences for the lower portions of the DR than for the upper portions of the DR. Given that loudness grew more slowly with amplitude for high rates than for low rates in the lower portion of DR, MDTs and IDLs would be expected to be greater with high rates than with low rates in the lower stimulation levels. As shown in Figure 7, there was a fairly strong correlation between loudness growth and MDTs and IDLs. The correlations were most strong for the lower portion of the DR.
There were notable differences between MDTs and IDLs for the lower and upper portions of the DR, in terms of relative amplitude (see Figure 4). These differences might be partly explained by loudness models for dynamic stimuli in electric hearing. If relative loudness was a strong cue for modulation detection, then the loudness of the modulated stimuli relative to the unmodulated stimuli might have contributed to differences between the MDT and IDL functions. For IDLs, the relative peak and RMS amplitudes were the same. For MDTs, the relative peak amplitudes were higher than those for IDLs at low levels, and similar (or lower) at high levels; the relative RMS amplitudes were slightly lower than those for IDLs at low levels, and more similar at high levels. Note that at high levels, MDTs were sufficiently low such that the peak and RMS amplitudes were nearly the same. This pattern somewhat agrees with Zhang and Zeng’s (1997) observation that the loudness of dynamic stimuli was determined by the RMS amplitude at low levels and the peak amplitude at high levels. At low levels, a greater change in peak amplitude would be required to compensate for the lower RMS of dynamic stimuli (relative to the unmodulated reference stimuli). Differences between the modulation detection and intensity discrimination tasks also might have contributed to the differences between MDTs and IDLs. Intensity discrimination required an explicit loudness judgment (i.e., “which interval is louder?”), while modulation detection did not (i.e., “which interval is different?”); in both tasks, the reference stimulus was the same. Because better envelope detection was available at high levels, listeners might have relied less strongly on loudness differences between stimuli in the modulation task, resulting lower amplitudes for MDTs.
Alternatively, the poorer MDTs with high rates might be due to refractory effects in auditory nerve firing (e.g., Wilson et al., 1997a,b), which might result in jittering the temporal envelope. Lower rates/higher amplitudes might induce neural phase locking that can reduce channel independence; higher stimulation rates might induce more “stochastic-like” firing patterns across neurons, thereby desynchronizing multiple channels and improving channel independence. For the single-channel measurements in the present study, any stochastic-like responses with high rates might have reduced temporal envelope cues, especially at low levels.
Differences in MDTs between low and high stimulation rates might also be viewed in terms of the amplitude between successive pulses in the modulated waveforms. Middlebrooks (2008) offered a “step-size hypothesis” to explain poorer modulation sensitivity associated with high stimulation rates. For sinusoidal amplitude modulation, the current step size between successive pulses is much larger with low stimulation rates than with high stimulation rates, which might induce better phase-locking and modulation detection. Middlebrooks (2008) compared neural responses in the auditory cortex of the guinea pig for sine-wave and square-wave modulation of low and high rate pulse trains; the square-wave modulation was a control for the step-size effect. When square-wave modulators were used, the difference in sensitivity to sine-wave modulation between low and high stimulation rates was greatly reduced. Middlebrooks (2008) also hypothesized that better phase locking to low carrier rates might enhance modulation sensitivity, and that auditory nerve fibers might adapt to high stimulation rates, reducing phase locking to modulation.
In terms of practical considerations, the deficit in modulation sensitivity with high rates might not be a limiting factor in CI speech perception. Indeed, there is no consistent data showing any clear advantage for speech perception with low or high stimulation rates. This ambivalence might be due to speech tests that are not sensitive to small differences in modulation (e.g., speech in quiet); tests in fluctuating noise might reveal some differences between stimulation rates. Some CI users might prefer the potential “temporal smoothing” associated with high rates. If the temporal stimulation patterns are less “sharp,” this might offer some sound quality advantages for some listening conditions (but at the expense of temporal information).
In the present study, for loudness-balanced reference levels above 25% DR, the MDTs for all rates most likely exceed what is needed to code speech envelopes in CIs. Speech signals have an acoustic DR of approximately 30 – 60 dB, with time-varying intensity and frequency components that are compressed within the electric DR in CIs (see Zeng et al., 2002 for a review). However, given enough spectral channels and a comfortably loud listening level, speech envelopes can be heavily compressed with little decrement in performance, at least under quiet, optimal listening conditions (Zeng and Galvin, 1998; Loizou et al., 2000b). When noise is considered, a less-compressive or even expansive amplitude mapping can benefit speech in noise (Fu and Shannon, 1999). In the present study, the poor sensitivity to modulation frequency at low levels (for any of the stimulation rates) suggests that it is difficult to transmit dynamic temporal envelope information in the lower portion of the DR. For signals of sufficient amplitude, temporal envelope cues are similarly received with low or high stimulation rates, but are better transmitted by high rates due to better temporal sampling.
4.2 Summary and conclusions
In the present study MDTs and IDLs were measured for a range of stimulation rates and levels; MDTs were measured for a range of modulation frequencies. The major findings are:
MDTs were highly level dependent. MDTs were poorer with high rates for the lower portion of the DR. MDTs were largely unaffected by modulation frequency, at least for the range of modulation frequencies tested (5 – 100 Hz); sensitivity to modulation frequency occurred only in the upper portion of the DR.
Similarly, IDLs were level dependent. IDLs were poorer with high rates for the lower portion of the DR There was no difference in the number of intensity jnds across stimulation rates.
Intensity cues seemed to contribute more strongly to modulation sensitivity at low levels than at high levels.
The slower loudness growth associated with high stimulation rates might partly explain the poorer MDTs and IDLs with high rates. The loudness of dynamic stimuli might explain differences between MDTs and IDLs at low listening levels.
High rates offer no advantage in modulation sensitivity or intensity discrimination, despite advantages in temporal sampling.
Acknowledgments
The authors would like to thank all the CI patients who graciously participated in these experiments. The authors would also like to thank Bob Shannon, Monita Chatterjee and David Landsberger, as well as two anonymous reviewers for helpful comments. This work was supported by NIDCD R01-004993.
Footnotes
Publisher's Disclaimer: This is a PDF file of an unedited manuscript that has been accepted for publication. As a service to our customers we are providing this early version of the manuscript. The manuscript will undergo copyediting, typesetting, and review of the resulting proof before it is published in its final citable form. Please note that during the production process errors may be discovered which could affect the content, and all legal disclaimers that apply to the journal pertain.
References
- Brill SM, Gstöttner W, Helms J, Ilberg C, Baumgartner W, Müller J, Kiefer J. Optimization of channel number and stimulation rate for the fast continuous interleaved sampling strategy in the COMBI 40+ Am J Oto. 1997;18:S104–106. [PubMed] [Google Scholar]
- Brill SM, Hochmair I, Hochmair ES. The importance of stimulation rate in pulsatile stimulation strategies in cochlear implants. Presented at the XXIV International Congress of Audiology; Buenos Aires. 1998a. [Google Scholar]
- Brill SM, Schatzer R, Nopp P, Hochmair I, Hochmair ES. JCIS (CIS with temporally jittering stimulation pulses): Effect of jittering amplitude and stimulation rate on speech understanding. Presented at the 4th European Symposium on Paediatric Cochlear Implantation; Hertogenbosch, The Netherlands. 1998b. [Google Scholar]
- Chatterjee M, Fu QJ, Shannon RV. Effects of phase duration and electrode separation on loudness growth in cochlear implant listeners. J Acoust Soc Am. 2003;107:1637–1644. doi: 10.1121/1.428448. [DOI] [PubMed] [Google Scholar]
- Cochlear Corporation. Technical reference manual. Englewood, Colorado: 1999. [Google Scholar]
- Donaldson GS, Viemeister NF. Intensity discrimination and detection of amplitude modulation in electric hearing. J Acoust Soc Am. 2000;108:760–763. doi: 10.1121/1.429609. [DOI] [PubMed] [Google Scholar]
- Friesen LM, Shannon RV, Cruz RJ. Effects of stimulation rate on speech recognition with cochlear implants. Audiol Neurootol. 2005;10:169–184. doi: 10.1159/000084027. [DOI] [PubMed] [Google Scholar]
- Fu QJ. Temporal processing and speech recognition in cochlear implant users. Neuroreport. 2002;13:1635–1640. doi: 10.1097/00001756-200209160-00013. [DOI] [PubMed] [Google Scholar]
- Fu QJ. Loudness growth in cochlear implants: effect of stimulation rate and electrode configuration. Hear Res. 2005;202:55–62. doi: 10.1016/j.heares.2004.10.004. [DOI] [PubMed] [Google Scholar]
- Fu QJ, Shannon RV. Phoneme recognition by cochlear implant users as a function of signal-to-noise ratio and nonlinear amplitude mapping. J Acoust Soc Am. 1999;106:L18–23. doi: 10.1121/1.427031. [DOI] [PubMed] [Google Scholar]
- Fu QJ, Shannon RV. Effects of stimulation rate on phoneme recognition in cochlear implant users. J Acoust Soc Am. 2000;107:589–597. doi: 10.1121/1.428325. [DOI] [PubMed] [Google Scholar]
- Galvin JJ, Fu Q-J. Effects of stimulation rate, mode and level on modulation detection by cochlear implant users. J Assoc Res Otolaryngol. 2005;6:269–279. doi: 10.1007/s10162-005-0007-6. [DOI] [PMC free article] [PubMed] [Google Scholar]
- Holden LK, Skinner MW, Holden TA, Demorest ME. Effects of stimulation rate with the Nucleus 24 ACE speech coding strategy. Ear Hear. 2002;23:463–476. doi: 10.1097/00003446-200210000-00008. [DOI] [PubMed] [Google Scholar]
- Jesteadt W. An adaptive procedure for subjective judgments. Percept Psychophys. 1980;28:85–88. doi: 10.3758/bf03204321. [DOI] [PubMed] [Google Scholar]
- Kreft HA, Donaldson GS, Nelson DA. Effects of pulse rate and electrode array design on intensity discrimination in cochlear implant users. J Acoust Soc Am. 2004;116:2258–2268. doi: 10.1121/1.1786871. [DOI] [PubMed] [Google Scholar]
- Lawson DT, Wilson BS, Zerbi M, Finley CC. Speech processors for auditory prostheses: Third quarterly progress report. 1996 NIH contract N01-DC-5-2103. [Google Scholar]
- Loizou PC, Poroy O, Dorman MF. The effect of parametric variations of cochlear implant processors on speech understanding. J Acoust Soc Am. 2000a;108:790–802. doi: 10.1121/1.429612. [DOI] [PubMed] [Google Scholar]
- Loizou PC, Dorman MF, Poroy O, Spahr T. Speech recognition by normal-hearing and cochlear implant listeners as a function of intensity resolution. J Acous Soc Am. 2000b;108:2377–2387. doi: 10.1121/1.1317557. [DOI] [PubMed] [Google Scholar]
- Middlebrooks JC. Cochlear-implant high pulse rate and narrow electrode configuration impair transmission of temporal information to the auditory cortex. J Neurophysiol. 2008;100:92–107. doi: 10.1152/jn.01114.2007. [DOI] [PMC free article] [PubMed] [Google Scholar]
- Pfingst BE, Burnett PA, Sutton D. Intensity discrimination with cochlear implants. J Acoust Soc Am. 1983;73:1283–1292. doi: 10.1121/1.389277. [DOI] [PubMed] [Google Scholar]
- Pfingst BE, Xu L, Thompson CS. Effects of carrier pulse rate on modulation detection in subjects with cochlear implants. J Acoust Soc Am. 2007;121:2236–2246. doi: 10.1121/1.2537501. [DOI] [PMC free article] [PubMed] [Google Scholar]
- Rubinstein JT, Wilson BS, Finley CC, Abbas PJ. Pseudospontaneous activity: Stochastic independence of auditory nerve fibers with electrical stimulation. Hear Res. 1999;127:108–118. doi: 10.1016/s0378-5955(98)00185-3. [DOI] [PubMed] [Google Scholar]
- Shannon RV. Threshold and loudness functions for pulsatile stimulation of cochlear implants. Hear Res. 1985;18:135–143. doi: 10.1016/0378-5955(85)90005-x. [DOI] [PubMed] [Google Scholar]
- Shannon RV. Temporal modulation transfer functions in patients with cochlear implants. J Acoust Soc Am. 1992;91:2156–2164. doi: 10.1121/1.403807. [DOI] [PubMed] [Google Scholar]
- Shannon RV, Colletti V. Evidence from auditory brainstem implants of a modulation-specific auditory pathway that is critical for speech recognition. Abstracts of Assoc Res Otolaryngol. 2005;28:183. [Google Scholar]
- Shannon RV, Zeng FG, Wygonski J, Kamath V, Ekelid M. Speech recognition with primarily temporal cues. Science. 1995;270:303–304. doi: 10.1126/science.270.5234.303. [DOI] [PubMed] [Google Scholar]
- Skinner MW. Optimizing cochlear implant speech performance. Ann Otol Rhinol Laryngol Suppl. 2003;191:4–13. doi: 10.1177/00034894031120s903. [DOI] [PubMed] [Google Scholar]
- Turner CW, Souza PE, Forget LN. Use of temporal envelope cues in speech recognition by normal and hearing-impaired listeners. J Acoust Soc Am. 1995;97:2568–2576. doi: 10.1121/1.411911. [DOI] [PubMed] [Google Scholar]
- Wilson BS, Finley CC, Lawson D, Zerbi M. Temporal representations with cochlear implants Am. J Otol. 1997a;18:S30–S34. [PubMed] [Google Scholar]
- Wilson BS, Finley CC, Zerbi M, Lawson D, van den Honert C. Speech processors for auditory prostheses: Seventh quarterly progress report. 1997b NIH project N01-DC-DC-5-2103. [Google Scholar]
- Wojtczak M, Viemeister NF. Intensity discrimination and detection of amplitude modulation. J Acoust Soc Am. 1999;106:1917–1924. doi: 10.1121/1.427940. [DOI] [PubMed] [Google Scholar]
- Wygonski J, Robert M. HEI Nucleus research interface – HEINRI specification. Internal Materials 2002 [Google Scholar]
- Zeng F-G, Shannon RV. Loudness-coding mechanisms inferred from electrical stimulation of the human auditory system. Science. 1994;264:564–566. doi: 10.1126/science.8160013. [DOI] [PubMed] [Google Scholar]
- Zeng FG, Turner CW. Binaural loudness matches in unilaterally impaired listeners. Q J Exp Psychol. 1991;43:565–583. doi: 10.1080/14640749108400987. [DOI] [PubMed] [Google Scholar]
- Zeng FG, Galvin JJ. Amplitude mapping and phoneme recognition in cochlear implant listeners. Ear Hear. 1999;20:60–74. doi: 10.1097/00003446-199902000-00006. [DOI] [PubMed] [Google Scholar]
- Zeng FG, Galvin JJ, Zhang C. Encoding loudness by electric stimulation of the auditory nerve. Neuroreport. 1998;9:1845–48. doi: 10.1097/00001756-199806010-00033. [DOI] [PubMed] [Google Scholar]
- Zeng FG, Grant G, Niparko J, Galvin J, Shannon R, Opie J, Segel P. Speech dynamic range and its effect on cochlear implant performance. J Acoust Soc Am. 2002;111:377–836. doi: 10.1121/1.1423926. [DOI] [PubMed] [Google Scholar]
- Zhang C, Zeng FG. Loudness of dynamic stimuli in acoustic and electric hearing. J Acoust Soc Am. 1997;105:2925–2934. doi: 10.1121/1.420347. [DOI] [PubMed] [Google Scholar]


