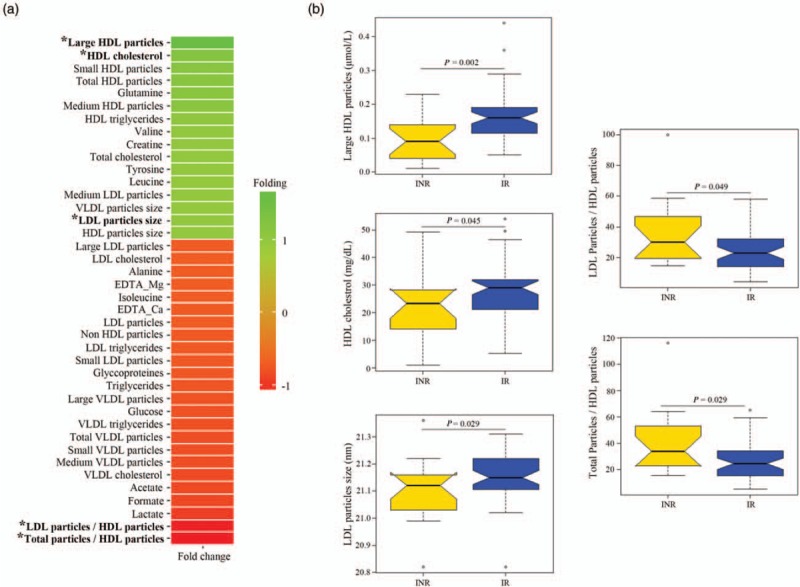
Fig. 2.
Univariate analysis of measured metabolomic variables at baseline.

(a) Fold-change heat map of the relative plasma concentrations of measured metabolites at baseline. Positive folding (green) means higher concentrations in the responders group, whereas negative folding (red) means the opposite. The asterisk highlights those variables with a significant P value able to distinguish responders and nonresponders HIV-patients. (b) Notched box-plots of statistically significant altered metabolites, where the notch shows the 95% confidence interval for the median, given by m ± 1.58 × IQR/√n. IQR, interquartile range; out-of-bag (OB) error.
