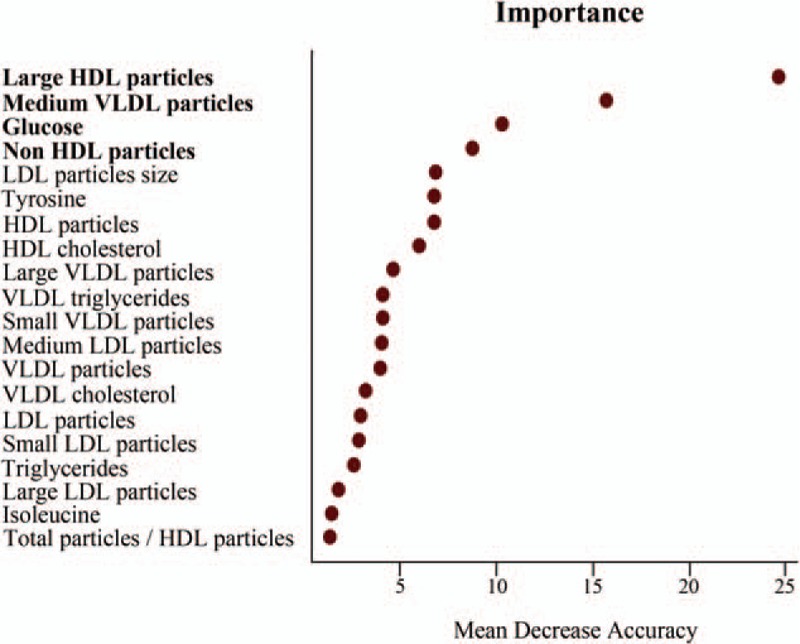
Fig. 3.
Variable importance plot of the Random Forest analysis resulting from a large number of models built around immunological response to antiretroviral therapy.

The variables are ordered top-to-bottom as most-to-least important in classifying between responders and nonresponders. The ranked list of variables tells us the importance of each variable in classifying data (OB error = 24%). The figure shows the top 20 variables in importance of classification from a total of 42, including age and CD4+ T-cell count, and only the top four (bold) were considered for the receiver-operating characteristic curve analysis.
