

We demonstrate that Na+/vacancy disordering of P2-type layered cathodes ensures both fast Na mobility and a low Na diffusion barrier.
Abstract
As one of the most fascinating cathode candidates for Na-ion batteries (NIBs), P2-type Na layered oxides usually exhibit various single-phase domains accompanied by different Na+/vacancy-ordered superstructures, depending on the Na concentration when explored in a limited electrochemical window. Therefore, their Na+ kinetics and cycling stability at high rates are subjected to these superstructures, incurring obvious voltage plateaus in the electrochemical profiles and insufficient battery performance as cathode materials for NIBs. We show that this problem can be effectively diminished by reasonable structure modulation to construct a completely disordered arrangement of Na-vacancy within Na layers. The combined analysis of scanning transmission electron microscopy, ex situ x-ray absorption spectroscopy, and operando x-ray diffraction experiments, coupled with density functional theory calculations, reveals that Na+/vacancy disordering between the transition metal oxide slabs ensures both fast Na mobility (10−10 to 10−9 cm2 s−1) and a low Na diffusion barrier (170 meV) in P2-type compounds. As a consequence, the designed P2-Na2/3Ni1/3Mn1/3Ti1/3O2 displays extra-long cycle life (83.9% capacity retention after 500 cycles at 1 C) and unprecedented rate capability (77.5% of the initial capacity at a high rate of 20 C). These findings open up a new route to precisely design high-rate cathode materials for rechargeable NIBs.
INTRODUCTION
Na-ion batteries (NIBs) are enjoying renewed interest as a viable alternative to Li-ion batteries especially for future large-scale energy storage in light of the low cost, nontoxicity, and large abundance of Na resources (1–3). Among the cathode candidates, NaxTMO2 layered oxides (where TM refers to transition metal) have attracted intensive attention due to their high capacities and feasible synthesis (4, 5). Depending on the atomic environment of Na (prismatic or octahedral) and stacking sequence of O layers (ABBA or ABCABC), they can be commonly categorized into P2 and O3 phases (6). In contrast with O3 counterparts, P2-type layered frameworks own better structure stability during the sodium extraction process owing to direct Na-ion diffusion and more open prismatic paths within TMO2 slabs. However, they usually undergo undesired P2-O2 phase transition in high-voltage regions, which leads to large volume change and rapid capacity decay (7, 8). Recently, this problem has been significantly mitigated by doping inactive metal (Li, Mg, Cu, or Zn) in the TM layers, with the aim of eliminating phase transformations during cycling and extending the solid-solution zone over a wider Na intercalation range, although at the expense of some capacity (9–13). Apart from the issue of phase transition, there are three kinds of ordering in P2-type oxides containing more than one TM species: Na+/vacancy ordering in the Na layer, charge ordering, and TM1/TM2 cationic ordering on the TM lattice (14–16). It is well acknowledged that Na+/vacancy ordering, which is closely related to the Na+ ion mobility in the interlayer, occurs frequently when the Fermi levels (ca. redox potentials) between the TM1 and TM2 species are similar (17–21). In this manner, most P2-type oxides differ from one another in commensurable or incommensurable Na+/vacancy-ordered superstructures between the TMO2 slabs within single-phase domains upon Na+ extraction/insertion (22, 23). Because the presence of ordered intermediate phases caused by Na ordering rearrangement in these compounds affects both voltage plateaus in electrochemical curves and Na diffusion path, understanding intercalation ordering is indispensable for tailoring the material to achievable electrochemical applications.
In this context, our interest focused on the electrochemical (de)intercalation of sodium in P2-Na2/3Ni1/3Mn2/3O2 (NaNM), which has a relatively high operating voltage based on Ni2+/3+/4+ redox reactions and a highly symmetric crystal structure free from the Jahn-Teller active center (24). This material exhibits a complete reversibility and single-phase region between the Na2/3Ni1/3Mn2/3O2 and Na1/3Ni1/3Mn2/3O2 compositions within a lower voltage than 4.2 V (25). There are two obvious voltage plateaus at 3.3 and 3.7 V, which might imply the rearrangement of different Na+/vacancy ordering across the Na extraction/insertion range, thus making it possible to embark on the effects of TM mixing on the Na ordering mechanism using it as a model system. Considering the same valence, smaller ionic radii ratio, and substantial difference in the Fermi level between Ti4+ (60.5 pm) and Mn4+ (53 pm), substituting a number of Mn4+ with Ti4+ in TMO2 slabs might be effective for suppressing cationic ordering, charge ordering within TMO2 slabs, and Na-vacancy ordering in Na layers.
Hence, Ti-free P2-NaNM and Ni/Mn/Ti-mixed P2-Na2/3Ni1/3Mn1/3Ti1/3O2 (NaNMT) compounds were synthesized to present a comprehensive study on the influence of Na+/vacancy ordering on their electrochemical properties, structural evolution, and Na+ kinetics toward Na (de)intercalation. The substitution of Ti for Mn in the P2-NaNM crystal framework enlarges the distance of Na layers with the contraction of the TMO6 octahedron; thus, electron delocalization is limited, and charge coupled to Na+/vacancy ordering is thoroughly broken. Consequently, the two voltage plateaus in the charge/discharge profiles of P2-NaNM are fully eliminated without affecting the capacity, manifesting characteristic sloping curves for complete solid-solution reaction. The Na-vacancy–disordered P2-NaNMT material exhibits a specific capacity of 88 mA·hour g−1 with a high average voltage of ca. 3.5 V versus Na+/Na, excellent cycle performance (ca. 83.9% capacity retention at 1 C after 500 cycles), a very small decrease in the volume (0.64%), and outstanding rate capability (ca. 87.9 and 77.5% capacity retention at high rates of 10 and 20 C, respectively). Via Na+ kinetics analysis using an electrochemical characterization technique [galvanostatic intermittent titration technique (GITT)], the nature of rate performance, together with the use of density functional theory (DFT) calculations, both experimental and theoretical information are provided to reveal the relationship between Na-vacancy ordering/disordering mechanisms and Na diffusion properties. These results indicate that Na+/vacancy disordering increases the degree of freedom of Na+ upon cycling, thus ensuring fast Na-ion mobility (average, 10−10 cm2 s−1) and a low diffusion barrier (170 meV) in the interlayer, which successfully establish the linkage between Na-vacancy disordering and high-rate cathode materials for NIBs.
RESULTS
Crystal structures of P2-NaNM and P2-NaNMT
The P2-NaNM and P2-NaNMT compounds were synthesized by a simple solid-state reaction. Figure 1 (A and B) shows x-ray diffraction (XRD) patterns and Rietveld refinement of P2-NaNM and P2-NaNMT samples, and all the diffraction lines can be indexed to a hexagonal symmetry with a space group of P63/mmc. Two superstructure peaks at ~27.2° and ~28.3° are clearly observed (fig. S1), which originate from the in-plane Na-vacancy ordering in P2-NaNM (26) and cannot be resolved using the classical refinement model. These superstructure peaks vanished in this region for P2-NaNMT, suggesting successful suppression of Na+/vacancy ordering by Ni/Mn/Ti mixing. The superstructure manifests a thermodynamic reversible characteristic (27), which could be eliminated by thermal treatment and then recovered after cooling to room temperature (fig. S2). According to the refined crystallographic data listed in tables S1 and S2, the Ni, Mn, and Ti ions occupy the octahedral 2a Wyckoff sites, indicating a uniform incorporation of Ti4+ into the TM oxide layer. Note that less Na ions occupy the Naf sites, and more Na ions occupy the Nae sites in P2-NaNMT, implying the modification of the Naf/Nae site energies. Comparing the lattice parameters and structural information of P2-NaNMT [a = b = 2.9253(7) Å, c = 11.133(2) Å] with that of P2-NaNM [a = b = 2.8859(1) Å, c = 11.146(5) Å], Ti substitution leads to the contraction of TMO2 layers and expansion of Na layer spacing associated with the increase in interaction between TM and O and reduction of the binding energy between Na and O (table S3). Thus, electronic delocalization, charge ordering, and Na+/vacancy ordering are effectively refrained because of the substantial difference in the Fermi level between Ti4+ and Mn4+. As plotted in Fig. 1C, the crystal structures of typical P2-NaNMT are composed of alternate TMO2 (TM = Ni, Mn, and Ti) layers and Na layers with ABBA oxygen stacking patterns. Na ions occupy two kinds of trigonal prismatic sites, either sharing edges with the six TMO6 octahedrons (Nae, 2d Wyckoff sites) or sharing two faces with the lower and upper TMO6 octahedrons (Naf, 2b Wyckoff sites).
Fig. 1. Structure of P2-NaNM and P2-NaNMT materials.
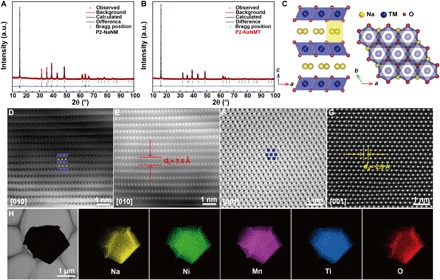
(A and B) XRD and Rietveld plots of (A) P2-NaNM and (B) P2-NaNMT samples. a.u., arbitrary units. (C) P2-type crystal structure viewed along the a axis (left) and c axis (right). (D and E) (D) ABF and (E) HAADF-STEM image of P2-NaNMT at the [010] zone axis. (F and G) (F) ABF and (G) HAADF-STEM image of P2-NaNMT at the [001] zone axis. (H) Transmission electron microscopy (TEM) image and EDS maps of P2-NaNMT samples.
Detailed atomic-scale structural information on P2-NaNMT compounds was confirmed by aberration-corrected scanning transmission electron microscopy (STEM) with annular bright-field (ABF) and high-angle annular dark-field (HAADF) techniques. The positions of the TM (Ni, Mn, and Ti) columns are revealed by the dark-dot contrast in the ABF-STEM images and bright-dot contrast in the HAADF-STEM images. The faint dark-dot contrast with the interlayer positions in the ABF-STEM images corresponds to the light element Na and O columns in the layered structure (28, 29). The ABF-STEM observations of octahedral TMO2 at the [010] zone axis are highly consistent with the P2 atomic model, as inserted in Fig. 1D for convenient visualization. The Na atoms are clamped by layered TMO2, the O columns follow a distinct ABBA-stacking mode, and every two layers of TMO2 display a mirroring symmetry. The distance of the adjacent layer dc in HAADF-STEM images (Fig. 1E) is measured to be ca. 0.56 nm, which is consistent with the interslab distance by refined crystallographic data. The ABF-STEM images (Fig. 1F) at the [001] zone axis demonstrate the arrangement of the TM atoms with a hexagonal symmetry. In addition, the distance of the adjacent TM atoms in corresponding HAADF-STEM images is ca. 0.29 nm (Fig. 1G), which matches well with the value of cell parameter a. The particle size of the samples is about 1 to 5 μm with plate-like morphology (fig. S3). The width of 2.09 Å between neighboring lattice fringes revealed by high-resolution transmission electron microscopy (HRTEM) image corresponds to the (103) planes of P2-NaNMT sample (fig. S4). Energy-dispersive spectroscopy (EDS) mapping, as shown in Fig. 1H, demonstrates uniform Na, Ni, Mn, Ti, and O element distribution in the P2-NaNMT particle.
Electrochemical performance
The electrochemical properties of P2-NaNM and P2-NaNMT were examined in a Na half-cell between 2.5 and 4.15 V at the current density of 0.1 C (1 C = 173 mA g−1). As shown in Fig. 2 (A and B), the galvanostatic charge/discharge profiles of P2-NaNM obviously involve two voltage plateaus at 3.3 and 3.7 V, respectively, suggesting different Na-vacancy ordering arrangements between neighboring TMO2 slabs. In contrast, the typical charge/discharge curves of P2-NaNMT become completely sloping lines, and two voltage plateaus totally disappeared without affecting the capacity, which results from a solid-solution reaction without a Na+/vacancy-ordered superstructure, as discussed later. Disordered P2-NaNMT displays a reversible capacity of 88 mA·hour g−1 with a high average voltage of 3.5 V, smooth charge/discharge profiles, and little polarization (Fig. 2B). There is no obvious capacity decay and voltage drop over extended cycles (Fig. 2C), showing its great potential for future practical application. P2-NaNMT shows the same cycling performance as P2-NaNM (94.6% versus 95.2%) at a low rate of 0.1 C after 100 cycles (fig. S5). However, as compared in the rate performance with a loading mass of 3 to 4 mg cm−2 in Fig. 2D, the P2-NaNMT electrode can still deliver ca. 87.9 and 77.5% of its initial capacity even cycled at 10 and 20 C, respectively, whereas the P2-NaNM electrode is approaching 0 mA·hour g−1. It can be seen that Na-vacancy disordering favors charge/discharge capability at high current density. Therefore, when cycled at a high rate of 1 C, the P2-NaNMT cathode demonstrates remarkable improvement in its cycle stability, as shown in Fig. 2E, delivering an outstanding capacity retention of 83.9% even after 500 cycles with a high Coulombic efficiency of >99% due to the slight side reactions occurring between electrode materials and electrolyte during cycling. By comparison, the P2-NaNM electrode exhibits very fast capacity decay from 80 mA·hour g−1 in the first cycle to 3.5 mA·hour g−1 after 500 cycles, corresponding to only 4.4% capacity retention. In addition, the morphology of the P2-NaNMT cathode is well maintained, whereas P2-NaNM shows pulverization after long cycling (fig. S6). Moreover, the P2-NaNMT cathode also exhibits obvious improvement in its cycling performance in a wider potential range of 2.5 to 4.3 V due to the suppressed P2-O2 phase transition at high voltage regions, delivering a capacity retention of 83.4% at 0.1 C after 100 cycles (figs. S7 and S8). In total, Ti incorporation into P2-NaNM could suppress Na+/vacancy ordering, smooth the charge/discharge curves, and extend solid-solution zone over a wider compositional range, so faster ionic transport between the interlayers is achieved under Na+ (de)intercalation, resulting in better battery performance at high rates.
Fig. 2. Electrochemical performance of P2-NaNM and P2-NaNMT compounds in Na cells.
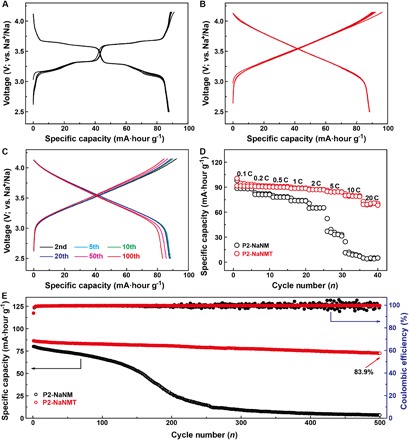
(A and B) Typical charge/discharge profiles of (A) P2-NaNM and (B) P2-NaNMT between 2.5 and 4.15 V at a rate of 0.1 C. (C) Charge/discharge profiles of P2-NaNMT during the 2nd, 5th, 10th, 20th, 50th, and 100th cycles at 0.1 C, demonstrating no obvious decay in the voltage and capacity. (D) Rate performance comparison of P2-NaNM and P2-NaNMT samples at different rates. (E) Capacity retention with Coulombic efficiency of P2-NaNM and P2-NaNMT over 500 cycles cycled at 1 C.
Charge compensation mechanism
The cyclic voltammograms (CVs) in Na half-cells were tested at a scan rate of 0.1 mV s−1, as shown in fig. S9. Consistent with the voltage plateaus in charge/discharge curves, the P2-NaNM electrode shows two pairs of reversible redox peaks located at 3.39/3.23 and 3.72/3.52 V, respectively, which arise from multiple Na-vacancy ordering in sodium layers. In marked contrast to the P2-NaNM electrode, the observed CV behavior for P2-NaNMT electrode resembles that of capacitors with only one large and broad oxidation/reduction peak, further demonstrating that the Na+/vacancy ordering is successfully prevented in the Na intercalation process after Ni/Mn/Ti mixing into the crystal lattice. Ex situ x-ray absorption spectroscopy (XAS) (Fig. 3), combined with x-ray photoelectron spectroscopy (XPS) (fig. S10), was performed to elucidate the charge compensation mechanism of Na1−xNMT upon Na+ extraction/insertion. As displayed in the x-ray absorption near-edge structure (XANES) spectra at Ni and Mn K-edges, the Ni K-edge absorption spectrum (Fig. 3A) shows apparent shifts toward the higher-energy region (~2 eV), demonstrating the oxidation of Ni2+ to Ni3+ as charge increases from 2.5 to 4.15 V (30, 31). In contrast, the Mn K-edges (Fig. 3B) show no apparent changes, indicating that the tetravalent manganese ions are electrochemically inactive. So, it indicates that the Ni2+/Ni3+ redox couple is responsible for the charge compensation mechanism (1 e− transfer) within the explored 2.5 to 4.15 V voltage window, which is highly consistent with CV results. The interatomic distance information of Na1−xNMT was also revealed by extended x-ray absorption fine structure (EXAFS) spectra at the Ni and Mn K-edges (Fig. 3, C and D). In the first TM-O coordination shell of Na1−xNMT, lowered Fourier transform magnitude and shortened interatomic distance are observed at the Ni K-edge, whereas the Mn K-edge shows almost no change upon Na removal from the crystal lattice. In this region, the electrochemically active nickel ions compensate for the charge balance, and the manganese ions always maintain the +4 state (32), which are consistent with the ex situ XANES results. In the second TM-TM coordination shells, both Ni and Mn K-edges confirm a similar shift of the decreased in-plane interatomic distances after electrochemical oxidation, which is in good agreement with the change of ahex lattice parameters upon Na ion extraction by in situ XRD observation in the latter parts.
Fig. 3. Charge compensation mechanism of P2-Na2/3−xNMT upon Na+ extraction/insertion.
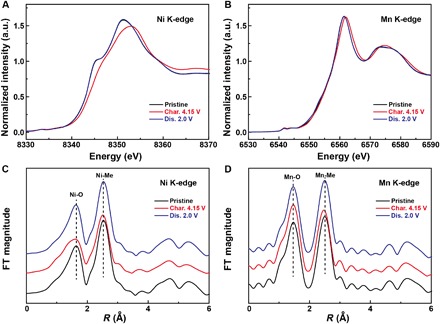
(A and B) Ex situ XANES spectra at the (A) Ni K-edge and (B) Mn K-edge of Na2/3−xNMT electrodes collected at different charge/discharge states. (C and D) Corresponding ex situ EXAFS spectra at the (C) Ni K-edge and (D) Mn K-edge of Na2/3−xNMT electrodes collected at different charge/discharge states. FT, Fourier transform.
Structural evolution and reaction mechanism
To understand the structural evolution during the charge/discharge process, in situ XRD experiments were carried out, as shown in Fig. 4. As Na+ is being extracted, the (002) and (004) peaks of P2-NaNM consecutively shift to a lower angle, whereas (100), (102), and (103) diffraction lines shift toward a higher angle (Fig. 4A). It indicates that the c axis is expanding, and the ab plane is contracting because of increased electrostatic repulsion between adjacent oxygen layers and smaller ionic radius, respectively, by Ni2+→Ni3+ (33). Noticing that no additional diffraction lines beyond the P2 structure are detected, the shape of the (004) peak becomes an asymmetry with a broad feature, which could be attributed to the rearrangement of different in-plane Na orderings (34). These observations suggest that the Na extraction in P2-NaNM is actually a quasi-solid–solution reaction, which matches well with the voltage plateaus in charge/discharge curves. Similar structure evolution was observed for P2-NaNMT except that the (004) peaks only show peak position shift without any shape change (Fig. 4B), indicating an absolute solid-solution behavior consistent with the sloping electrochemical curves. Moreover, these peak shifts are highly reversible after sodium is inserted back to the crystal lattice. The detailed change of the lattice parameter during the charge/discharge process is shown in fig. S11. In contrast with P2-NaNM, the lattice parameters (a and c), especially unit cell volume of P2-NaNMT, all change linearly with the slope of the charge/discharge curves, demonstrating sustainable structure evolution and complete single-phase reaction upon Na+ extraction and insertion. Furthermore, the unit cell volume change of P2-NaNMT before and after Na extraction is merely −0.64%, which is close to zero-strain characteristics and responsible for the excellent cycling stability cycled at 1 C over 500 cycles. Not only could a half substation of Ti for Mn in P2-NaNM eliminate in-plane orderings within sodium layers but it also could suppress the frequent P2-O2 phase transition at 4.2 V by preventing the TMO2 slabs from gliding to form the O2 phase, as illustrated in fig. S12. It is evidenced that the O2 characteristic (002′) and (112′) peaks that are located at about 21° and 70° (24), respectively, disappeared in P2-Na1−xNMT electrodes even charged to 4.3 V (fig. S13), resulting in an improved cycling performance in a wider potential range of 2.5 to 4.3 V.
Fig. 4. Crystal structural evolution under electrochemical Na+ (de)intercalation.
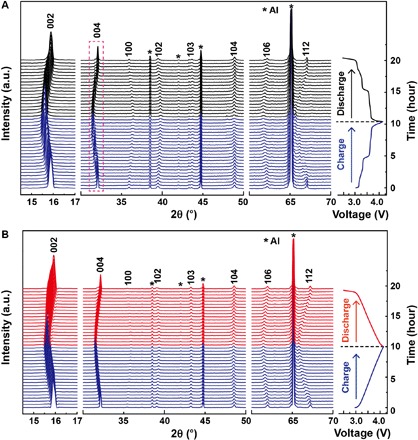
(A and B) In situ XRD patterns collected during the first charge/discharge of the (A) Na/Na2/3−xNM and (B) Na/Na2/3−xNMT cells under a current rate of 0.1 C between 2.5 and 4.15 V.
Combining in situ XRD results and electrochemical curves, there are two major intermediate phases in P2-NaδNM at 3.5 and 4.0 V, which corresponds to the Na concentration of 1/2 and 1/3 with different in-plane ordering, respectively. Figure 5 (A and B) illustrates the two-dimensional (2D) in-plane Na ordering patterns with respect to the typical charge/discharge curves of P2-NaδNM, which consist of Naf connecting in a very intriguing pattern (25, 35–37). In “large zigzag” (LZZ) pattern for δ = 2/3, Naf sites form a zigzag pattern with distance 2|ahex| between the nearest Naf sites. When the concentration is reduced to 1/2, the ordering is converted from LZZ to rows in which Na orders alternate in one row of Naf and two rows of Nae in the plane. At δ = 1/3, either Naf or Nae arranges in rows within a single layer. It can be concluded that two voltage plateaus located at 3.3 and 3.7 V in P2-NaδNM arise from the in-plane ordering rearrangement of LZZ-row-row (38, 39). As discussed above, there are two types of Na sites that are Naf and Nae in the P2 structure. The calculated total DFT energies (Fig. 5C) demonstrate that Ni/Mn/Ti mixing effectively decreases the site energy difference between Nae and Naf, thus suppressing the Na-vacancy ordering, which could refrain the formation of strongly ordered intermediate phases, and promote complete solid-solution behavior over a wider range of Na content. So, the Na+/vacancy ordering-disordering transition phenomenon in this system mainly originates from the different Nae-Naf site energy after Ti substitution into the lattice.
Fig. 5. 2D Na+/vacancy ordering-disordering transition mechanism.
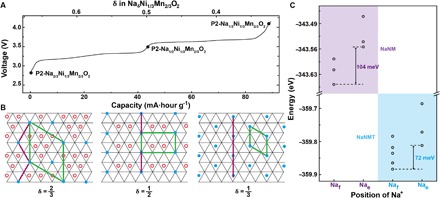
(A) Typical charge/discharge profiles of P2-NaNM. The two voltage plateaus indicates the rearrangement of Na+/vacancy ordering. (B) In-plane Na+/vacancy orderings of NaδNi1/3Mn2/3O2 in the triangular lattice at δ = 2/3, δ = 1/2, and δ = 1/3, respectively (empty red circles, Na+ on Nae sites; solid blue circles, Na+ on Naf sites; thick green lines, unit cell). (C) Calculated energy difference between the Nae and Naf site for P2-NaNM (purple background) and P2-NaNMT (blue background).
Na+ kinetics study
Owing to different Na-vacancy in-plane orderings at different Na contents in P2-NaNM, it can be assumed that such a fast self-arrangement upon charge/discharge might sacrifice Na-ion mobility. To verify this hypothesis, the apparent diffusion coefficients of Na+ of the two compounds were investigated by GITT (40, 41). The equilibrium voltage of P2-NaNMT shows a continuous change, confirming the single-phase reaction process during Na+ (de)intercalation between 2.5 and 4.15 V (fig. S14). Figure S15 compares the calculated Na diffusion coefficient (DNa+) in P2-NaNM and P2-NaNMT samples based on the GITT curves. The Na-ion mobility in P2-NaNMT is increased by two orders of magnitude with diffusion coefficients ranging from 10−10 to 10−9 cm2 s−1, whereas P2-NaNM showed diffusion coefficients of 10−12 to 10−11 cm2 s−1 in the Na range of 2/3 ≤ δ ≤ 1/3. Moreover, no jumps in the Na diffusion coefficient values are observed for P2-NaNMT, which could be attributed to Na-vacancy disordering in the compound and consistent with the sloping characteristic of the electrochemical curves. Noticeably, this fast diffusivity of Na ions in P2-NaNMT could accelerate its self-discharge as compared in fig. S16, which needs to be further mitigated. A lower charge transfer resistance (Rct) at the electrode/electrolyte interface and faster Na+ diffusion associated with Warburg impedance (Zw) are obtained for P2-NaNMT using an electrochemical impedance spectroscopy (EIS) technique (fig. S17), which provides another side evidence that Na disordering facilitates electronic and Na+ migration (42, 43).
Given that Na+ in P2-type layered structure occupies open trigonal prisms thus providing wide ionic transport channels, the presence of Na+/vacancy disordering will decrease the activation energy barrier for Na+ hops between adjacent prismatic sites and consequently enhance Na+ diffusion. First-principles molecular dynamics (FPMD) calculations were performed at temperatures ranging from 500 to 900 K to obtain Na+ ion transport property in this disordered P2-NaNMT. From the mean square displacements (MSDs) of Na+ for P2-Na0.58NMT observed for all temperatures (fig. S18), the Na+ diffusion gets easier as the temperature increases. It is clearly seen that the Na+ migrates through 2D passages characterized by interconnected diffusion paths (Fig. 6A), which favors the fast ion mobility and excellent kinetic property. The corresponding top view of trajectories in single sodium layer suggests the pathways along ideal Naf-Nae-Naf sites. The slope of MSD time curves is fitted to obtain the diffusion coefficient (D). According to the slope of Arrhenius plot in Fig. 6B, the calculated diffusion energy barrier (Ea) is a very low barrier of 0.17 eV, which is in good agreement with the GITT results. A summary of the diffusion coefficients and activation energies of the most common Na-based layered oxides studied in the literatures is compared in table S4. It is highlighted that both Na diffusion coefficients and computed activation energy of the P2-NaNMT correspond to the top level among TM layered oxides (44–52). In short, we may surmise that Ti substitution in P2-NaNM has two effects: (i) the suppression of Na-vacancy ordering, resulting in a wider range of complete solid-solution behavior, and (ii) the reduction of site energy difference between Nae and Naf and hence diffusion properties.
Fig. 6. Na+ kinetics of P2-NaNMT obtained by FPMD simulations.
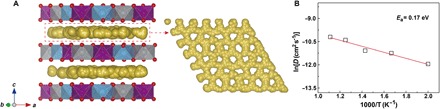
(A) Trajectories of Na+ in P2-Na0.57NMT simulated at a temperature of 800 K. The top view of each Na+ layer is given in the right panel. (B) Arrhenius plot of Na+ diffusion coefficients.
DISCUSSION
In summary, we have successfully constructed a fully disordered P2-NaNMT material on Na lattices over the studied range of Na concentrations (δ = 2/3 to 1/3). Partial Ti substitution for Mn with compatible ionic radii and very different Fermi levels in P2-NaNM effectively refrains electron delocalization, hence charge ordering and Na+/vacancy ordering. As a result, a high Na+ mobility and low activation energy barriers are achieved in the Na interlayer, leading to smooth electrochemistry without any voltage plateau, outstanding cycling stability (83.9% capacity retention after 500 cycles at 1 C), and excellent rate capability (77.5% capacity retention at 20 C) in NIBs. Therefore, reasonable ionic substitution by inactive dopants, such as Li+, Ti4+, Mg2+, and Zn2+, with no d electrons, might be a sensible strategy to modulate the composition of the metal lattice so as to avoid the Na-vacancy ordering for optimal Na diffusion. Our study offers new insights into the rational design of high-rate layered cathode materials and also pushes the practical application of NIBs as a decisive step forward.
MATERIALS AND METHODS
Synthesis
The P2-NaNM and P2-NaNMT samples were synthesized by a solid-state reaction method from stoichiometric mixtures of Na2CO3 (99.5%; 5 mole percent access; Alfa Aesar), NiO (99%; Alfa Aesar), Mn2O3 (98%; Alfa Aesar), and TiO2 (anatase, 99.6%; Alfa Aesar). The mixtures were ground and pressed into pellets under 20 MPa, and then the pellets were calcined at 950°C in air for 15 hours, cooled to room temperature, and stored in an argon-filled glove box until use.
Characterizations
X-ray powder diffraction was done in a Bruker D8 Advance diffractometer with Cu Kα radiation (λ = 1.5418 Å). A General Structure Analysis System program was used to perform Rietveld refinement. For the in situ XRD experiment, a specially designed Swagelok cell was equipped with an aluminum window for x-ray penetration. The morphology and microstructure were characterized by scanning electron microscopy (SEM; JEOL JSM-6701F). The HRTEM image and EDS maps were examined by TEM (JEM 2100F). ABF and HAADF imaging were executed using a JEOL ARM200F (JEOL) STEM operated at 200 kV with a cold field-emission gun and double hexapole Cs correctors (CEOS GmbH). XPS measurements were carried out with a ESCALAB 250Xi spectrometer (Thermo Fisher Scientific) using an Al Kα achromatic x-ray source. XAS measurements were done at beamline BL14W1 of the Shanghai Synchrotron Radiation Facility (SSRF), China, operating with a Si(111) double-crystal monochromator.
Electrochemistry
The working electrode was prepared by mixing 75% active material, 15% Super P carbon, and 10% polyvinylidene difluoride (Sigma-Aldrich) binder onto aluminum foil, followed by drying at 80°C in vacuum overnight. The loading mass of active material was 3 to 4 mg cm−2. The electrolyte was 1 M NaPF6 in ethylene carbonate and diethyl carbonate (1:1 in volume; 5% fluoroethylene carbonate). Sodium foil and porous glass fiber (GF/D) were used as the counter electrode and separator, respectively. Coin cells (CR2032) were assembled in an argon-filled glove box (H2O and O2 < 0.1 parts per million). An Arbin battery test system was used to perform discharge and charge measurements over a voltage range of 2.5 to 4.15 V and 2.5 to 4.3 V at a rate of 0.1 C at 25°C. CV measurements were performed on an Autolab PG302N electrochemical workstation at a scan rate of 0.1 mV s−1. For the GITT tests, the batteries were charged at a current of 17 mA g −1 for 30 min, followed by open-circuit relaxation for 10 hours.
where i is the pulse current (A), Vm is the molar volume (cm3 mol−1), zA is the charge number (1 for Na/Na+), F is the Faraday’s constant (C mol−1; 96485 C mol−1), S is the surface area of electrode (cm2), dE/dδ is the change of voltage with respect to composition during current pulse, and dE/dt1/2 is the change of voltage with respect to the square root of time during the period in between current pulse.
For the self-discharge tests, the batteries were charged to 4.15 V at 0.1 C, followed by open-circuit relaxation at 45°C for 24 hours, and then the open-circuit voltage (OCV) was recorded at room temperature every 15 min.
DFT calculations
To calculate the energy difference between the Nae and Naf sites, the 3a × 3b × 1c supercell with one Na ion was constructed to avoid the Coulombic repulsion between different Na ions. The difference of site energy is given by the following equation
where E(Nae) and E(Naf) are the total DFT energies of bulk models with one ion occupying Nae and Naf site, respectively.
To simulate the Na ion transport properties in P2-Na0.58NMT, the DFT calculations were performed within the 3a × 3b × 1c supercell as implemented in Viena ab initio simulation package. The projector augmented-wave method and generalized gradient approximation (GGA) in the Perdew-Burke-Ernzerhof parameterization were used. GGA + U was applied in this work, in which the applied effective U value given to Ni ions was 6.1 eV, to Mn was 4.0 eV, and to Ti was 2.3 eV. For ensuring the configuration, an energy cutoff of 520 eV and a k-mesh of 0.03 Å−1 were used. The force convergence criterion for the relaxation was 0.01 eV Å−1. For the FPMD calculations of each temperature, a time step of 1 fs was used to simulate a total time of 10 ps by a Nose-Hoover thermostat. An energy cutoff of 450 eV was used with a k-point sampling at the Γ point. The ionic diffusion behavior can be calculated by a time-dependent MSD
in which ri(t) is the site of the i-th Na+ at the time t. According to the Einstein equation, the diffusion coefficient D is given by the slope of MSD
Thus, the activation energy barrier is correlated with the diffusion coefficients at various temperatures based on Arrhenius equation.
Supplementary Material
Acknowledgments
Funding: This work was supported by the Basic Science Center Project of National Natural Science Foundation of China (grant no. 51788104), the National Natural Science Foundation of China (grant nos. 51772301 and 21773264), the National Key R&D Program of China (grant no. 2016YFA0202500), and the “Strategic Priority Research Program” of the Chinese Academy of Sciences (grant no. XDA09010100). The authors acknowledge the support by the beamline BL14W1 of the SSRF, China. Author contributions: Y.-G.G. and Y.-X.Y. proposed and supervised the project. Y.-G.G. and P.-F.W. conceived and designed the experiments with the help from Y.-X.Y. P.-F.W. carried out the synthesis, electrochemical experiments, and in situ XRD measurements. L.G. performed STEM observation. X.-Y.L. and Y.W. analyzed the images with L.G. J.-N.Z. performed ex situ XAS measurements, and X.Y. analyzed the XAS data. H.-R.Y. performed the first-principles calculations. All authors participated in analyzing the experimental results and preparing the manuscript. Competing interests: The authors declare that they have no competing interests. Data and materials availability: All data needed to evaluate the conclusions in the paper are present in the paper and/or the Supplementary Materials. Additional data related to this paper may be requested from the authors.
SUPPLEMENTARY MATERIALS
Supplementary material for this article is available at http://advances.sciencemag.org/cgi/content/full/4/3/eaar6018/DC1
fig. S1. Powder XRD patterns of as-synthesized P2-NaNM and P2-NaNMT samples.
fig. S2. In situ XRD patterns of P2-NaNM and P2-NaNMT powders at different temperatures.
fig. S3. SEM images of P2-NaNM and P2-NaNMT sample.
fig. S4. TEM and HRTEM images of P2-NaNMT sample.
fig. S5. Cycling performance comparison of P2-NaNM and P2-NaNMT electrodes at 0.1 C in the voltage range of 2.5 to 4.15 V during 100 cycles.
fig. S6. SEM images of P2-NaNM and P2-NaNMT electrodes after long cycles.
fig. S7. Charge/discharge profiles of P2-NaNM and P2-NaNMT electrodes between 2.5 and 4.3 V.
fig. S8. Cycling performance comparison of P2-NaNM and P2-NaNMT electrodes at 0.1 C in the voltage range of 2.5 to 4.3 V during 100 cycles.
fig. S9. CVs of P2-NaNM and P2-NaNMT electrodes.
fig. S10. XPS spectra of P2-NaNM and P2-NaNMT powders.
fig. S11. Variation of lattice constants and unit cell volume during cycling.
fig. S12. Schematic illustration for P2-O2 phase transition.
fig. S13. In situ XRD patterns of P2-NaNM and P2-NaNMT electrodes between 2.5 and 4.3 V.
fig. S14. GITT curves and the quasi-equilibrium potential as a function of the stoichiometry.
fig. S15. Calculated Na chemical diffusion coefficients from GITT.
fig. S16. OCV decay of P2-NaNM and P2-NaNMT electrodes.
fig. S17. Nyquist plots of EIS and the fit for P2-NaNM and P2-NaNMT electrodes.
fig. S18. MSD curves for each kind of ions in P2-Na0.58NMT.
table S1. Crystallographic parameters of P2-NaNM refined by the Rietveld method.
table S2. Crystallographic parameters of P2-NaNMT refined by the Rietveld method.
table S3. Atomic distances, slab thickness, and d-spacing of the Na layer and interslab distance for as-prepared materials.
table S4. Summary of Na+ diffusion coefficients and activation energies in layered oxides.
REFERENCES AND NOTES
- 1.Armand M., Tarascon J.-M., Building better batteries. Nature 451, 652–657 (2008). [DOI] [PubMed] [Google Scholar]
- 2.Yabuuchi N., Kubota K., Dahbi M., Komaba S., Research development on sodium-ion batteries. Chem. Rev. 114, 11636–11682 (2014). [DOI] [PubMed] [Google Scholar]
- 3.Dong X., Chen L., Liu J., Haller S., Wang Y., Xia Y., Environmentally-friendly aqueous Li (or Na)-ion battery with fast electrode kinetics and super-long life. Sci. Adv. 2, e1501038 (2016). [DOI] [PMC free article] [PubMed] [Google Scholar]
- 4.Park H., Kwon J., Choi H., Song T., Paik U., Microstructural control of new intercalation layered titanoniobates with large and reversible d-spacing for easy Na+ ion uptake. Sci. Adv. 3, e1700509 (2017). [DOI] [PMC free article] [PubMed] [Google Scholar]
- 5.Yoshida H., Yabuuchi N., Kubota K., Ikeuchi I., Garsuch A., Schulz-Dobrick M., Komaba S., P2-type Na2/3Ni1/3Mn2/3−xTixO2 as a new positive electrode for higher energy Na-ion batteries. Chem. Commun. 50, 3677–3680 (2014). [DOI] [PubMed] [Google Scholar]
- 6.Delmas C., Fouassier C., Hagenmuller P., Structural classification and properties of the layered oxides. Physica 99B, 81–85 (1980). [Google Scholar]
- 7.Clément R. J., Bruce P. G., Grey C. P., Review—Manganese-based P2-type transition metal oxides as sodium-ion battery cathode materials. J. Electrochem. Soc. 162, A2589–A2604 (2015). [Google Scholar]
- 8.Kubota K., Komaba S., Review—Practical issues and future perspective for Na-ion batteries. J. Electrochem. Soc. 162, A2538–A2550 (2015). [Google Scholar]
- 9.Xu J., Lee D. H., Clément R. J., Yu X., Leskes M., Pell A. J., Pintacuda G., Yang X.-Q., Grey C. P., Meng Y. S., Identifying the critical role of Li substitution in P2-Nax[LiyNizMn1−y−z]O2 (0 < x, y, z < 1) intercalation cathode materials for high-energy Na-ion batteries. Chem. Mater. 26, 1260–1269 (2014). [Google Scholar]
- 10.Singh G., Tapia-Ruiz N., Lopez del Amo J. M., Maitra U., Somerville J. W., Armstrong A. R., Martinez de Ilarduya J., Rojo T., Bruce P. G., High voltage Mg-doped Na0.67Ni0.3−xMgxMn0.7O2 (x = 0.05, 0.1) Na-ion cathodes with enhanced stability and rate capability. Chem. Mater. 28, 5087–5094 (2016). [Google Scholar]
- 11.Wang P.-F., You Y., Yin Y.-X., Wang Y.-S., Wan L.-J., Gu L., Guo Y.-G., Suppressing the P2–O2 phase transition of Na0.67Mn0.67Ni0.33O2 by magnesium substitution for improved sodium-ion batteries. Angew. Chem. Int. Ed. 55, 7445–7449 (2016). [DOI] [PubMed] [Google Scholar]
- 12.Wu X., Guo J., Wang D., Zhong G., McDonald M. J., Yang Y., P2-type Na0.66Ni0.33−xZnxMn0.67O2 as new high-voltage cathode materials for sodium-ion batteries. J. Power Sources 281, 18–26 (2015). [Google Scholar]
- 13.Wang L., Sun Y.-G., Hu L.-L., Piao J.-Y., Guo J., Manthiram A., Ma J., Cao A.-M., Copper-substituted Na0.67Ni0.3−xCuxMn0.7O2 cathode materials for sodium-ion batteries with suppressed P2–O2 phase transition. J. Mater. Chem. A 5, 8752–8761 (2017). [Google Scholar]
- 14.Zheng C., Radhakrishnan B., Chu I.-H., Wang Z. B., Ong S. P., Effects of transition-metal mixing on Na ordering and kinetics in layered P2 oxides. Phys. Rev. Appl. 7, 064003 (2017). [Google Scholar]
- 15.Mortemard de Boisse B., Liu G., Ma J., Nishimura S.-i., Chung S.-C., Kiuchi H., Harada Y., Kikkawa J., Kobayashi Y., Okubo M., Yamada A., Intermediate honeycomb ordering to trigger oxygen redox chemistry in layered battery electrode. Nat. Commun. 7, 11397 (2016). [DOI] [PMC free article] [PubMed] [Google Scholar]
- 16.Li X., Ma X., Su D., Liu L., Chisnell R., Ong S. P., Chen H., Toumar A., Idrobo J.-C., Lei Y., Bai J., Wang F., Lynn J. W., Lee Y. S., Ceder G., Direct visualization of the Jahn–Teller effect coupled to Na ordering in Na5/8MnO2. Nat. Mater. 13, 586–592 (2014). [DOI] [PubMed] [Google Scholar]
- 17.Wang Y., Xiao R., Hu Y.-S., Avdeev M., Chen L., P2-Na0.6[Cr0.6Ti0.4]O2 cation-disordered electrode for high-rate symmetric rechargeable sodium-ion batteries. Nat. Commun. 6, 6954 (2015). [DOI] [PMC free article] [PubMed] [Google Scholar]
- 18.Vinckevičiu̅tė J., Radin M. D., Van der Ven A., Stacking-sequence changes and Na ordering in layered intercalation materials. Chem. Mater. 28, 8640–8650 (2016). [Google Scholar]
- 19.Shu G. J., Prodi A., Chu S. Y., Lee Y. S., Sheu H. S., Chou F. C., Searching for stable Na-ordered phases in single-crystal samples of γ−NaxCoO2. Phys. Rev. B 76, 184115 (2007). [Google Scholar]
- 20.Zhang P., Capaz R. B., Cohen M. L., Louie S. G., Theory of sodium ordering in NaxCoO2. Phys. Rev. B 71, 153102 (2005). [Google Scholar]
- 21.Shu G. J., Chou F. C., Sodium-ion diffusion and ordering in single-crystal P2-NaxCoO2. Phys. Rev. B 78, 052101 (2008). [Google Scholar]
- 22.Berthelot R., Carlier D., Delmas C., Electrochemical investigation of the P2–NaxCoO2 phase diagram. Nat. Mater. 10, 74–80 (2011). [DOI] [PubMed] [Google Scholar]
- 23.Guignard M., Didier C., Darriet J., Bordet P., Elkaïm E., Delmas C., P2-NaxVO2 system as electrodes for batteries and electron-correlated materials. Nat. Mater. 12, 74–80 (2013). [DOI] [PubMed] [Google Scholar]
- 24.Lu Z., Dahn J. R., In situ x-ray diffraction study of P2-Na2/3[Ni1/3Mn2/3]O2. J. Electrochem. Soc. 148, A1225–A1229 (2001). [Google Scholar]
- 25.Lee D. H., Xu J., Meng Y. S., An advanced cathode for Na-ion batteries with high rate and excellent structural stability. Phys. Chem. Chem. Phys. 15, 3304–3312 (2013). [DOI] [PubMed] [Google Scholar]
- 26.Zheng L., Li J., Obrovac M. N., Crystal structures and electrochemical performance of air-stable Na2/3Ni1/3−xCuxMn2/3O2 in sodium cells. Chem. Mater. 29, 1623–1631 (2017). [Google Scholar]
- 27.Ying X. N., Xu Z. C., High temperature sodium ordering transition in NaxCoO2 studied by mechanical spectrum. J. Appl. Phys. 105, 063504 (2009). [Google Scholar]
- 28.Lu X., Wang Y., Liu P., Gu L., Hu Y.-S., Li H., Demopoulos G. P., Chen L., Direct imaging of layered O3- and P2-NaxFe1/2Mn1/2O2 structures at the atomic scale. Phys. Chem. Chem. Phys. 16, 21946–21952 (2014). [DOI] [PubMed] [Google Scholar]
- 29.Guo S., Liu P., Sun Y., Zhu K., Yi J., Chen M., Ishida M., Zhou H., A high-voltage and ultralong-life sodium full cell for stationary energy storage. Angew. Chem. Int. Ed. 54, 11701–11705 (2015). [DOI] [PubMed] [Google Scholar]
- 30.Yu X., Lyu Y., Gu L., Wu H., Bak S.-M., Zhou Y., Amine K., Ehrlich S. N., Li H., Nam K.-W., Yang X.-Q., Understanding the rate capability of high-energy-density Li-rich layered Li1.2Ni0.15Co0.1Mn0.55O2 cathode materials. Adv. Energy Mater. 4, 1300950 (2014). [Google Scholar]
- 31.Wang P.-F., Yao H.-R., Liu X.-Y., Zhang J.-N., Gu L., Yu X.-Q., Yin Y.-X., Guo Y.-G., Ti-substituted NaNi0.5Mn0.5-xTixO2 cathodes with reversible O3–P3 phase transition for high-performance sodium-ion batteries. Adv. Mater. 29, 1700210 (2017). [DOI] [PubMed] [Google Scholar]
- 32.Komaba S., Yabuuchi N., Nakayama T., Ogata A., Ishikawa T., Nakai I., Study on the reversible electrode reaction of Na1–xNi0.5Mn0.5O2 for a rechargeable sodium-ion battery. Inorg. Chem. 51, 6211–6220 (2012). [DOI] [PubMed] [Google Scholar]
- 33.Jung Y. H., Christiansen A. S., Johnsen R. E., Norby P., Kim D. K., In situ x-ray diffraction studies on structural changes of a P2 layered material during electrochemical desodiation/sodiation. Adv. Funct. Mater. 25, 3227–3237 (2015). [Google Scholar]
- 34.Kubota K., Yoda Y., Komaba S., Origin of enhanced capacity retention of P2-type Na2/3Ni1/3-xMn2/3CuxO2 for Na-ion batteries. J. Electrochem. Soc. 164, A2368–A2373 (2017). [Google Scholar]
- 35.Meng Y. S., Hinuma Y., Ceder G., An investigation of the sodium patterning in NaxCoO2 (0.5 ≤ x ≤ 1) by density functional theory methods. J. Chem. Phys. 128, 104708 (2008). [DOI] [PubMed] [Google Scholar]
- 36.Roger M., Morris D. J. P., Tennant D. A., Gutmann M. J., Goff J. P., Hoffmann J.-U., Feyerherm R., Dudzik E., Prabhakaran D., Boothroyd A. T., Shannon N., Lake B., Deen P. P., Patterning of sodium ions and the control of electrons in sodium cobaltate. Nature 445, 631–634 (2007). [DOI] [PubMed] [Google Scholar]
- 37.Wu T., Liu K., Chen H., Wu G., Luo Q. L., Ying J. J., Chen X. H., Rearrangement of sodium ordering and its effect on physical properties in the NaxCoO2 system. Phys. Rev. B 78, 115122 (2008). [Google Scholar]
- 38.Mukhamedshin I. R., Alloul H., Na order and Co charge disproportionation in NaxCoO2. Physica B 460, 58–63 (2015). [Google Scholar]
- 39.Hinuma Y., Meng Y. S., Ceder G., Temperature-concentration phase diagram of P2-NaxCoO2 from first-principles calculations. Phys. Rev. B 77, 224111 (2008). [Google Scholar]
- 40.Bucher N., Hartung S., Franklin J. B., Wise A. M., Lim L. Y., Chen H.-Y., Weker J. N., Toney M. F., Srinivasan M., P2–NaxCoyMn1–yO2 (y = 0, 0.1) as cathode materials in sodium-ion batteries—Effects of doping and morphology to enhance cycling stability. Chem. Mater. 28, 2041–2051 (2016). [Google Scholar]
- 41.Guo S., Yu H., Jian Z., Liu P., Zhu Y., Guo X., Chen M., Ishida M., Zhou H., A high-capacity, low-cost layered sodium manganese oxide material as cathode for sodium-ion batteries. ChemSusChem 7, 2115–2119 (2014). [DOI] [PubMed] [Google Scholar]
- 42.Zhang J.-j., He P., Xia Y.-y., Electrochemical kinetics study of Li-ion in Cu6Sn5 electrode of lithium batteries by PITT and EIS. J. Electroanal. Chem. 624, 161–166 (2008). [Google Scholar]
- 43.Tang K., Yu X., Sun J., Li H., Huang X., Kinetic analysis on LiFePO4 thin films by CV, GITT, and EIS. Electrochim. Acta 56, 4869–4875 (2011). [Google Scholar]
- 44.Katcho N. A., Carrasco J., Saurel D., Gonzalo E., Han M., Aguesse F., Rojo T., Origins of bistability and Na ion mobility difference in P2-and O3-Na2/3Fe2/3Mn1/3O2 cathode polymorphs. Adv. Energy Mater. 7, 1601477 (2017). [Google Scholar]
- 45.Wang P.-F., You Y., Yin Y.-X., Guo Y.-G., An O3-type NaNi0.5Mn0.5O2 cathode for sodium-ion batteries with improved rate performance and cycling stability. J. Mater. Chem. A 4, 17660–17664 (2016). [Google Scholar]
- 46.Yao H.-R., Wang P.-F., Wang Y., Yu X., Yin Y.-X., Guo Y.-G., Excellent comprehensive performance of Na-based layered oxide benefiting from the synergetic contributions of multimetal ions. Adv. Energy Mater. 7, 1700189 (2017). [Google Scholar]
- 47.Yue J.-L., Zhou Y.-N., Yu X., Bak S.-M., Yang X.-Q., Fu Z.-W., O3-type layered transition metal oxide Na(NiCoFeTi)1/4O2 as a high rate and long cycle life cathode material for sodium ion batteries. J. Mater. Chem. A 3, 23261–23267 (2015). [Google Scholar]
- 48.Wang Y., Yu X., Xu S., Bai J., Xiao R., Hu Y.-S., Li H., Yang X.-Q., Chen L., Huang X., A zero-strain layered metal oxide as the negative electrode for long-life sodium-ion batteries. Nat. Commun. 4, 2365 (2013). [DOI] [PubMed] [Google Scholar]
- 49.Guo S., Sun Y., Yi J., Zhu K., Liu P., Zhu Y., Zhu G.-z., Chen M., Ishida M., Zhou H., Understanding sodium-ion diffusion in layered P2 and P3 oxides via experiments and first-principles calculations: A bridge between crystal structure and electrochemical performance. NPG Asia Mater. 8, e266 (2016). [Google Scholar]
- 50.Li Z. Y., Zhang J. C., Gao R., Zhang H., Zheng L. R., Hu Z. B., Liu X. F., Li-substituted Co-free layered P2/O3 biphasic Na0.67Mn0.55Ni0.25Ti0.2−xLixO2 as high-rate-capability cathode materials for sodium ion batteries. J. Phys. Chem. C 120, 9007–9016 (2016). [Google Scholar]
- 51.Li Z.-Y., Gao R., Sun L., Hu Z., Liu X., Designing an advanced P2-Na0.67Mn0.65Ni0.2Co0.15O2 layered cathode material for Na-ion batteries. J. Mater. Chem. A 3, 16272–16278 (2015). [Google Scholar]
- 52.Zhang X.-H., Pang W.-L., Wan F., Guo J.-Z., Lu H.-Y., Li J.-Y., Xing Y.-M., Zhang J.-P., Wu X.-L., P2–Na2/3Ni1/3Mn5/9Al1/9O2 microparticles as superior cathode material for sodium-ion batteries: Enhanced properties and mechanisam via graphene connection. ACS Appl. Mater. Interfaces 8, 20650–20659 (2016). [DOI] [PubMed] [Google Scholar]
Associated Data
This section collects any data citations, data availability statements, or supplementary materials included in this article.
Supplementary Materials
Supplementary material for this article is available at http://advances.sciencemag.org/cgi/content/full/4/3/eaar6018/DC1
fig. S1. Powder XRD patterns of as-synthesized P2-NaNM and P2-NaNMT samples.
fig. S2. In situ XRD patterns of P2-NaNM and P2-NaNMT powders at different temperatures.
fig. S3. SEM images of P2-NaNM and P2-NaNMT sample.
fig. S4. TEM and HRTEM images of P2-NaNMT sample.
fig. S5. Cycling performance comparison of P2-NaNM and P2-NaNMT electrodes at 0.1 C in the voltage range of 2.5 to 4.15 V during 100 cycles.
fig. S6. SEM images of P2-NaNM and P2-NaNMT electrodes after long cycles.
fig. S7. Charge/discharge profiles of P2-NaNM and P2-NaNMT electrodes between 2.5 and 4.3 V.
fig. S8. Cycling performance comparison of P2-NaNM and P2-NaNMT electrodes at 0.1 C in the voltage range of 2.5 to 4.3 V during 100 cycles.
fig. S9. CVs of P2-NaNM and P2-NaNMT electrodes.
fig. S10. XPS spectra of P2-NaNM and P2-NaNMT powders.
fig. S11. Variation of lattice constants and unit cell volume during cycling.
fig. S12. Schematic illustration for P2-O2 phase transition.
fig. S13. In situ XRD patterns of P2-NaNM and P2-NaNMT electrodes between 2.5 and 4.3 V.
fig. S14. GITT curves and the quasi-equilibrium potential as a function of the stoichiometry.
fig. S15. Calculated Na chemical diffusion coefficients from GITT.
fig. S16. OCV decay of P2-NaNM and P2-NaNMT electrodes.
fig. S17. Nyquist plots of EIS and the fit for P2-NaNM and P2-NaNMT electrodes.
fig. S18. MSD curves for each kind of ions in P2-Na0.58NMT.
table S1. Crystallographic parameters of P2-NaNM refined by the Rietveld method.
table S2. Crystallographic parameters of P2-NaNMT refined by the Rietveld method.
table S3. Atomic distances, slab thickness, and d-spacing of the Na layer and interslab distance for as-prepared materials.
table S4. Summary of Na+ diffusion coefficients and activation energies in layered oxides.