Figure 1.
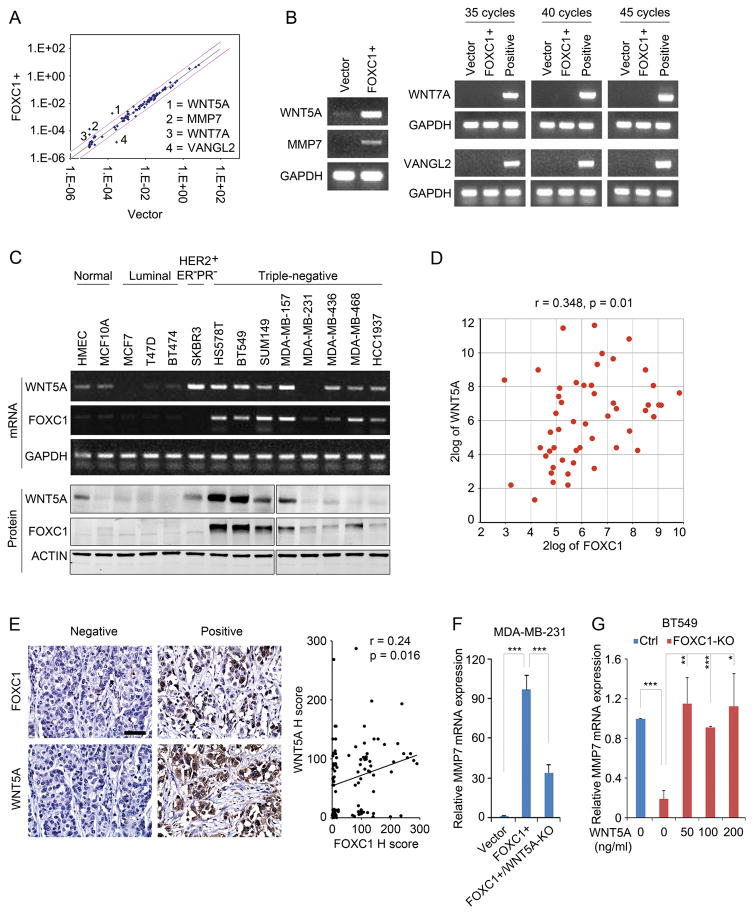
WNT5A is up-regulated by FOXC1 in TNBC cells. A, WNT signaling PCR array assays in control and FOXC1-overexpressing (FOXC1+) MDA-MB-231 cells (All the cell lines used in this study were acquired from American Type Culture Collection (ATCC) and maintained according to ATCC instructions). FOXC1-overexpressing stable cells were established as described previously.9 pCMV6 empty vector and pCMV6-FOXC1 were from Origene. WNT signaling PCR array was performed by using RT2 Profiler PCR Array Human WNT Signaling Pathway Plus kit (Qiagen) according to the manufacturer’s instructions. B, PCR detection of the genes identified in PCR array assays. Positive control mRNAs for WNT7A and VANGL2 were from HCC1937 and SUM149 cells, respectively. GAPDH was used as an internal control. Primers used were: PCR: WNT5A-forward: 5′-AAGCCCTAATTACCGCCGTC-3′, WNT5A-reverse: 5′-TCCAATGGA CTTCTTCATGGC-3′; MMP7-forward: 5′-GCTACAGTGGGAACAGGCTC-3′, MMP7-reverse: 5′-GGGATCTCTTTGCCCCACAT-3′; WNT7A-forward: 5′-GATCAAGCAGAA TGCCCGGA-3′, WNT7A-reverse: 5′-CTGCACGTGTTGCACTTGAC-3′; VANGL2-forward: 5′-GGGGGTGACCAGACTCAAGA-3′, VANGL2-reverse: 5′-CTCTTAGAGCGGTGTCGG TC-3′. GAPDH-forward: 5′-ATGGGTGTGAACCATGAGAA-3′; GAPDH-reverse: 5′-GT GCTAAGCAGTTGGTGGT G-3′. C, PCR and western blotting assays of FOXC1 and WNT5A expression in various normal mammary epithelial cells and breast cancer cell lines. GAPDH and ACTIN were used as internal controls for mRNA and protein, respectively. The primary antibodies used were WNT5A (1:300, MAB645, R&D systems), FOXC1 (1:500, sc-21394, Santa Cruz), and ACTIN (1:1000, sc-1616, Santa Cruz). D, correlation analysis between FOXC1 and WNT5A mRNAs in 51 breast cancer cell lines. Analysis was performed using the online tool (http://hgserver1.amc.nl/cgi-bin/r2/main.cgi). E, correlation analysis of FOXC1 and WNT5A proteins based on IHC staining in TNBC samples (n = 100). Scale bar = 50 μm. Immunohistochemistry (IHC) was performed as described previously.9 Formalin-fixed paraffin-embedded TNBC tissue microarray slides were from US Biomax (BR10011a). Primary antibodies used were FOXC1 (1:50, Onconostic Technologies) and WNT5A (1:500, ab86720, Abcam). The IHC staining intensity was presented using the pathological H-score and the regression correlation was analyzed. F and G, real-time PCR analysis of MMP7 mRNA expression in MDA-MB-231 cells (F) and BT549 cells (G). MMP7 primers were: MMP7-forward: 5′-AAGTGGTCACCTACAGGATCG-3′, MMP7-reverse: 5′-TGGCCCATCAAATGGGTAGG -3′. FOXC1-KO BT549 cells were treated with different concentrations of recombinant WNT5A protein (R&D Systems) for 4 hours. The knockout of FOXC1 and WNT5A was performed by using CRISPR/Cas9 (#52961, Addgene).35 The guide RNA (gRNA) sequences were: FOXC1: 5′-GGGTGCGAGTACACGCTCAT-3′; WNT5A: 5′-TTCAATTACAACCTGGGCGA-3′. The bar graph indicates mean ± SD, n = 3. *, p < 0.05, **, p < 0.01, ***, p < 0.001.

