

Abstract
Purpose
Colorectal cancers (CRCs) are classified as right/left sided based on whether they occur before/after the splenic flexure, with established differences in molecular subtypes and outcomes. However, it is unclear if this division is optimal and whether precise tumor location provides further information.
Experimental Design
In 1,876 patients with CRC we compared mutation prevalence and overall survival (OS) according to side and location. Consensus Molecular Subtype (CMS) was compared in a separate cohort of 608 patients.
Results
Mutation prevalence differed by side and location for TP53, KRAS, BRAFV600, PIK3CA, SMAD4, CTNNB1, GNAS, and PTEN. Within left and right sided tumors, there remained substantial variations in mutation rates. For example, within right sided tumors, RAS mutations decreased from 70% for cecal, to 43% for hepatic flexure location (P=0.0001), while BRAFV600 mutations increased from 10% to 22% between the same locations (P<0.0001). Within left sided tumors, the sigmoid and rectal region had more TP53 mutations (P=0.027), less PIK3CA (P=0.0009), BRAF (P=0.0033), or CTNNB1 mutations (P<0.0001), and less MSI (P<0.0001) than other left sided locations. Despite this, a left/right division preceding the transverse colon maximized prognostic differences by side and transverse colon tumors had K-modes mutation clustering that appeared more left than right sided. CMS profiles showed a decline in CMS1 and CMS3, and rise in CMS2 prevalence moving distally.
Conclusions
Current right/left classifications may not fully recapitulate regional variations in tumor biology. Specifically, the sigmoid-rectal region appears unique and the transverse colon is distinct from other right sided locations.
Keywords: colon, mutation, proximal, distal, right, left, Consensus Molecular Subtypes
Introduction
Primary tumor sidedness has prognostic value in metastatic colorectal cancer (mCRC). Patients with right sided tumors have worse overall survival (OS) following first line chemotherapy than those with left sided tumors(1). This effect appears independent of BRAF mutation status and mucinous histology, both of which are more common in right sided tumors(2). There are other molecular features that distinguish right from left sided tumors, including a higher incidence of microsatellite instability (MSI), an association with CpG island methylator phenotype (CIMP-H), and an association with Consensus Molecular Subtype-1 (CMS-1) in right sided tumors (3–5). Each of these features are individually associated with worse outcomes, however when analyzed in multivariate models that control for these factors, it appears that tumor location is still important (3,6). This suggests that we do not fully understand the molecular underpinnings of this phenomenon.
Retrospective analyses of multiple trials have shown that in RAS/BRAF wild type patients with mCRC, there is a differential response to anti-EGFR therapy based on side(7,8). In CRYSTAL, FIRE-3, PRIME, PEAK, 80405, 181 and NCIC CO.17, it appeared that left sided tumors have improved outcomes with anti-EGFR therapy, while right sided tumors have a worse outcome than if they did not receive anti-EGFR therapy(9–13). This differential outcome by side was not only present, but was very large. In 80405, median OS (mOS) for right sided patients treated with a doublet + bevacizumab was 29.2 months, compared to 13.7 months with a doublet + cetuximab. This stands in stark contrast to a mOS of 39.3 months for doublet + cetuximab vs 32.7 months for doublet + bevacizumab in left sided tumors(11). In a meta-analysis that included the data from all of these trials, left sided patients were shown to have greater benefit from chemotherapy + anti-EGFR (HR 0.71; 95% CI 0.58–0.85; P=0.0003) compared to chemotherapy + bevacizumab, while right sided tumors had trends towards harm with anti-EGFR therapy (HR 1.3; 95% CI 0.97–1.74; P=0.081)(1).
Given that disparate responses to anti-EGFR therapy based on side were present in RAS/BRAF wild type patients, it is clear that further assessment of the biological differences between tumors at different locations is required. Until now, most studies have used a divide of the splenic flexure to split right/proximal tumors from left/distal tumors. We sought to evaluate whether a more precise definition of tumor location may provide further information about a tumor’s biology and clinical course. We retrospectively reviewed all clinical and next generation sequencing (NGS) panel data from 1,876 patients with mCRC and have summarized the molecular alterations based on tumor location with the typical left vs right division, as well as by the anatomic sites of cecum, ascending colon, hepatic flexure, transverse colon, splenic flexure, descending colon, sigmoid colon, rectosigmoid junction, and rectum. We also present a comparison of OS based on location subsite. In two additional cohorts, CMS subtype and CpG Island Methylator Phenotype have been compared by side and location.
Methods
Patient population
After obtaining approval from the institutional review board at The University of Texas MD Anderson Cancer Center (MDACC), the records of all patients with biopsy proven mCRC who had a 46 or 50 gene Clinical Laboratory Improvement Amendments (CLIA) NGS panel performed as part of their care between January 1, 2012 and September 1, 2016 were reviewed. Right sided tumors were defined based on pathology and surgical reports as those occurring from the cecum up to but not including the splenic flexure, while left sided colon cancers were defined as occurring from the splenic flexure to the rectum. The pathology department uses a mixture of information from the specimen label submitted by a surgeon, type of surgery, and measurement of distance from known anatomic landmarks or proximal and distal margins to assign a tumor location. For endoscopically defined locations, the annotation of location from the endoscopy report is used for annotation. For patients with resection performed outside of MD Anderson, a pathology review is obtained on any available primary resection specimens or tissue biopsies, and surgical or endoscopic reports are reviewed. This information is collected in a uniform manner by our tumor registry as part of the institution’s NCI Cancer Center Support Grant. After primary review of tumor location, the primary coder then gives the chart to second coder who verifies site, histology and stage. Through this process, we are able to provide two-coder verification for all charts abstracted. In more difficult cases, the manager of the coding section will contact colorectal cancer physicians to assure that the most accurate information is abstracted.
A second cohort of 196 patients from MDACC with Affymetrix microarray RNA expression was combined with 412 patients from The Cancer Genome Atlas (TCGA) project with publicly available expression data to compare CMS subtype by location(14). Patients in this second cohort were stage I-IV and this population was utilized only for comparison of CMS subtype distribution by location. A previously published gene expression profile was used for this classification(4). A third cohort of 457 mCRC patients was reviewed to provide information about CpG island methylation phenotype status. These patients were derived from the ATTACC umbrella protocol (NCT01196130) at MDACC. PCR-based pyrosequencing of DNA was performed to examine the methylation status of multiple CpG island loci for each of the tested genes (hMLH1, Mint1, Mint2, Mint31, p14, and p16). CIMP-H tumors were defined as those with ≥40% of CpG Island loci methylated.
NGS panel
Tumor sequencing was performed in the CLIA environment of MDACC’s Molecular Diagnostics Laboratory. Archival formalin-fixed paraffin embedded (FFPE) samples from either surgical resection specimens or tissue biopsies with >20% tumor content were used for sequencing. Sequencing results from primaries or metastatic biopsies were considered together as prior evidence suggests there is a high level of concordance between primary and metastatic lesions(15). DNA extraction used a PicoPure DNA extraction kit (Arcturus, Mountain View, CA) and was purified using an Agencourt AMPure XP kit (Agencourt Biosciences, Beverly, MA). DNA quantification was performed with a Qubit DNA assay kit (ThermoFisher Scientific, Waltham, MA). Library preparation was performed using the Ion Torrent AmpliSeq 2.0 Beta kit and Ion Torrent Ampliseq Cancer Panel Primers (Life Technologies, Grand Island, NY). Until September 10, 2013, version 1.0 of the panel which included 46 cancer related genes was utilized. Subsequently, version 2.0 of the panel was used which included an additional 4 genes. For patients who had version 2.0, only the 46 genes used for the entire cohort were reported. Sequencing was performed using an Ion Torrent Personal Genome Machine Sequencer and adequately covered amplicons were defined as those having a coverage depth of ≥250 reads. The lower limit of detection of this assay is between 5–10%. Sequence alignment and base calling were performed using the Torrent Suite software version 2.01 and variant calling was performed with Torrent Variant Caller software version 1.0 with Human Genome Build 19 as the reference. Routine germ line testing was not performed. Tested codons and genes have been previously described(16).
MSI testing
MSI status was retrospectively reviewed from patient’s charts and was only evaluated in patients who had testing performed as part of their clinical care. This consisted of a mixture of immunohistochemistry for mismatch repair protein deficiency and PCR based assessment of microsatellite status. Tumors were defined as MSI-H if either method of detection was abnormal.
Statistical methods
Differences in mutation rates for each gene and categorical baseline characteristics were compared using the χ2 test, while an ANOVA was used to compare age. In the analysis of mutation prevalence, a χ2 test was performed across all sites (Global P in Supplemental Table 1) and a repeat analysis was performed in only those tumors defined as right or left sided (Right/Left P in Supplemental Table 1) to determine if there was significant variance in mutation rates across sites of the same side. Rectal tumors were considered separately in analyses based on tumor side. By modeling the relative location as semi-continuous, a generalized additive model was used to generate a prevalence estimates by location (Figure 1 & 2). In order to assess whether transverse colon tumors were more similar to right or left sided tumors, we performed K-modes clustering. A K-modes clustering algorithm was applied rather than a K-means or hierarchical clustering as mutational data was categorical. K-modes clustering is specifically designed for categorical data where standard distance matrices may not be applicable (17–19). K-modes clustering used an unweighted algorithm with a maximum of 10-iterations and patients were clustered into 2 clusters. All available mutation data from the 46 genes was utilized. A sensitivity analysis was performed with a subset of 10 genes that were either commonly altered or clinically relevant, however this did not alter the results.
OS was defined as the interval from diagnosis with mCRC to date of death from any cause. Patients alive at the time of last follow-up were censored. Cox regression models were used to compare OS by tumor location and multivariate Cox proportional hazard models were generated for OS using location and any variable that differed by side or site in Table 1, 2, or Supplemental Table 1 entered into the model using a forward likelihood ratio selection with P<0.1 for inclusion of variables. All variables met the proportional hazards assumption except gender, which was used as a stratification factor for the analysis. For survival analysis, the tumor location of rectum was considered the reference as it could remain consistent between analyses based on both side and location, and because it represented the largest group of patients, making it statistically robust. A two-sided P value of <0.05 was considered significant. Analysis was performed with Graph Pad Prism software version 5.0 (La Jolla, California), SPSS version 22.0 (Armonk, New York) and R studio version 3.30 (Boston, MA). K-modes clustering was performed using the klar package(20). Graphical presentation of data also used Tableau version 10.1 (Seattle, Washington) and ggplot2(21).
Results
Baseline Characteristics
Information regarding tumor side was available for the entire cohort, while 51 of 1,876 patients lacked enough information to define the exact location of a primary tumor. Table 1 summarizes baseline characteristics stratified by both tumor side and location. Median age, MSI status, synchronous vs metachronous presentation, and histology all differed by both side and location, while gender was only significantly different when comparing tumors by side. Patients with right sided tumors were older (P<0.0001), more likely to present with synchronous metastatic disease (P<0.0001), and more likely to have mucinous histology (27%) than left sided (15%) or rectal tumors (9%) (P<0.0001). Men made up a larger proportion of patients with left sided (58%) and rectal (61%), than right sided tumors (51%) (P=0.002). Similar directionality and trends for age (P<0.0001), gender ratio (P=0.058), and synchronous vs metachronous disease presentation (P=0.001) were noted based on location. Signet/mucinous histology differed by locations located within the same side of the colon. This histology was highest in the cecum (29%) and gradually fell moving distally, with a second peak in the descending colon (24%), which was notably higher than the prevalence in the splenic flexure (16%) or transverse colon (16%) (P<0.0001). MSI status rose from the cecum (5%) to the ascending colon (10%) and hepatic flexure (12%) before gradually decreasing through the rest of the colon (P<0.0001).
Table 1.
Baseline characteristics of patients with colorectal cancer classified by tumor side and tumor location.
| Stratified by Side | P | Stratified by Tumor Site | P | |||||||||||
|---|---|---|---|---|---|---|---|---|---|---|---|---|---|---|
|
|
|
|||||||||||||
| Right Sided Colon |
Left Sided Colon |
Rectum | Cecum | Ascending Colon |
Hepatic Flexure |
Transverse Colon |
Splenic Flexure |
Descending Colon |
Sigmoid Colon |
Rectosigmoid Junction |
Rectum | |||
| Number | 604 (32) | 850 (45) | 422 (23) | 313 (17) | 124 (7) | 51 (3) | 86 (5) | 36 (2) | 78 (4) | 521 (29) | 194 (11) | 422 (23) | ||
| Median Age (IQR) | 57 (49–65) | 53 (44–61) | 54 (45–62) | <0.0001 | 58 (49–65) | 57 (49–64) | 58 (50–65) | 56 (48–65) | 54 (45–63) | 53 (41–63) | 53 (43–60) | 52 (45–60) | 54 (45–62) | <0.0001 |
| Gender | ||||||||||||||
| Female | 298 (49) | 355 (42) | 165 (39) | 0.002 | 156 (50) | 63 (51) | 23 (45) | 43 (50) | 14 (39) | 29 (37) | 217 (42) | 87 (45) | 165 (39) | 0.058 |
| Male | 306 (51) | 495 (58) | 257 (61) | 157 (50) | 61 (49) | 28 (55) | 43 (50) | 22 (61) | 49 (63) | 304 (58) | 107 (55) | 257 (61) | ||
| MSI Status# | ||||||||||||||
| Stable | 447 (93) | 680 (98) | 340 (98) | <0.0001 | 240 (95) | 88 (90) | 38 (88) | 63 (94) | 26 (93) | 63 (96) | 422 (98) | 156 (99) | 340 (98) | <0.0001 |
| Unstable | 33 (7) | 16 (2) | 8 (2) | 12 (5) | 10 (10) | 5 (12) | 4 (6) | 2 (7) | 3 (5) | 10 (2) | 1 (1) | 8 (2) | ||
| Stage IV Diagnosis | ||||||||||||||
| Synchronous | 416 (69) | 565 (67) | 233 (55) | <0.0001 | 218 (70) | 83 (67) | 37 (73) | 60 (70) | 26 (73) | 48 (62) | 354 (68) | 127 (66) | 233 (55) | 0.0010 |
| Metachronous | 188 (31) | 285 (34) | 189 (45) | 95 (30) | 41 (33) | 14 (27) | 26 (30) | 10 (28) | 30 (39) | 167 (32) | 67 (35) | 189 (45) | ||
| Histology | ||||||||||||||
| Adenocarcinoma | 438 (73) | 724 (85) | 386 (92) | <0.0001 | 219 (70) | 90 (73) | 39 (77) | 72 (84) | 33 (92) | 58 (74) | 446 (86) | 171 (88) | 386 (92) | <0.0001 |
| Signet/Mucinous | 163 (27) | 123 (15) | 36 (9) | 92 (29) | 33 (27) | 12 (24) | 14 (16) | 3 (8) | 19 (24) | 73 (14) | 23 (12) | 36 (9) | ||
| Other | 3 (1) | 0 (0) | 3 (0) | 2 (1) | 1 (1) | 0 (0) | 0 (0) | 0 (0) | 1 (1) | 2 (0) | 0 (0) | 0 (0) | ||
| Median Follow Up Time (Months) | 49.9 | 46.1 | 44.4 | 47.5 | 52.6 | 47.9 | 43.9 | 48.9 | 50.1 | 47.6 | 43.2 | 44.4 | ||
Values in table represent number followed in brackets by %. 51 patients did not have enough details in their operative/pathology reports to assign a tumor site but it was possible to determine the tumors side. IQR = interquartile range.
Unknown MSI status in 352 patients
Molecular Profile
TP53, KRAS, PIK3CA, SMAD4, BRAFV600, PTEN, CTNNB1 and GNAS mutation prevalence all differed by both side and location, while FGFR3 only differed by side (Table 2 and Supplemental Table 1). When a Bonferroni correction was applied, TP53, KRAS, PIK3CA, BRAFV600, PTEN, and GNAS remained significant by side (P<0.002), while TP53, KRAS, PIK3CA, BRAFV600 and CTNNB1 remained significant by location (P<0.002). Prevalence estimates did not vary considerably based on whether the sequenced biopsy was from a primary tumor or metastatic lesion that had spread from the same site (Supplemental Figure 1). Overall, 62% of results were from a primary, while 38% of results came from a biopsy of a metastasis. Liver (51%), lung (17%), and gynecological (7%) were the most common sites for biopsies. Only genes with mutations present in >10 of the 1,876 patients are reported in Tabular format, while Figure 1 presents key genes in colorectal oncology graphed using a generalized additive model to provide point estimates of mutation prevalence with 95% CI. KRAS and NRAS have been graphed together. Rates of TP53 mutations rise moving distally, while PIK3CA, BRAFV600 and SMAD4 mutations fall in prevalence. Exceptions to this include elevated PIK3CA (26%, P=0.0009) and BRAFV600 (9%, P=0.0033) mutation rates in the descending colon compared to other left sided tumor locations and higher CTNNB1 mutation rates at the splenic flexure (6%) and descending colon (6%) compared to other left sided locations (P<0.0001). KRAS mutations fall moving right to left, but then rise again in the rectum, while NRAS mutations appear absent from the area between the hepatic flexure and descending colon, though this was not significant (P=0.24).
Table 2.
Mutation and Consensus Molecular Subtype (CMS) profile of patients with colorectal cancer classified by tumor side.
| All patients | Right Sided Colon | Left Sided Colon | Rectum | P | |
|---|---|---|---|---|---|
| Number | 1876 | 604 (32) | 850 (45) | 422 (23) | |
| TP53 | 1213 (65) | 341 (57) | 581 (68) | 291 (69) | <0.0001 |
| KRAS | 909 (48) | 351 (58) | 343 (40) | 215 (51) | <0.0001 |
| APC | 847 (45) | 267 (44) | 394 (46) | 186 (44) | 0.63 |
| PIK3CA | 287 (15) | 122 (20) | 121 (14) | 44 (10) | <0.0001 |
| SMAD4 | 233 (12) | 98 (16) | 87 (10) | 48 (11) | 0.0020 |
| BRAF V600 | 115 (6) | 76 (13) | 34 (4) | 5 (1) | <0.0001 |
| FBXW7 | 142 (8) | 43 (7) | 58 (7) | 41 (10) | 0.16 |
| NRAS | 79 (4) | 25 (4) | 34 (4) | 20 (5) | 0.82 |
| PTEN | 46 (2) | 29 (5) | 13 (2) | 4 (1) | <0.0001 |
| ATM | 41 (2) | 16 (3) | 17 (2) | 8 (2) | 0.64 |
| CTNNB1 | 30 (2) | 18 (3) | 10 (1) | 2 (1) | 0.003 |
| GNAS | 30 (2) | 20 (3) | 8 (1) | 2 (1) | <0.0001 |
| ERBB4 | 22 (1) | 5 (1) | 10 (1) | 7 (2) | 0.48 |
| ERBB2 | 20 (1) | 5 (1) | 8 (1) | 7 (2) | 0.40 |
| KDR | 19 (1) | 5 (1) | 9 (1) | 5 (1) | 0.84 |
| RB1 | 16 (1) | 7 (1) | 6 (1) | 3 (1) | 0.61 |
| RET | 16 (1) | 5 (1) | 8 (1) | 3 (1) | 0.91 |
| SMO | 16 (1) | 6 (1) | 6 (1) | 4 (1) | 0.82 |
| SMARCB1 | 15 (1) | 6 (1) | 6 (1) | 3 (1) | 0.81 |
| AKT1 | 14 (1) | 8 (1) | 3 (1) | 3 (1) | 0.11 |
| STK11 | 14 (1) | 4 (1) | 5 (1) | 5 (1) | 0.49 |
| KIT | 13 (1) | 4 (1) | 7 (1) | 2 (1) | 0.77 |
| CDKN2A | 12 (1) | 4 (1) | 4 (1) | 4 (1) | 0.60 |
| MET | 12 (1) | 5 (1) | 5 (1) | 2 (1) | 0.76 |
| FGFR3 | 11 (1) | 4 (1) | 1 (0) | 6 (1) | 0.016 |
| Consensus Molecular Subtype Cohort (n=608) | |||||
| Number | 608 | 268 | 236 | 104 | <0.0001 |
| CMS I | 104 (17) | 96 (36) | 6 (3) | 4 (4) | |
| CMS II | 281 (46) | 77 (29) | 145 (61) | 58 (56) | |
| CMS III | 78 (13) | 44 (16) | 20 (8) | 14 (13) | |
| CMS IV | 144 (24) | 51 (19) | 65 (28) | 28 (27) | |
| CpG Island Methylator Phenotype (CIMP) Cohort (n=457) | |||||
| Number | 457 | 169 | 202 | 86 | 0.028 |
| CIMP-H | 104 (23) | 49 (29) | 35 (17) | 20 (23) | |
Only genes with a mutation in >10 patients in the cohort of 1876 are displayed.
Figure 1.

Relative prevalence of key oncogenic alterations at specific primary tumor locations in patients with metastatic colorectal cancer.
As seen in Figure 1, mutation prevalence varies dramatically within tumors of the same side but at different locations. Notable examples include a) RAS mutations are seen in 70% of cecal tumors but only 57% of ascending colon and 43% of hepatic flexure tumors (P=0.0008), b) BRAFV600 mutations occur in 10% of cecal, 16% of ascending colon, and 22% of hepatic flexure tumors (P<0.0001), c) PIK3CA mutations are seen in 26% of descending colon but only 14% of sigmoid and 9% of rectosigmoid tumors (P=0.0009), and d) CTNNB1 mutations are almost absent in the sigmoid (1%), rectosigmoid junction (0%), and rectum (1%), but are still present in the descending colon (6%) (P<0.0001).
Relative prevalence of mutation clusters identified using K-modes clustering differed significantly based on tumor location (P<0.0001). When the mutation clusters of cecum, ascending colon, hepatic flexure, and transverse colon were compared to each other, strong trends towards differing cluster prevalence (P=0.056) among these right sided locations. When mutation clusters of splenic flexure, descending colon, sigmoid colon, rectosigmoid colon, and rectum were compared, they did not differ (P=0.26). Given the noted differences among right sided locations, we directly compared transverse colon tumors to left and right sided tumors (excluding transverse) to see if it appeared more right or left sided. Transverse colon tumors differed from right sided (P=0.027) but not left sided (P=0.87) locations (Figure 2) in K-modes clustering.
Figure 2.

K-mode clustering of mutational profiles of metastatic colorectal cancers classified by tumor location to help establish an optimal right vs left cut point. Each cluster represents a distinct group of mutations that either commonly co-occur or are mutually exclusive and are used for grouping similar patients together.
To ensure that k-modes clustering results were robust for methodology, we analyzed the samples with different approaches. Because many of the mutations will not be present in most patients, we chose the 10 most common or clinically relevant mutations and repeated the analysis to help address the question of whether co-occurring or mutually exclusive alterations may be affecting our results. Genes included: TP53, APC, FBXW7, SMAD4, PIK3CA, ATM, PTEN, KRAS, NRAS, and BRAF. Clustering was identical to the main analysis. Subsequently, we also repeated the clustering with a “leave one out” strategy where we repeated the clustering with 9 of the 10 most common alterations, each time leaving out one of the alterations. If APC (P=0.032), PTEN (P=0.027), TP53 (P=0.068), PIK3CA (P=0.067), or KRAS (P=0.15) were left out of clustering, a similar difference between cluster prevalence was noted between right and transverse colon tumors, but not left sided lesions. All other potential combinations did not reveal statistically different mutation clusters between transverse tumors and either right or left sided tumors.
CpG Island Methylator Status
CIMP data was available for a separate cohort of 457 mCRC patients and demonstrated significantly higher rates of CIMP-H phenotype among right sided tumors (29%) than left sided (17%) or rectal (23%) tumors (P=0.028). There were no statistically significant differences among tumor locations that are traditionally grouped on the same side (Table 2 and Supplemental Table 1).
CMS Distribution
We noted increasing rates of CMS2 moving from right to left, accompanied by a fall in CMS1, while CMS3 and CMS4 were relatively stable when we compared CMS by tumor side (Table 2). When comparing CMS subtype by location (Figure 3 and Supplemental Table 1), CMS1 rises from the cecum (29%) to the ascending colon (41%) and hepatic flexure (52%) before falling throughout the rest of the colon. CMS2 shows a general increase moving distally from the cecum (28%), with a peak in the sigmoid (65%) and rectosigmoid regions (65%). CMS3 shows a gradual decrease moving distally, while CMS4 stays relatively stable outside of an increased prevalence in the descending colon (43%). The relative proportion of individual subtypes was significantly different based on both side (P<0.0001) and location (P<0.0001) (Table 2 and Supplemental Table 1).
Figure 3.
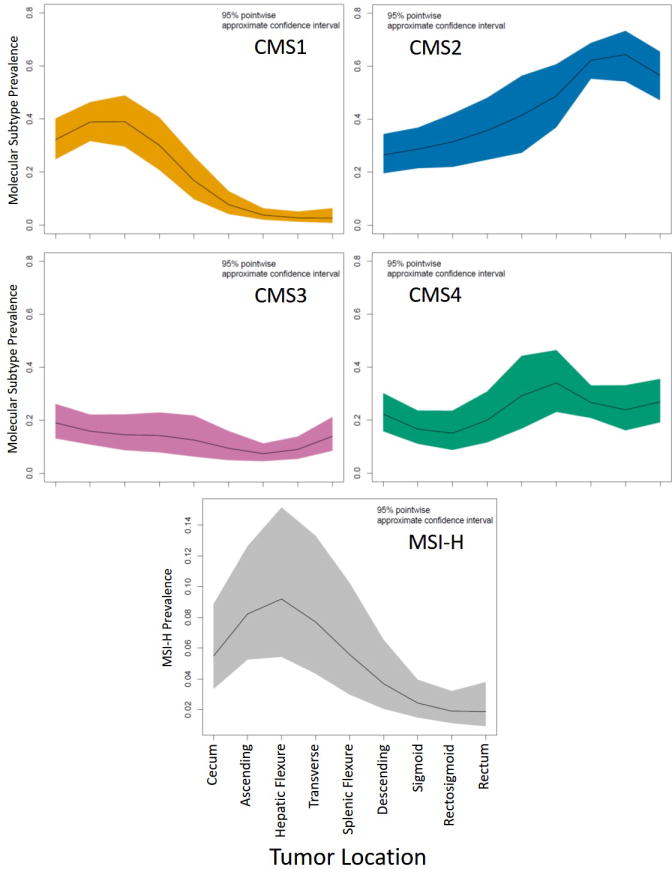
Relative prevalence of Consensus Molecular Subtypes at specific primary tumor locations.
Sub-caption: MSI-H= microsatellite instability high.
Survival Analysis
With a median follow up time of 46.5 months, we noted that right sided tumors are associated with a worse OS (HR 1.63, 95% CI 1.38–1.89, P<0.0001) than left sided (HR 0.98, 95% CI 0.84–1.16, P=0.84) or rectal tumors (reference). Figure 4 –A demonstrates the relative impact of tumor location on the hazard ratio for OS compared to rectal tumors as the reference group. With increased granularity in localization, cecal (HR 1.69, 95% CI 1.40–2.04, P<0.0001), ascending colon (HR 1.72, 95% CI 1.34–2.21, P<0.0001), hepatic flexure (HR 1.98, 95% CI 1.38–2.85, P<0.0001), and transverse colon (HR 1.38, 95% CI 1.02–1.88, P=0.038) tumors all appeared associated with a worse prognosis than left sided or rectal tumors. We performed a sensitivity analysis to assess whether different geographic cut-points between right and left sided tumors could be found that maximized the HR between sides (Supplemental Figure 2) and noted that the maximum difference in HR for OS could be generated by including all locations beyond the hepatic flexure together as a “left-sided” group compared to all locations from the cecum up to and including the hepatic flexure, as a “right-sided” group.
Figure 4.

Comparison of overall survival based on primary tumor location in (A) a univariate model assessing only tumor location and (B) a multivariate proportional hazards model controlling for co-variates that differed based on tumor location.
Sub-caption: Variables within the cartoon represent the hazard ratio for individual locations followed by the 95% confidence interval within square brackets.
In order to assess whether the clinicopathologic or mutation differences we noted in our study explained all of the differential prognosis based on location, we constructed multivariate models controlling for all co-variates that differed based on either side or site in Tables 1–2 and Supplemental Table 1. Even after controlling for known negative prognostic markers that differed by location, right sided tumors had a worse OS (HR 1.35, 95% CI 1.11–1.64, P=0.002) (Supplemental Figure 3). In the model based on tumor location, the cecum (HR 1.33, 95% CI 1.06–1.67, P=0.012), ascending colon (HR 1.39, 95% CI 1.03–1.87, P=0.029), and the hepatic flexure (HR 1.70, 95% CI 1.13–2.57, P=0.011) remained significantly associated with a worse OS, however the transverse colon was no longer associated with a worse OS (P=0.18) (Figure 4 -B). When comparing transverse colon tumors to all other right sided tumors, there was no difference in mOS in univariate (HR 0.82, 95% CI 0.61–1.10, P=0.19) or multivariate (HR 0.80, 95% CI 0.60–1.08, P=0.15) models. Full model details are included in Supplementary Table 3.
Given differences in transverse colon molecular profiling that suggested the transverse location differed from other right sided locations, we assessed response to anti-EGFR therapy in RAS/BRAF V600 wild type transverse colon tumors. Of 17 patients treated previously with anti-EGFR therapy in the second or later line of treatment and assessable for response, 6 (35%, 95% CI 14%-62%) had an object response using RECIST 1.1 criteria(22). Progression free survival was 5.9 months, and the disease control rate was 82%. Four patients received anti EGFR therapy in the second line, 11 in the third line, and 2 in the fourth line. All patients received anti-EGFR with a cytotoxic and 10 of them received anti-EGFR treatment with a doublet.
Discussion
We present the molecular characterization of 1,876 patients with mCRC classified by both tumor side and location. Our results highlight many previously documented differences between right/left sided tumors. These include higher rates of BRAF, PIK3CA, CTNNB1, SMAD4 and KRAS mutations, higher rates of mucinous histology, higher rates of CIMP, and increased incidence of MSI among right sided tumors, with higher rates of TP53 mutations among left sided tumors (23–28). Our study extends these findings to demonstrate the presence of significant differences in mutation prevalence based on tumor location that would not be noted in the classical stratification of right, left, and rectal locations. Specific alterations of note include an extremely high rate of RAS mutations in cecal primaries (70%), a rise in BRAFV600 mutations from the cecum (10%) to the hepatic flexure (22%), and inversely related rates of TP53 and APC mutations as one moves from right to left.
Beyond suggesting that tumor location may provide more information about the biology of colorectal cancer, our results raise an important question about whether current divisions between right and left sided locations are optimal. The majority of recent studies assessing the impact of sidedness on response to anti-EGFR agents have divided the colon at the splenic flexure, with the exception of 80405 which excluded transverse tumors from their analysis(7,10,12,13). We noted that transverse colon tumors had mutational profiles that were dissimilar from right sided (P<0.0001) but not left sided (P=0.87) tumors. Additionally, Supplemental Figure 2 demonstrates that by dividing the colon into left/right before the transverse colon we maximize the HR for our survival analysis between left/right, though there is considerable overlap of the HR confidence intervals for all locations except the rectal-sigmoid region. As well, the poor prognosis of transverse tumors noted in our univariate model, were accounted for by known co-variates in a multivariate model but the remaining right sided sites continued to be associated with a poor prognosis in the same model. We also assessed response rates to anti-EGFR therapy in patients with transverse tumors to see if they benefitted from these agents. As all patients in our study received their anti-EGFR agent in a 2nd or later line of therapy, the 181 trial of second line FOLFIRI + panitumumab is the most reasonable trial for comparisons(7). In 181, treatment with FOLFIRI + panitumumab resulted in a progression free survival of 8.0 months and a response rate of 49.7%. For right sided tumors this was 4.8 months and 13.3%. Given the progression free survival of 6.0 months and response rate of 39% among our heavily pre-treated population, this would suggest that transverse tumors may still benefit from anti-EGFR agents. Taken together, these findings suggest that transverse tumors may be different from other traditionally right sided locations.
Among left sided sites, we also noted important characteristics that differed by location. For example, many descending colon features appear more “right sided.” There was a higher proportion of mucinous histology in the descending colon (24%) compared to the sigmoid (14%), rectosigmoid junction (12%), or rectum (9%) (P=0.0005) and rates of PIK3CA (P=0.0009) and CTNNB1 (P<0.0001) mutations were significantly higher than other left sided locations. Mutation patterns noted in our study align well with a recent report by Marshall et al. demonstrating significant differences between descending/splenic flexure tumors and those situated in the sigmoid or rectum(29). While not statistically associated with a worse OS than other left sided tumors, there was also a trend towards worse outcomes (HR 1.30, 95% CI 0.93–1.80, P=0.12) in the descending colon and Supplemental Figure 2 shows that there is considerable overlap in the HR estimates for all left/right divisions except when the rectosigmoid and rectal regions are considered separately. This suggests much of the differential survival effect for a right vs left comparison is driven by the rectosimoid region. Our findings raise an interesting question as to whether the rectosigmoid region may be unique from the rest of the colon.
Despite highlighting mutational differences across similar sided locations, there are key oncogenic pathways that appear tumor side specific. The serrated pathway of colorectal carcinogenesis is characterized by mutations in RAS/BRAF, hypermethylation, frequently co-occurs with microsatellite instability and has a predilection for the right side (30). Though we noted rates of RAS mutations fall sharply from the cecum (70%) towards the ascending colon (57%) and hepatic flexure (43%), the total prevalence of a mutation in the MAP kinase pathway stays relatively stable due to a rising prevalence of BRAF mutations. By combining BRAF and RAS mutations, MAP kinase mutations are noted in 76% of cecal tumors, 82% of ascending colon, and much lower rates in the rest of the colon. Similarly, the PIK3CA-mTOR-AKT pathway has alterations that appear specific to the right side(4,26,27,30,31). The combination of PIK3CA and PTEN mutations is consistently present in 25–30% of all sites before falling to 16% in the sigmoid colon, 10% at the rectosigmoid junction, and 11% in the rectum. Though PIK3CA and PTEN mutation frequencies change across sites, there cumulative prevalence evens out so that combined pathway alterations are stable among tumor sites on the same side of the colon. These findings suggest that pathway alterations may be better conserved across similar sided locations than the individual alteration perturbing the pathway.
This biology of common canonical pathways is well characterized by the CMS subtypes which are based on gene expression analysis. The relative prevalence of each CMS subtype was similar in our study to the landmark paper that established its utility in CRC(4). In addition, the mutational profiles we noted in Figure 1 appear consistent with hallmarks of the CMS subtypes. Specifically, we noted that the immune driven CMS1 is most common in right sided tumors and falls moving distally with an accompanying fall in MSI status and BRAF mutation rates. Similarly, we saw that the canonical CMS2 category rose moving from right to left, a trend that was accompanied by rising rates of TP53 mutations. While our CMS subtype cohort is not matched to the main cohort of this study, it is useful to note that the pathways we noted as important from mutational analysis appear consistent with changing CMS prevalence by location. A further limitation of our CMS based results was that we were forced to pool metastatic and early stage CRC patients for the CMS analysis due to a small number of stage IV patients with transcriptional profiling, however others have shown that the proportion of each subtype is relatively stable between stages(4).
Our study has a number of other limitations that must be taken into account when interpreting results. The limited coverage of genes within our NGS assay did not allow assessment of copy number changes which are important determinants of disease biology. As well, we relied on source document reports in order to assign tumor location. Given that these reports relied on endoscopic, pathologic, imaging, and clinical assessment of tumor location, we assume that they represent an accurate representation of location but there may be some cases where a tumor was on the boundary between two sites. However, given that the majority of our findings show a continuum of changes across the bowel, small discrepancies in location likely caused little impact on the overall conclusions. We also were unable to incorporate treatment information for the entire cohort which may have helped explain prognostic differences between locations.
Despite these weaknesses, our cohort had near complete description of tumor location and presents one of the largest data sets analyzed for mutation differences by location. The size of this cohort is essential to ask what differentiates individual sites and provided significant power when looking at uncommon primary tumor locations such as the splenic or hepatic flexures. As well, the large size of our study enabled us to move beyond standard biomarkers like RAS and BRAF that have been well characterized and assess biomarkers representing “smaller pieces of the pie” which are becoming ever more important as we move into an era of precision medicine guided by molecular aberrations rather than histology alone.
Conclusion
In conclusion, we noted important differences in mutation prevalence between tumors located on the same side of the colon. Alterations in key pathways such as MAP kinase and PIK3CA-mTOR-AKT appeared stable across locations within the same side but important intra-side variances were noted. Specifically, the region from the sigmoid colon to the rectum appears unique and the transverse colon appears distinct from other right sided locations.
Supplementary Material
Supplemental Figure 1. Sensitivity analysis comparing mutation prevalence estimates by site of biopsy of tissue used for next generation sequencing panel in metastatic colorectal cancer.
Supplemental Figure 2. Sensitivity analysis demonstrating optimal left vs right cut-point to maximize prognostic differences based on side in metastatic colorectal cancer.
Numbers in figure represent the hazard ratio followed by the 95% confidence interval within square brackets. The hazard ratio estimate occurs at the location used to divide left from right in each sensitivity analysis. For example, if the division between right and left occurs between the hepatic flexure and transverse colon, the hazard ratio estimate will be placed on the graph half way between the hepatic flexure and transverse colon (ie. 1.66).
Supplemental Figure 3. Comparison of overall survival based on primary tumor side using a multivariate proportional hazards model controlling for co-variates that differed based on tumor location.
Supplemental Figure 4. Summary of the relative prognostic and mutational impact of tumor location in metastatic colorectal cancer.
Relative prevalence of mutations at each site was compared to the median prevalence across all sites and used to calculate relative font size for each gene name. Hazard ratios displayed in the figure utilize rectal location as the reference category.
Supplemental Tables. Mutation and Consensus Molecular Subtype (CMS) profile of patients with colorectal cancer classified by tumor site.
Translational Relevance.
Primary tumor sidedness is prognostic in metastatic colorectal cancer, with right sided tumors having a worse prognosis than left sided tumors even after controlling for known negative prognostic factors such as BRAF mutations that differ between right and left sided tumors. Recent analysis suggests that sidedness may also be a predictive marker for response to anti-EGFR therapy. In RAS wild type patients, left sided tumors appear to derive benefit from anti-EGFR therapy, while right sided tumors do not. The molecular underpinnings of this differential response are currently unclear. Here we present the mutational and molecular subtype profiles divided by the previously established left vs right division as well as by unique colonic location. We demonstrate that these profiles vary dramatically throughout the colon and that a simple left vs right divide may be oversimplifying the geographically distinct biology present in colorectal cancer.
Acknowledgments
JL is a member of the UBC Clinician Investigator program and was the recipient of the CAMO 2016 Research Fellowship, the CCF of ASCO - J. Edward Mahoney Foundation Young Investigator Award, and the RCPSC Detweiler Fellowship. SK is the recipient of NIH R01 grants that supported this research (CA 172670 & CA 187238). This research was performed in partial fulfillment of requirements for an M.S. degree from MD Anderson UTHealth GSBS. We thank Jeanne Manalo for her assistance with graphical design.
Footnotes
Disclosures: All authors report no conflicts of interest to declare.
References
- 1.Holch JW, Ricard I, Stintzing S, Modest DP, Heinemann V. The relevance of primary tumour location in patients with metastatic colorectal cancer: A meta-analysis of first-line clinical trials. Eur J Cancer [Internet] 2017;70:87–98. doi: 10.1016/j.ejca.2016.10.007. Available from: http://dx.doi.org/10.1016/j.ejca.2016.10.007. [DOI] [PubMed] [Google Scholar]
- 2.Loupakis F, Yang D, Yau L, Feng S, Cremolini C, Zhang W, et al. Primary tumor location as a prognostic factor in metastatic colorectal cancer. J Natl Cancer Inst. 2015;107:dju427. doi: 10.1093/jnci/dju427. [DOI] [PMC free article] [PubMed] [Google Scholar]
- 3.Tran B, Kopetz S, Tie J, Gibbs P, Jiang ZQ, Lieu CH, et al. Impact of BRAF mutation and microsatellite instability on the pattern of metastatic spread and prognosis in metastatic colorectal cancer. Cancer [Internet] 2011;117:4623–32. doi: 10.1002/cncr.26086. Available from: http://doi.wiley.com/10.1002/cncr.26086. [DOI] [PMC free article] [PubMed] [Google Scholar]
- 4.Guinney J, Dienstmann R, Wang X, de Reyniès A, Schlicker A, Soneson C, et al. The consensus molecular subtypes of colorectal cancer. Nat Med [Internet] 2015;21:1350–6. doi: 10.1038/nm.3967. Available from: http://www.nature.com/doifinder/10.1038/nm.3967. [DOI] [PMC free article] [PubMed] [Google Scholar]
- 5.Cha Y, Kim K-J, Han S-W, Rhee YY, Bae JM, Wen X, et al. Adverse prognostic impact of the CpG island methylator phenotype in metastatic colorectal cancer. Br J Cancer [Internet] 2016;115:164–71. doi: 10.1038/bjc.2016.176. Available from: http://dx.doi.org/10.1038/bjc.2016.176. [DOI] [PMC free article] [PubMed] [Google Scholar]
- 6.Venderbosch S, Nagtegaal ID, Maughan TS, Smith CG, Cheadle JP, Fisher D, et al. Mismatch repair status and BRAF mutation status in metastatic colorectal cancer patients: A pooled analysis of the CAIRO, CAIRO2, COIN, and FOCUS studies. Clin Cancer Res. 2014;20:5322–30. doi: 10.1158/1078-0432.CCR-14-0332. [DOI] [PMC free article] [PubMed] [Google Scholar]
- 7.Arnold D, Lueza B, Douillard JY, Peeters M, Lenz HJ, Venook A, et al. Prognostic and predictive value of primary tumour side in patients with RAS wild-type metastatic colorectal cancer treated with chemotherapy and EGFR directed antibodies in six randomised trials. Ann of Oncol[Internet] 2017;28(8):1713–1729. doi: 10.1093/annonc/mdx175. Available from: https://academic.oup.com/annonc/article-lookup/doi/10.1093/annonc/mdx175. [DOI] [PMC free article] [PubMed] [Google Scholar]
- 8.Loree JM, Kopetz S. Ther Adv Med Oncol [Internet] 8. Vol. 9. SAGE PublicationsSage UK; London, England: 2017. Recent developments in the treatment of metastatic colorectal cancer; pp. 551–564. E-pub ahead of print. Available from: http://journals.sagepub.com/doi/10.1177/1758834017714997. [DOI] [PMC free article] [PubMed] [Google Scholar]
- 9.Van Cutsem E, Cervantes A, Adam R, Sobrero A, Van Krieken JH, Aderka D, et al. ESMO consensus guidelines for the management of patients with metastatic colorectal cancer. Ann Oncol [Internet] 2016;27(8):1386–422. doi: 10.1093/annonc/mdw235. Available from: http://annonc.oxfordjournals.org/lookup/doi/10.1093/annonc/mdw235. [DOI] [PubMed] [Google Scholar]
- 10.Boeckx N, Koukakis R, Beeck K, Kafatos G, Deschoolmeester V, Rolfo C, et al. Primary tumor sidedness impacts on prognosis and treatment outcome: results from three randomized studies of panitumumab plus chemotherapy versus chemotherapy or chemotherapy plus bevacizumab in 1st and 2nd line RAS/BRAF WT mCRC. Ann Oncol. 2016;27(6):15–42.89P. [Google Scholar]
- 11.Venook A, Niedzwiecki D, Ou F, Sargent D, Innocenti F, Fruth B, et al. Impact of primary tumor location on Overall Survival and Progression Free Survival in patients with metastatic colorectal cancer: Analysis of all RAS wt subgroup on CALGB/SWOG 80405 (Alliance) JCO. 2016;34(Supplemental) Abstract 3504. [Google Scholar]
- 12.Brule SY, Jonker DJ, Karapetis CS, O’Callaghan CJ, Moore MJ, Wong R, et al. Location of colon cancer (right-sided versus left-sided) as a prognostic factor and a predictor of benefit from cetuximab in NCIC CO.17. Eur J Cancer. 2015;51:1405–14. doi: 10.1016/j.ejca.2015.03.015. [DOI] [PubMed] [Google Scholar]
- 13.Tejpar S, Stintzing S, Ciardiello F, Tabernero J, Van Cutsem E, Beier F, et al. Prognostic and Predictive Relevance of Primary Tumor Location in Patients With RAS Wild-Type Metastatic Colorectal Cancer Retrospective Analyses of the CRYSTAL and FIRE-3 Trials. JAMA Oncol. 2016 doi: 10.1001/jamaoncol.2016.3797. E-pub ahead of print. [DOI] [PMC free article] [PubMed] [Google Scholar]
- 14.Cancer Genome Atlas Network. Comprehensive molecular characterization of human colon and rectal cancer. Nature [Internet] 2012;487:330–7. doi: 10.1038/nature11252. Available from: http://www.ncbi.nlm.nih.gov/pubmed/22810696. [DOI] [PMC free article] [PubMed] [Google Scholar]
- 15.Sepulveda AR, Hamilton SR, Allegra CJ, Grody W, Cushman-Vokoun AM, Funkhouser WK, et al. Molecular Biomarkers for the Evaluation of Colorectal Cancer: Guideline From the American Society for Clinical Pathology, College of American Pathologists, Association for Molecular Pathology, and the American Society of Clinical Oncology. J Clin Oncol. 2017;35:1453–96. doi: 10.1200/JCO.2016.71.9807. [DOI] [PubMed] [Google Scholar]
- 16.Meric-Bernstam F, Brusco L, Shaw K, Horombe C, Kopetz S, Davies Ma, et al. Feasibility of Large-Scale Genomic Testing to Facilitate Enrollment Onto Genomically Matched Clinical Trials. J Clin Oncol [Internet] 2015;33(25):2753–2762. doi: 10.1200/JCO.2014.60.4165. Available from: http://jco.ascopubs.org/cgi/doi/10.1200/JCO.2014.60.4165. [DOI] [PMC free article] [PubMed] [Google Scholar]
- 17.Chaturvedi A, Green PE, Caroll JD. J Classif [Internet] Vol. 18. Springer-Verlag; 2001. K-modes Clustering; pp. 35–55. Available from: http://link.springer.com/10.1007/s00357-001-0004-3. [Google Scholar]
- 18.Huang Z. Extensions to the k-Means Algorithm for Clustering Large Data Sets with Categorical Values. Data Min Knowl Discov [Internet] 1998;2:283–304. Available from: http://link.springer.com/10.1023/A:1009769707641. [Google Scholar]
- 19.San OM, Huynh V-N, Nakamori Y. AN ALTERNATIVE EXTENSION OF THE k-MEANS ALGORITHM FOR CLUSTERING CATEGORICAL DATA. Int J Appl Math Comput Sci [Internet] 2004;14:241–7. Available from: http://zbc.uz.zgora.pl/Content/2572/12san.pdf. [Google Scholar]
- 20.Roever C, Raabe N, Luebke K, Ligges U, Szepannek G, Zentgraf M. klaR: Classification and visualization [Internet] 2014 Available from: https://cran.r-project.org/web/packages/klaR/index.html.
- 21.Wickham H. Elegant Graphics for Data Analysis - ggplot2. New York: Springer-Verlag; 2009. [Internet] Available from: https://cran.r-project.org/web/packages/ggplot2/citation.html. [Google Scholar]
- 22.Eisenhauer Ea, Therasse P, Bogaerts J, Schwartz LH, Sargent D, Ford R, et al. New response evaluation criteria in solid tumours: revised RECIST guideline (version 1.1) Eur J Cancer [Internet] 2009;45:228–47. doi: 10.1016/j.ejca.2008.10.026. Available from: http://www.ncbi.nlm.nih.gov/pubmed/19097774. [DOI] [PubMed] [Google Scholar]
- 23.Zhang J, Zheng J, Yang Y, Lu J, Gao J, Lu T, et al. Molecular spectrum of KRAS, NRAS, BRAF and PIK3CA mutations in Chinese colorectal cancer patients: analysis of 1,110 cases. Sci Rep [Internet] 2015;5:18678. doi: 10.1038/srep18678. [DOI] [PMC free article] [PubMed] [Google Scholar]
- 24.Yamauchi M, Morikawa T, Kuchiba A, Imamura Y, Qian ZR, Nishihara R, et al. Assessment of colorectal cancer molecular features along bowel subsites challenges the conception of distinct dichotomy of proximal versus distal colorectum. Gut [Internet] 2012;61:847–54. doi: 10.1136/gutjnl-2011-300865. Available from: http://www.ncbi.nlm.nih.gov/pubmed/22427238. [DOI] [PMC free article] [PubMed] [Google Scholar]
- 25.Takahashi Y, Sugai T, Habano W, Ishida K, Eizuka M, Otsuka K, et al. Molecular differences in the microsatellite stable phenotype between left-sided and right-sided colorectal cancer. Int J Cancer [Internet] 2016;139:2493–501. doi: 10.1002/ijc.30377. Available from: http://www.ncbi.nlm.nih.gov/pubmed/27509333. [DOI] [PMC free article] [PubMed] [Google Scholar]
- 26.Albuquerque C, Baltazar C, Filipe B, Penha F, Pereira T, Smits R, et al. Colorectal cancers show distinct mutation spectra in members of the canonical WNT signaling pathway according to their anatomical location and type of genetic instability. Genes, Chromosom Cancer [Internet] 2010;49:746–59. doi: 10.1002/gcc.20786. Available from: http://www.ncbi.nlm.nih.gov/pubmed/20544848. [DOI] [PubMed] [Google Scholar]
- 27.Rosty C, Young JP, Walsh MD, Clendenning M, Sanderson K, Walters RJ, et al. PIK3CA Activating Mutation in Colorectal Carcinoma: Associations with Molecular Features and Survival. Ashktorab H, editor. PLoS One [Internet] 2013;8:e65479. doi: 10.1371/journal.pone.0065479. Available from: http://www.ncbi.nlm.nih.gov/pubmed/23785428. [DOI] [PMC free article] [PubMed]
- 28.Sarshekeh AM, Advani S, Overman MJ, Manyam G, Kee BK, Fogelman DR, et al. Association of SMAD4 mutation with patient demographics, tumor characteristics, and clinical outcomes in colorectal cancer. PLoS One [Internet] 2017;12:e0173345. doi: 10.1371/journal.pone.0173345. Available from: http://www.ncbi.nlm.nih.gov/pubmed/28267766. [DOI] [PMC free article] [PubMed] [Google Scholar]
- 29.Marshall J, Lenz H, Xiu J, Wafik E, Swensen J, El Ghazaly H, et al. Molecular variances between rectal and left-sided colon cancers. J Clin Oncol [Internet] 2017;35(suppl 4S) abstract 522. Available from: http://meetinglibrary.asco.org/content/176344-195. [Google Scholar]
- 30.Bettington M, Walker N, Clouston A, Brown I, Leggett B, Whitehall V. The serrated pathway to colorectal carcinoma: current concepts and challenges. Histopathology [Internet] 2013;62:367–86. doi: 10.1111/his.12055. Available from: http://doi.wiley.com/10.1111/his.12055. [DOI] [PubMed] [Google Scholar]
- 31.Lan Y-T, Jen-Kou L, Lin C-H, Yang S-H, Lin C-C, Wang H-S, et al. Mutations in the RAS and PI3K pathways are associated with metastatic location in colorectal cancers. J Surg Oncol [Internet] 2015;111:905–10. doi: 10.1002/jso.23895. Available from: http://doi.wiley.com/10.1002/jso.23895. [DOI] [PubMed] [Google Scholar]
Associated Data
This section collects any data citations, data availability statements, or supplementary materials included in this article.
Supplementary Materials
Supplemental Figure 1. Sensitivity analysis comparing mutation prevalence estimates by site of biopsy of tissue used for next generation sequencing panel in metastatic colorectal cancer.
Supplemental Figure 2. Sensitivity analysis demonstrating optimal left vs right cut-point to maximize prognostic differences based on side in metastatic colorectal cancer.
Numbers in figure represent the hazard ratio followed by the 95% confidence interval within square brackets. The hazard ratio estimate occurs at the location used to divide left from right in each sensitivity analysis. For example, if the division between right and left occurs between the hepatic flexure and transverse colon, the hazard ratio estimate will be placed on the graph half way between the hepatic flexure and transverse colon (ie. 1.66).
Supplemental Figure 3. Comparison of overall survival based on primary tumor side using a multivariate proportional hazards model controlling for co-variates that differed based on tumor location.
Supplemental Figure 4. Summary of the relative prognostic and mutational impact of tumor location in metastatic colorectal cancer.
Relative prevalence of mutations at each site was compared to the median prevalence across all sites and used to calculate relative font size for each gene name. Hazard ratios displayed in the figure utilize rectal location as the reference category.
Supplemental Tables. Mutation and Consensus Molecular Subtype (CMS) profile of patients with colorectal cancer classified by tumor site.