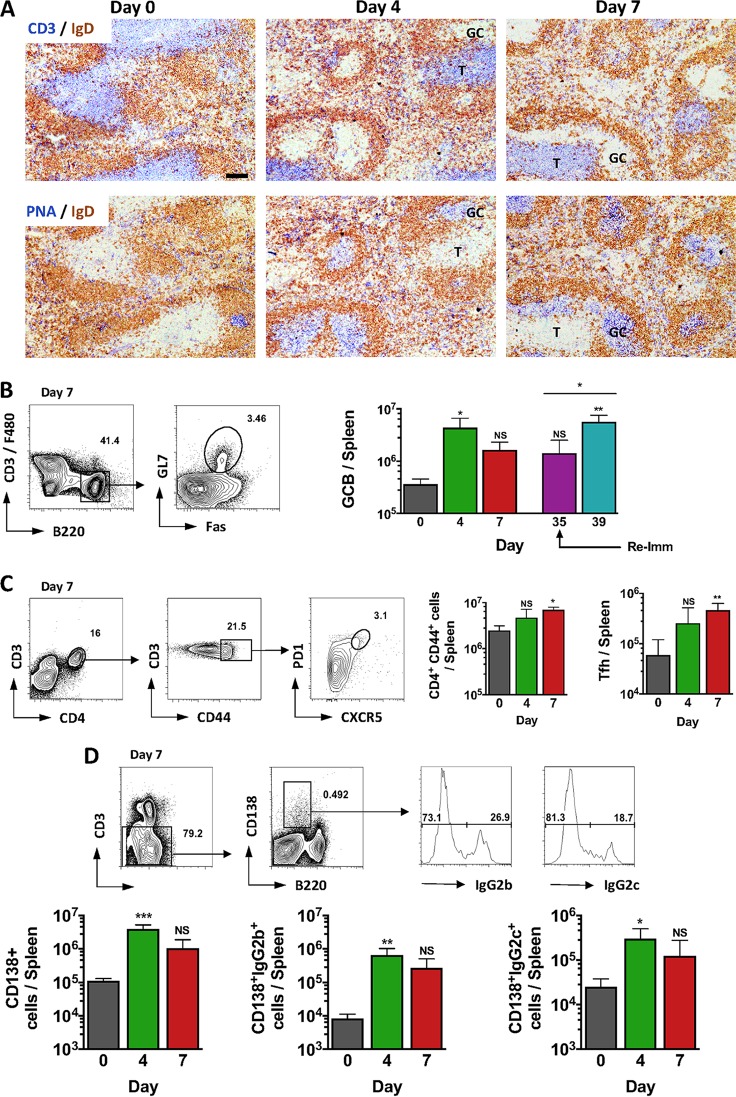
FIG 2 .
STmGMMA induce rapid and extensive B- and T-cell responses after immunization. Mice were immunized i.p. with 1 μg of STmGMMA for the times indicated in days following primary immunization. (A) Representative photomicrographs of spleen sections from nonimmunized mice and mice immunized with STmGMMA stained for IgD (brown) and CD3 (blue; top row) or PNA (blue; bottom row) for nonimmunized WT mice (left) and mice immunized for 4 (middle) or 7 (right) days. Scale bar, 100 μm. (B to D) Representative FACS plots demonstrating gating and enumeration of cells (all from mice immunized for 7 days) from spleens stained for GC B (GCB) cells (CD3− F4/80-B220+ is Fas and GL7 positive) (day 39 indicates mice boosted at day 35) (B), splenic activated T cells (CD3+ CD44+ CD4+) (left graph) and Tfh cells (CD3+ CD44+ CD4+ is CXCR5+ PD1+) (right graph) from a mouse immunized for 7 days (C), and plasma cells (CD3− B220lo CD138+) (left graph), including plasma cells stained positive for intracellular IgG2b (middle graph) or IgG2c (right graph) (D). Graphs show the mean value and standard deviation of four mice per group, and the results are representative of two independent experiments. T, T zone; Re-imm, reimmunization. Statistical analysis was performed with the Kruskal-Wallis test and Dunn’s multiple-comparison test, with time zero as the reference time point. The Mann-Whitney U test was used to compare the day 35 and 39 time points in panel B. NS, nonsignificant; *, P ≤ 0.05; **, P ≤ 0.01; ***, P ≤ 0.001.

