Abstract
Mismatched nucleotides arise from polymerase misincorporation errors, recombination between heteroallelic parents and chemical or physical DNA damage1. Highly conserved MutS (MSH) and MutL (MLH/PMS) homologues initiate mismatch repair and, in higher eukaryotes, act as DNA damage sensors that can trigger apoptosis2. Defects in human mismatch repair genes cause Lynch syndrome or hereditary non-polyposis colorectal cancer and 10–40% of related sporadic tumours3. However, the collaborative mechanics of MSH and MLH/PMS proteins have not been resolved in any organism. We visualized Escherichia coli (Ec) ensemble mismatch repair and confirmed that EcMutS mismatch recognition results in the formation of stable ATP-bound sliding clamps that randomly diffuse along the DNA with intermittent backbone contact. The EcMutS sliding clamps act as a platform to recruit EcMutL onto the mismatched DNA, forming an EcMutS–EcMutL search complex that then closely follows the DNA backbone. ATP binding by EcMutL establishes a second long-lived DNA clamp that oscillates between the principal EcMutS–EcMutL search complex and unrestricted EcMutS and EcMutL sliding clamps. The EcMutH endonuclease that targets mismatch repair excision only binds clamped EcMutL, increasing its DNA association kinetics by more than 1,000-fold. The assembly of an EcMutS–EcMutL–EcMutH search complex illustrates how sequential stable sliding clamps can modulate one-dimensional diffusion mechanics along the DNA to direct mismatch repair.
Mismatch repair (MMR) is an excision-resynthesis system that is initiated at a DNA strand break, which may be located 3′ or 5′ and hundreds to thousands of base pairs away from the mismatch1. The fidelity of replication-associated MMR depends on communicating mismatch recognition to the distant strand break and then exclusively directing excision of the strand containing the misincorporation error1. Resynthesis of the single-strand DNA (ssDNA) gap appears to be independent of excision and is performed by the replicative polymerase1. Although the source of the strand break that directs MMR in most organisms remains unclear1,4–6, a subset of γ-proteobacteria that includes E. coli have evolved DNA adenine methylation (Dam) and the MutH endonuclease to specifically introduce a scission into a transiently hemimethylated Dam GATC site on the newly replicated strand7.
How MSH and MLH/PMS proteins communicate mismatch recognition to distant MMR components such as MutH continues to be uncertain8. A recent study with Thermus aquaticus (Ta) proteins suggested that TaMutL traps TaMutS at the mismatch, which then hypothetically acts as a catalyst to polymerize multiple TaMutL along the DNA9. Other studies have visualized Saccharomyces cerevisae (Sc) and human (Hs) MSH and MLH/PMS proteins diffusing along the DNA, although the role of these operations in MMR is unknown10–13. These mechanisms contrast a traditional model where the assembly of a MutS–MutL complex executes directional ATP-hydrolysis-driven DNA translocation to activate distant MMR14,15.
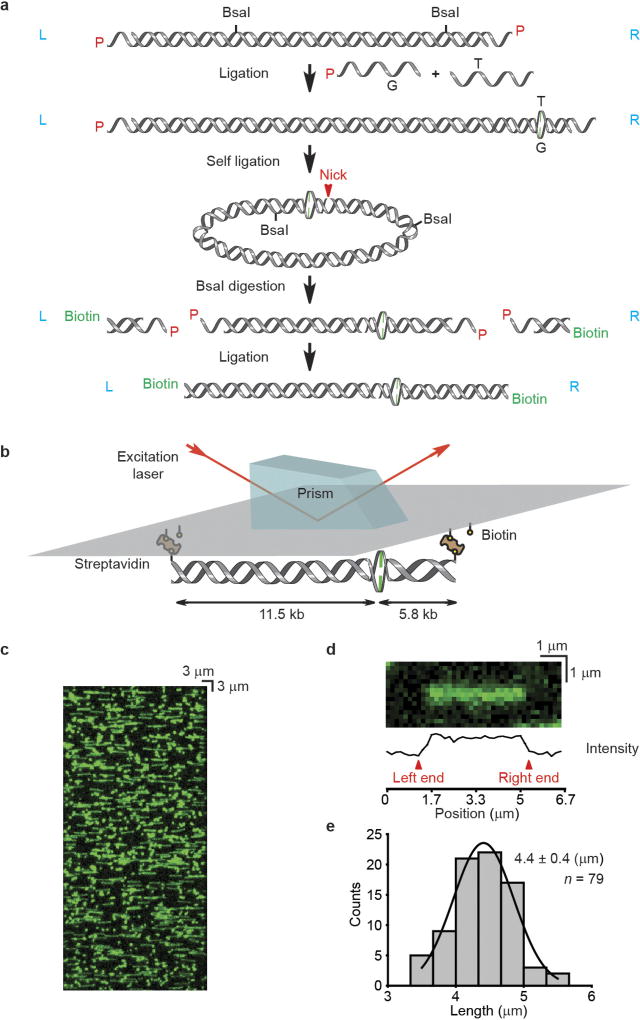
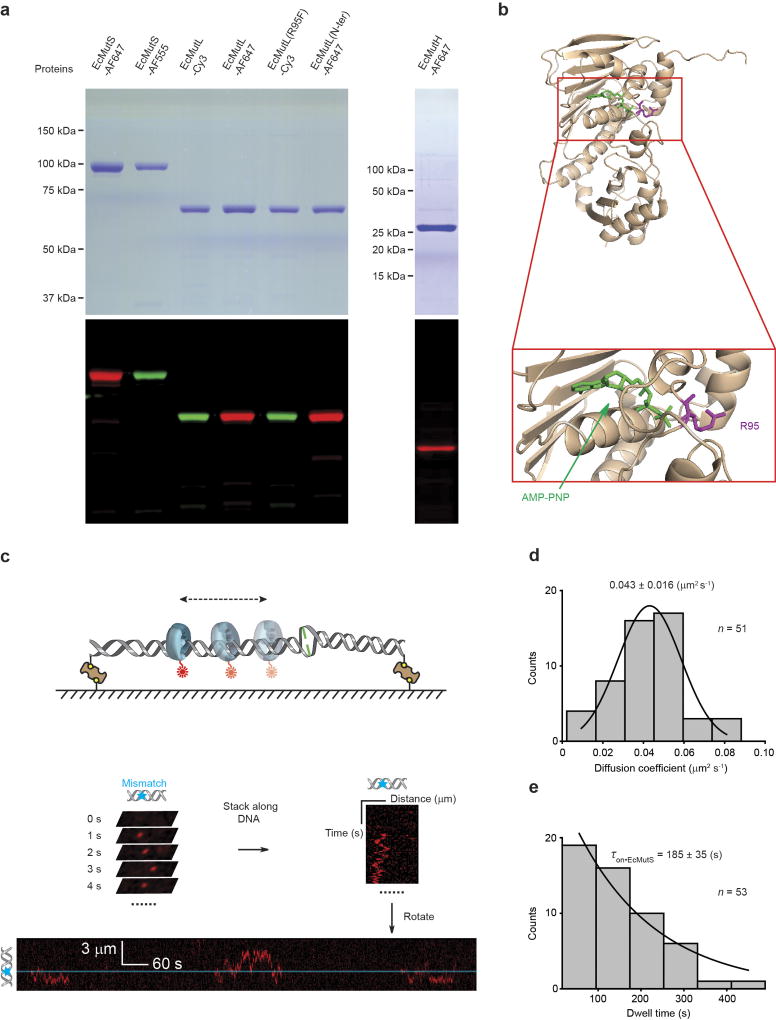
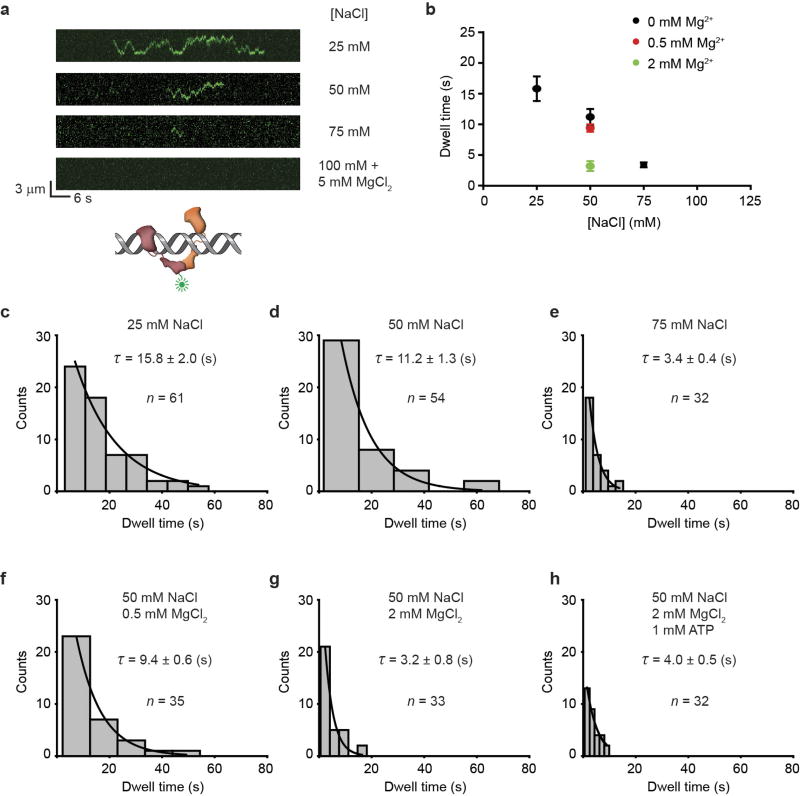
We used single-molecule total internal reflection fluorescence microscopy to image E. coli MMR on fields of ~200 well-defined doubly-tethered 17.3-kb mismatched DNAs16 (Extended Data Fig. 1, Extended Data Table 1, Methods). Injection of Alexa647 (AF647)-labelled EcMutS with ATP16 (Extended Data Tables 1, 2, Extended Data Fig. 2a, Methods) resulted in numerous particles (93% of total) that diffused along the DNA with a diffusion coefficient (DEcMutS = 0.043 ± 0.016 µm2 s−1) and an association lifetime (τon•EcMutS = 185 ± 35 s) that was two- to three-fold less than that of TaMutS or HsMSH2–HsMSH6 (Extended Data Tables 3, 4, Extended Data Fig. 2c–e)13,16,17. These observations support previous studies showing that mismatch binding provokes the formation of ATP-bound MSH sliding clamps that freely diffuse on DNA10,11,13,18,19. In contrast to other single-molecule imaging studies11,20, we found that Cy3-labelled EcMutL16 (Extended Data Tables 1, 2, Extended Data Fig. 2a) only binds DNA at low ionic strength or in the absence of magnesium, which was not altered with ATP (Extended Data Fig. 3).
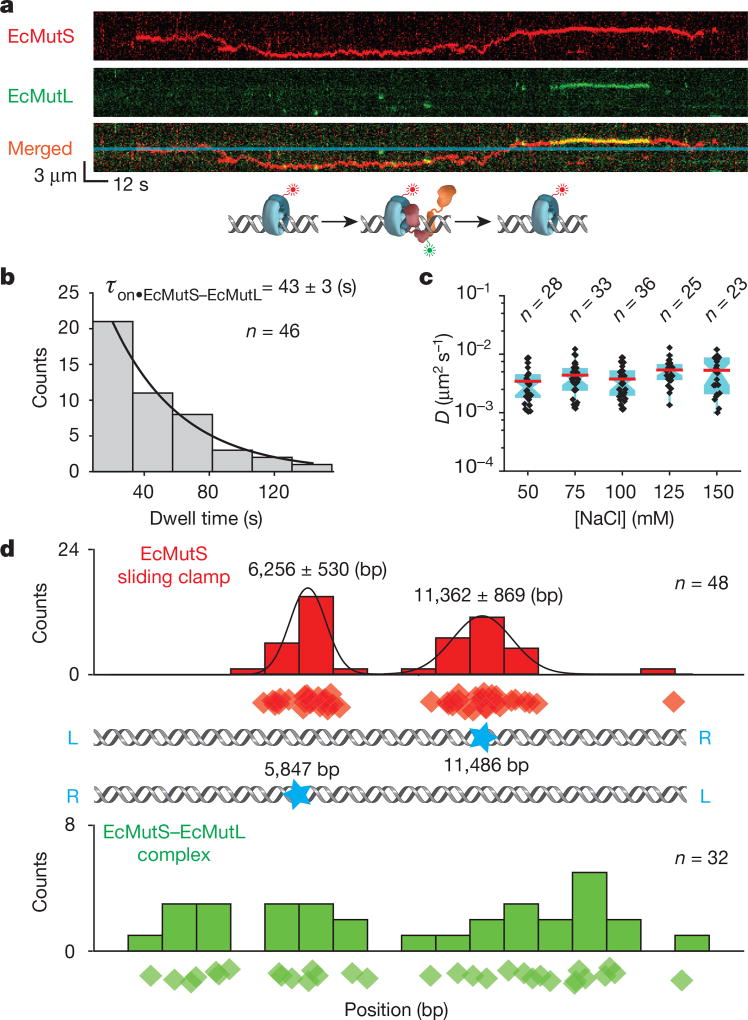
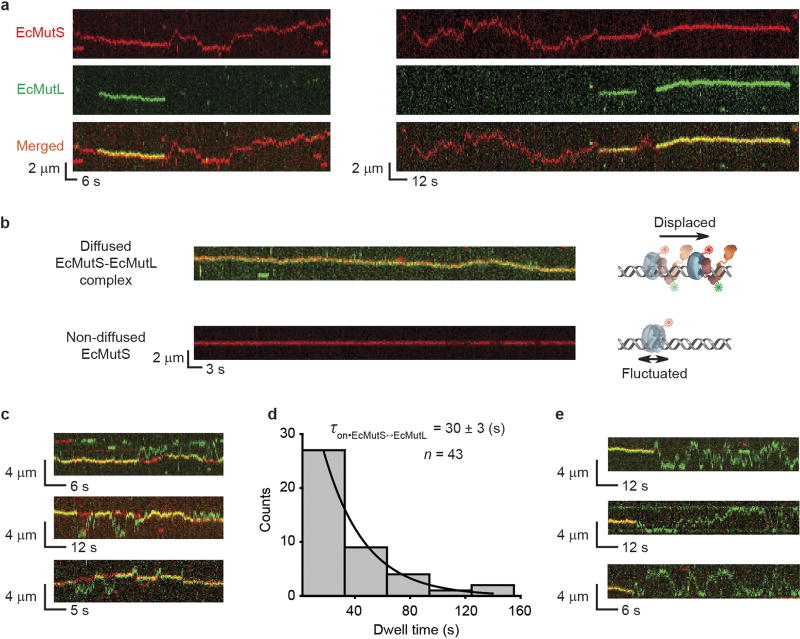
Co-injection resulted in frequent co-localization of EcMutS–AF647 and EcMutL–Cy3 particles on the mismatched DNA (Fig. 1a, Extended Data Fig. 4a, Supplementary Video 1). Most particles (80%) displayed unambiguous real-time coordinated movement along the DNA (Extended Data Table 3, Extended Data Fig. 4b) that permitted determination of the lifetime (τon•EcMutS–EcMutL = 43 ± 3 s) and diffusion coefficient (DEcMutS–EcMutL = 0.004 ± 0.002 µm2 s−1; Fig. 1b, c, Extended Data Table 4). The diffusion coefficient was constant over a range of ionic strengths (Fig. 1c, Extended Data Table 4), indicating the EcMutS–EcMutL complex remains in continuous DNA contact during diffusion21. By estimating the Stokes radius from published structures22 we calculated an average free-energy barrier (ε) of 1.7 kBT for rough-landscape diffusion23 (see Methods). These results are consistent with the conclusion that the EcMutS–EcMutL complex can engage in an efficient DNA search that includes rotation-coupled one-dimensional (1D) diffusion along the backbone10,23.
Figure 1. The formation of an EcMutS–EcMutL complex alters the diffusion properties of EcMutS.
a, Representative kymographs and illustration showing an EcMutL loaded by an EcMutS sliding clamp. Blue line indicates the mismatch position. b, The distribution of dwell times for the EcMutS–EcMutL complex (τon•EcMutS–EcMutL; mean ± s.e.m.). c, Box plots of D for the EcMutS–EcMutL complex at different NaCl concentrations (n = number of molecules; Methods). d, The distribution of the starting positions for EcMutS (top) or EcMutS–EcMutL complexes on DNA (bottom). There are two possible orientations of the mismatched DNA with mismatch position (blue star; middle panel). Diamonds in top and bottom panels represent individual starting events. Gaussian fit to the top panel distributions is shown as black lines with the mean ± s.d.
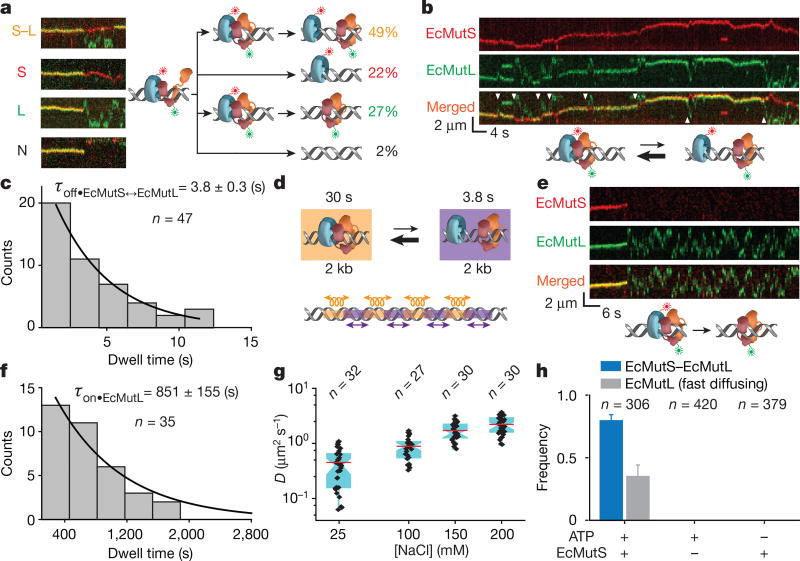
Although EcMutS sliding clamps originated at the mismatch (Fig. 1d, top), the initial association with EcMutL appeared random along the DNA (Fig. 1d, bottom). Following the assembly of an EcMutS–EcMutL complex, four types of dissociation mechanics were observed (Fig. 2a). The least common type (2% of total events) was simultaneous dissociation of both EcMutS and EcMutL from the mismatched DNA (Fig. 2a). The most common type (49%) engaged in a dynamic dissociation–association (oscillating) complex on the DNA (Fig. 2a, b, white arrows, Extended Data Fig. 4c, Supplementary Videos 2, 3). The association time for the oscillating EcMutS–EcMutL complex (τon•EcMutS↔EcMutL = 30 ± 3 s; Extended Data Fig. 4d) was similar to that of the initial EcMutS–EcMutL complex assembly (Fig. 1b). However, the dissociation lifetime was ~8-fold shorter (τoff•EcMutS↔EcMutL = 3.8 ± 0.3 s; Fig. 2c), indicating that EcMutS and EcMutL were in complex ~90% of the time (Fig. 2d). The location of the oscillating EcMutS–EcMutL complexes occurred over the entire DNA length (Fig. 2b, Extended Data Fig. 4c). Interestingly, the EcMutL clamps appeared to bypass the EcMutS clamps in 12% of the oscillation events (n = 67; Fig. 2b, lower white arrows).
Figure 2. The formation of an oscillating EcMutS–EcMutL complex and fast-diffusing EcMutL.
a, Representative kymographs and illustrations showing the different types of EcMutS–EcMutL complex dissociations (coloured letters). The frequency (%) of each dissociation type is shown (right, coloured numbers). b, Representative kymographs and illustration showing an oscillating EcMutS–EcMutL complex (white arrowheads indicates dissociation events). c, Dissociation time distribution (τoff•EcMutS↔EcMutL; mean ± s.e.m.) for the oscillating EcMutS–EcMutL complex. d, Illustration of oscillating EcMutS–EcMutL complex with lifetimes and calculated diffusion distances. Oscillations are indicated for illustration only and should be stochastic. e, Representative kymographs and illustration showing the dissociation and fast diffusion of EcMutL from an EcMutS–EcMutL complex. f, Dwell time distribution (mean ± s.e.m.) of fast-diffusing EcMutL on the mismatched DNA. g, Box plots of D for fast-diffusing EcMutL at different NaCl concentrations. h, The frequency of EcMutS–EcMutL complex and fast-diffusing EcMutL under various conditions (mean ± s.d.); n = number of DNA molecules.
A third type of EcMutS–EcMutL complex dissociation (22%) left EcMutS alone on the mismatch DNA that appeared to retain identical properties to the initially loaded EcMutS sliding clamps (Fig. 2a), whereas a fourth type (27%) left solitary extremely stable EcMutL particles on the DNA (τon•EcMutL = 851 ± 155 s; Fig. 2e, f, Extended Data Fig. 4e) that diffused ~20 times faster than EcMutS sliding clamps and ~200 times faster than the EcMutS–EcMutL complex (DEcMutL = 0.888 ± 0.393 µm2 s−1; Fig. 2g, Extended Data Table 4, Supplementary Video 4). DEcMutL increased with ionic strength, indicating that EcMutL diffuses with intermittent DNA contact21 (Fig. 2g, Extended Data Table 4). Both EcMutS and ATP were required to observe EcMutS–EcMutL complexes and stable fast-diffusing EcMutL particles on the mismatched DNA (Fig. 2h, Methods).
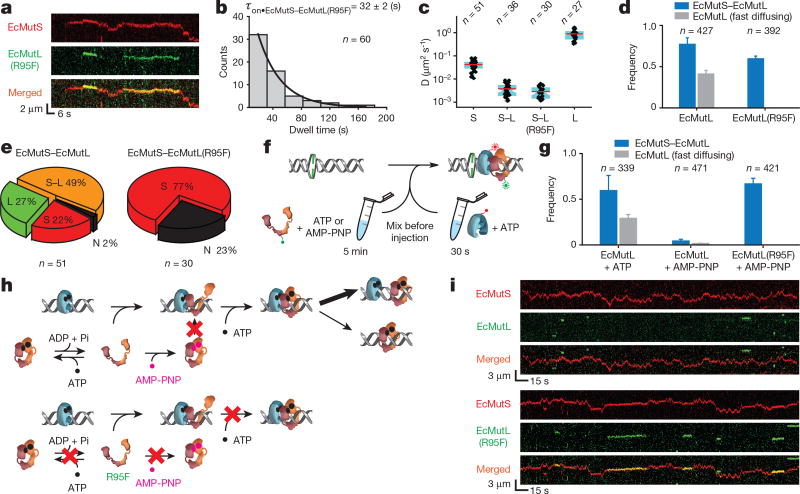
The ATP dependence, stability and intermittent DNA contact suggest that the EcMutL particles could engender a second sliding clamp. To test this hypothesis, we examined MMR-defective mutant protein EcMutL(R95F), which is incapable of binding ATP or activating EcMutH18,24 (Extended Data Tables 1, 2, Extended Data Fig. 2a, b). Numerous EcMutS–EcMutL(R95F) complexes were observed on the mismatched DNA that displayed a lifetime (τon•EcMutS–EcMutL(R95F) = 32 ± 2 s) and diffusion (DEcMutS–EcMutL(R95F) = 0.003 ± 0.002 µm2 s−1) similar to the wild-type EcMutS–EcMutL complex (85% of the particles; Fig. 3a–c, Extended Data Tables 3, 4). These results confirm that EcMutL(R95F) associates normally with EcMutS sliding clamps18. However, oscillating EcMutS–EcMutL(R95F) and stable fast-diffusing EcMutL(R95F) were never observed (Fig. 3d, Methods), with the majority of complex dissociations leaving EcMutS alone on the DNA (77%, Fig. 3e). We conclude that a principal role for ATP binding by EcMutL is to establish an oscillating EcMutS–EcMutL complex and/or stable fast-diffusing EcMutL.
Figure 3. ATP binding by EcMutL results in formation of a ring-like sliding clamp.
a, Representative kymographs showing the formation of two separate EcMutS–EcMutL(R95F) complexes on a mismatched DNA. b, Dwell time distribution for the EcMutS–EcMutL(R95F) complex (τon•EcMutS–EcMutL(R95F); mean ± s.e.m.). c, Box plots of D for the EcMutS sliding clamp (S); EcMutS–EcMutL complex (S–L); EcMutS–EcMutL(R95F) complex (S–L(R95F)); and EcMutL particle (L) at 100 mM NaCl. d, The frequency of EcMutS–EcMutL complex (blue) and fast-diffusing EcMutL (grey) with wild-type EcMutL or EcMutL(R95F) (mean ± s.d.). e, Pie charts showing the distributions of dissociation types for EcMutS–EcMutL or EcMutS–EcMutL(R95F) complexes. Frequency and dissociation types are indicated within the pie chart (see Fig. 2a). f, Illustration of ATP and AMP-PNP pre-incubation studies. g, The frequency of EcMutS–EcMutL complex and fast-diffusing EcMutL under various EcMutL or EcMutL(R95F) pre-incubation conditions (mean ± s.d.). h, Illustration showing AMP-PNP induced EcMutL ring-like clamp closure (top) that does not affect EcMutL(R95F) (bottom). i, Representative kymographs showing the absence of EcMutS–EcMutL complexes and the presence of EcMutS–EcMutL(R95F) complexes following pre-incubation of EcMutL or EcMutL(R95F) with AMP-PNP.
Pre-binding EcMutS with a poorly hydrolysable ATP analogue inhibits sliding clamp formation18, because it induces a closed ringlike structure that without hydrolysis is unable to interact with the mismatched DNA22,25. Similarly, a non-hydrolysable ATP analogue bound to EcMutL might produce a closed ring-like structure that is incapable of interacting with EcMutS or forming stable EcMutL particles on the mismatched DNA (Fig. 3f). As a control, pre-incubation of EcMutL with ATP did not significantly change the frequency of EcMutS–EcMutL complexes or stable EcMutL particles on the mismatched DNA (Fig. 3g, left; compared to Fig. 2h, Fig. 3d, Methods). However, pre-incubation of EcMutL with non-hydrolysable adenylyl-imidodiphosphate (AMP-PNP) substantially reduced the frequency of EcMutS–EcMutL complexes and stable EcMutL particles (Fig. 3g, middle, Fig. 3h, top), leaving mostly EcMutS sliding clamps on the DNA (Fig. 3i, top). Because EcMutL(R95F) cannot bind ATP, abundant EcMutS–EcMutL(R95F) complexes were observed following pre-incubation of AMP-PNP, which then never progressed to oscillating EcMutS–EcMutL or stable EcMutL particles (Fig. 3g, right, Fig. 3h, bottom, and Fig. 3i, bottom). These results are consistent with the idea that an open conformation of EcMutL is required to interact with EcMutS sliding clamps, which then binds ATP to form a second, exceedingly stable, ring-like clamp.
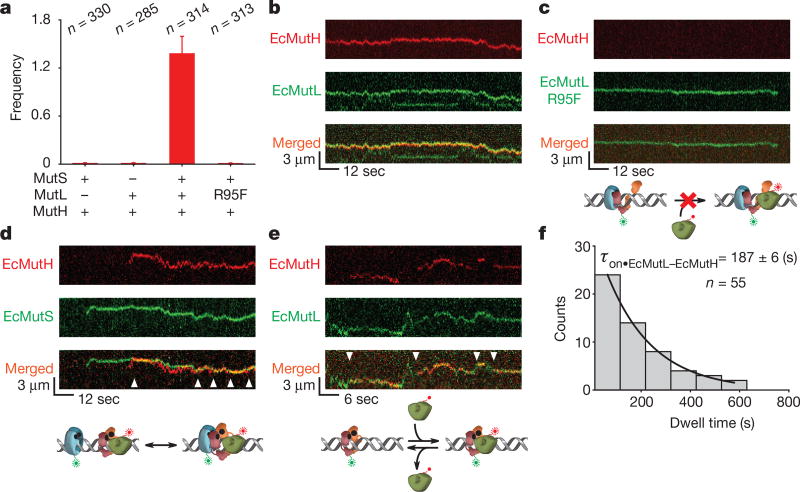
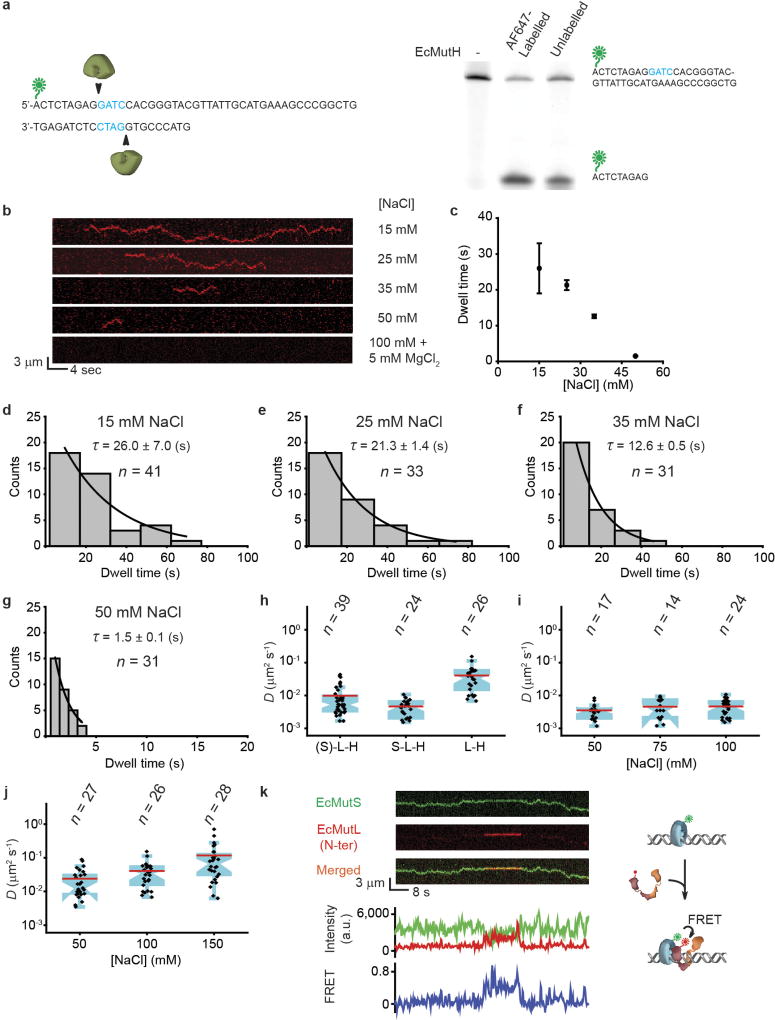
The EcMutH dissociation constant (Kd) with hemimethylated Dam GATC DNA is at least threefold higher than its cellular concentration26,27. EcMutL activation of the EcMutH endonuclease might overcome this binding problem18,28, although the mechanics of this progression are unknown. We only detected AF647-labelled EcMutH (Extended Data Table 1, Extended Data Figs 2a, 5a) bound to the mismatched DNA in ≤ 50 mM NaCl (Extended Data Fig. 5b–g). However, when both EcMutS and EcMutL were present, numerous EcMutH particles were observed on the mismatched DNA at physiological ionic concentration (Fig. 4a, Methods). The majority of EcMutH–AF647 (89% of particles) co-localized and displayed coordinated diffusion with EcMutL–Cy3 (Fig. 4b, Extended Data Table 3). No EcMutH binding was observed when EcMutL(R95F) replaced wild-type EcMutL (Fig. 4a, c), suggesting that EcMutH only associates with an ATP-bound EcMutL sliding clamp.
Figure 4. EcMutH binds EcMutL sliding clamps.
a, The frequency of EcMutH–AF647 on the mismatched DNA in the presence of other MMR components (mean ± s.d.). b, Representative kymographs of EcMutH–AF647 co-localization and diffusion with EcMutL–Cy3 (and unlabelled EcMutS) on a single mismatched DNA. c, Representative kymographs of EcMutL(R95F)–Cy3 (and unlabelled EcMutS) diffusion on a single mismatched DNA. Note the absence of EcMutH–AF647. d, Representative kymographs of EcMutH–AF647 co-localization and diffusion with EcMutS–AF555 (and unlabelled EcMutL) on a single mismatched DNA. Arrowheads indicate association of EcMutS with EcMutL–EcMutH. e, Representative kymographs of EcMutH–AF647 co-localization and diffusion with EcMutL–Cy3 on a single mismatched DNA following the dissociation of EcMutS. Arrowheads indicate association of EcMutH with EcMutL sliding clamp. f, Dwell time distribution of the EcMutL–EcMutH complex (τon•EcMutL–EcMutH; mean ± s.e.m.).
By substituting EcMutS–AF555 for EcMutL–Cy3, we observed EcMutS–EcMutL–EcMutH complexes (Fig. 4d) that oscillated with free EcMutS and EcMutL–EcMutH, and displayed similar ionic-strength-independent diffusion properties to the EcMutS–EcMutL complex (DEcMutS–EcMutL–EcMutH = 0.005 ± 0.003 µm2 s−1; Extended Data Table 4, Extended Data Fig. 5h, middle, Extended Data Fig. 5i, Supplementary Video 5). As predicted, labelled EcMutL–EcMutH complexes (with unlabelled EcMutS) oscillated with a mean diffusion coefficient that was skewed faster than the EcMutS–EcMutL complex (P = 0.001; D(EcMutS)–EcMutL–EcMutH = 0.010 ± 0.010 µm2 s−1; Fig. 4e, Extended Data Fig. 5h, left, Extended Data Table 4). The lifetime of the EcMutL–EcMutH complex appeared to be independent of EcMutS association and increased the intrinsic EcMutH DNA binding kinetics by at least 1,000-fold (τon•EcMutL-EcMutH = 187 ± 6 s; compare Fig. 4f to Extended Data Fig. 5c). The diffusion coefficient of free EcMutL–EcMutH complex was intermediate between EcMutS–EcMutL complex and EcMutL sliding clamp (P < 0.0001; DEcMutL–EcMutH = 0.041 ± 0.034 µm2 s−1; Extended Data Fig. 5h, right; Methods) and increased with ionic strength, indicating that the EcMutL–EcMutH complex moves with intermittent DNA contact21 (Extended Data Fig. 5j, Extended Data Table 4). Together these observations suggest that the EcMutS–EcMutL–EcMutH complex is uniquely capable of engaging in an efficient 1D diffusion-mediated DNA search for a hemimethylated Dam GATC site.
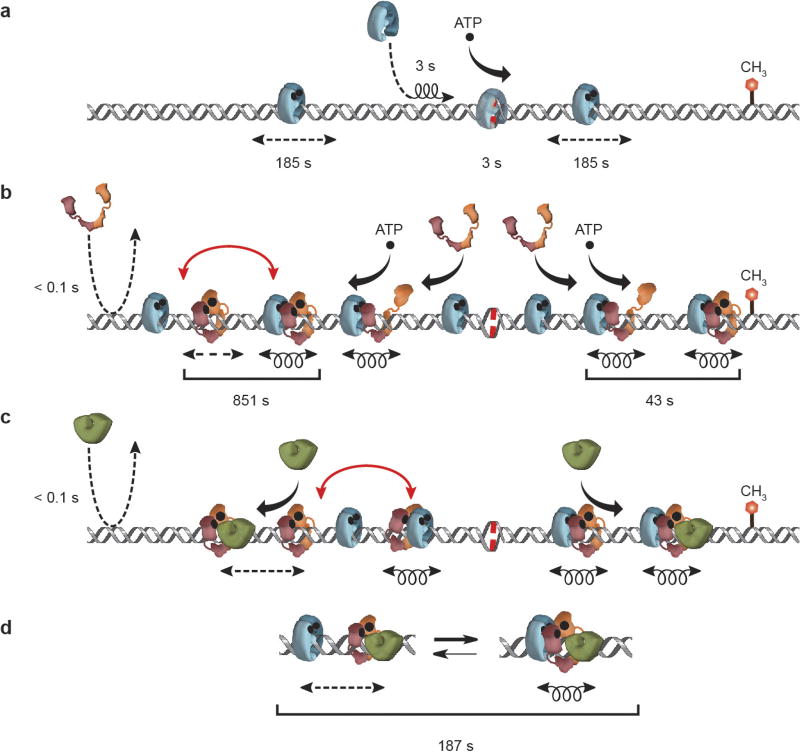
Our studies demonstrate that E. coli MMR employs a cascade of stable ATP-bound sliding clamps to modulate 1D diffusion mechanics along the DNA. These observations show how mismatch recognition is effectively communicated to a distant MMR initiation site and provides additional support for the molecular switch/sliding clamp model18,29. In this model, EcMutS mismatch recognition forms ATP-bound sliding clamps that randomly diffuse with intermittent DNA contact, establishing a stable platform capable of attracting other MMR components10,13,18,19,30 (Extended Data Fig. 6a). The association of EcMutL with an EcMutS sliding clamp creates a previously unrecognized EcMutL sliding clamp that displays binding oscillation with EcMutS (Extended Data Fig. 6b). Both an EcMutS sliding clamp and ATP binding by EcMutL are required to create these configurations (Extended Data Fig. 6b). Single-molecule images of quantum-dot-labelled ScMsh2–ScMsh6 and ScMlh1–ScPms1 on duplex20 and mismatched DNA curtains11 appeared unable to detect these conformations (Supplementary Note 1).
We confirmed that the N terminus of EcMutL interacts with EcMutS sliding clamps using Förster resonance energy transfer22 (FRET; Extended Data Fig. 5k, Supplementary Video 6). These observations are consistent with a molecular progression where one of the EcMutL N-terminal homodimer domains interacts with EcMutS22, creating a scaffold for the remaining EcMutL domains to wrap around the DNA in concert with natural helical motions during complex diffusion along the backbone; ultimately triggering ATP-dependent N-terminal domain dimerization and clamp formation24. The fast diffusion and intermittent DNA contact of EcMutL sliding clamps makes ATPinduced collapse of the linker arms between the N- and C-terminal domains unlikely31. Indeed, the EcMutS sliding clamps were capable of passing through the EcMutL sliding clamps in 12% of bindingoscillation encounters. We conclude that the fundamental role of ATP binding by EcMutL is to form an exceedingly stable sliding clamp on mismatched DNA. This observation might explain the persistence of ScMlh1–ScPms1 during MMR in vivo32.
The EcMutS–EcMutL complex remains in continuous DNA contact and capable of performing an efficient 1D diffusion-mediated DNA search23. The oscillation of EcMutS–EcMutL with free EcMutS and EcMutL sliding clamps suggests that the complex may search ~2 kb of DNA, dissociate, move ~2 kb, then re-associate and begin a new ~2 kb search. This segmented search cycle may interrogate ~12 kb of DNA during the limiting lifetime of EcMutS sliding clamps (Extended Data Fig. 6a). Visualizing EcMutS–EcMutL diffusion clearly contrasts a trapped TaMutS–TaMutL9. It is likely that the TaMutS–TaMutL studies were influenced by an obligatory FRET constraint near the mismatch and/or the use of thermophilic proteins that become active at higher temperatures.
EcMutH exclusively associated with the ATP-bound EcMutL either in the EcMutS–EcMutL search complex or as a free sliding clamp (Extended Data Fig. 6c). Importantly, the EcMutL–EcMutH complex diffuses with intermittent DNA contact, albeit ~20-fold slower than EcMutL. A simple explanation is that EcMutH increases the sporadic DNA interactions slowing EcMutL–EcMutH diffusion along the DNA. Nevertheless, the intermittent DNA contact implies that the EcMutL–EcMutH complex is probably not capable of performing an efficient DNA search. In contrast, the EcMutS–EcMutL–EcMutH complex remains in continuous contact with the DNA backbone allowing it to engage in a 1D diffusion-mediated search that may efficiently locate a distant hemimethylated Dam GATC site (Extended Data Fig. 6d).
A mechanism that utilizes modulated stochastic diffusion along the DNA to initiate excision contrasts most historical MMR models8,9,14,15. The notable conservation of MSH and MLH/PMS proteins implies that a similar mechanics is probably widely used for exploring the DNA backbone and activating distant MMR processes; it might also be used by MSH and MLH/PMS to connect damage sensing to the DNA damage response machinery2.
METHODS
Buffers and experiment conditions
The single-molecule imaging Buffer A contains 20 mM Tris-HCl (pH 7.5), 5 mM MgCl2, 0.1 mM DTT, 0.2 mg ml−1 acetylated BSA (Promega), 0.0025% P-20 surfactant (GE healthcare) and 100 mM NaCl (unless stated otherwise). To minimize photoblinking and photobleaching, imaging buffer was supplemented with a photostability enhancing and oxygen scavenging cocktail containing saturated (~3 mM) Trolox and PCA/PCD oxygen scavenger system composed of PCA (1 mM) and PCD (0.42 U ml−1, rPCO, OYC Americas)33.
Construction of 17.3-kb λ-phage-based DNA with a single mismatch
λ-phage DNA (3.2 nM, Thermo Scientific) was ligated with the lambda mismatch 1 oligonucleotide (800 nM; Extended Data Fig. 1, Extended Data Table 1) at room temperature (22 °C) overnight. The unligated oligonucleotides were removed by a 100 kDa Amicon filter (Millipore). The resulting DNA (3.2 nM) was then ligated with lambda mismatch 2 (800 nM) at room temperature overnight, followed by the removal of unligated oligonucleotides as above. The resulting DNA (1.6 nM) was cyclized at 18 °C overnight and digested with BsaI at 37 °C for 4 h. The BsaI-treated DNA was then ligated with the lambda linkers (~2 µM, Extended Data Table 1) at 18 °C overnight. The DNA ligation products were separated on a 0.5% low melting agarose (Promega) gel; the 17.3-kb band was excised and treated with β-agarase (New England Biolabs) followed by isopropanol precipitation. The purified DNA was resuspended in TE buffer (10 mM Tris-HCl, pH 7.5, 1 mM EDTA) and stored at −20 °C until use. To methylate the mismatched DNA (Fig. 4, Extended Data Fig. 5h–j), 1 µg mismatched DNA was incubated with 80 µM S-adenosylmethionine and 8 U of Dam methyltransferase (New England Biolabs) at 37 °C for 2 h in an 100-µl reaction, followed by inactivation of the enzyme at 65 °C for 15 min. Control experiments demonstrate that the DNA becomes completely resistant to MboI, indicating full methylation.
Plasmid construction, MMR protein labelling and purification
EcMutS and EcMutL expression constructs have been previously described16. The EcMutL(R95F) point mutation was generated using the QuikChange site-directed mutagenesis kit (Stratagene). Hexa-histidine (his6) and formylglycine-generating enzyme (FGE) recognition hexa-amino acid sequence (LCTPSR; ald6) were introduced on to the C terminus of all MMR proteins with the exception of EcMutL(N-ter) and EcMutH, in which the tags were introduced on to the N terminus using a previously described protocol16. Two glycine residues separated the his6 and ald6 from one another and these tags were separated from the MMR proteins by two serine residues. The order of these tags relative to the MMR gene is indicated in Extended Data Table 2. The E. coli mutH gene was amplified by PCR (Extended Data Table 1), digested with NdeI and BamHI, and inserted into pET-29a (Novagen) bacterial expression plasmid. The resulting construct was amplified in E. coli XL10 gold (Stratagene) and verified by DNA sequencing. All the EcMutS and EcMutL proteins were expressed, labelled and purified as described previously16. EcMutH was expressed, labelled and purified by a protocol similar to EcMutS. All of the his6- and ald6-tagged MMR gene constructs used in these studies were shown to have a wild-type phenotype by complementation analysis in respective MMR-deficient E. coli strains except EcMutL(R95F), which was genetically a mutator indicating an MMR-deficiency as a result of a complete inability to bind ATP18 (Extended Data Table 2). We used EcMutS(D835R,R840E) since the combined D835R and R840E substitution mutations eliminate the anomalous confounding effects of EcMutS protein tetramerization in vitro34 (Extended Data Table 2). The labelling efficiencies of EcMutS–AF647 dimer (45%), EcMutL–Cy3 dimer (33%), EcMutL(R95F)–Cy3 dimer (29%) and EcMutH–AF647 monomer (50%) were determined by spectrophotometry as described16 (Extended Data Table 1).
Total internal reflection fluorescence microscopy and single-molecule studies
All the single-molecule data in this study were acquired on a custom-built prismtype total internal reflection fluorescence microscope based on the Olympus microscope body IX71. Fluorophores were excited using the laser lines (532 nm for green, 635 nm for red) in the single-molecule total internal reflection fluorescence microscopy system. Image acquisition was performed using an EMCCD camera (ProEM Exelon512, Princeton Instruments) after splitting emissions by a Dual View optical setup (DV2, Photometrics). Micro-Manager image capture software was used to control the opening and closing of a shutter, which in turn controlled the laser excitation35.
The 17.3-kb mismatched DNA (300 pM) in 300 µl T50 buffer (20 mM Tris-HCl, pH 7.5, 50 mM NaCl) was injected into the flow cell chamber and stretched by laminar flow (250 µl min−1). The stretched DNA was anchored onto a streptavidin-coated, PEG passivated quartz slide surface, and the unbound DNA was flushed by similar laminar flow.
To detect transiently bound EcMutL or EcMutH on DNA (Extended Data Figs 3, 5b–g), EcMutL or EcMutH (2–10 nM) in imaging buffer was introduced into the flow cell chamber and protein-DNA interactions were monitored in real-time in the absence of flow at ambient temperature. The DNA was stained with Sytox Orange (250 nM, Invitrogen) or Syto 59 (700 nM, Invitrogen) after recording.
To measure the interaction between EcMutS and EcMutL, EcMutS (10 nM) and/or EcMutL (20 nM) in imaging buffer plus 1 mM ATP (unless stated otherwise) were introduced into the flow cell chamber and protein–DNA interactions were monitored.
Fully methylated DNA was used in the EcMutS–EcMutL–EcMutH experiments (Fig. 4). To measure the interaction between EcMutL and EcMutH, unlabelled EcMutS (5 nM), EcMutL–Cy3 (10 nM) and EcMutH–AF647 (5 nM) in imaging buffer plus 1 mM ATP were introduced. To measure the interaction between EcMutS and EcMutH, EcMutS–AF555 (10 nM), unlabelled EcMutL (20 nM) and EcMutH–AF647 (5 nM) in imaging buffer plus 1 mM ATP were introduced.
To determine the EcMutL sliding clamp diffusion coefficient, EcMutS and EcMutL in imaging buffer (100 mM NaCl) plus 1 mM ATP were first co-injected. After 5 min the flow cell was flushed with imaging buffer containing 25–200 mM NaCl and 1 mM ATP to remove unbound proteins and EcMutL sliding clamps were monitored.
To determine the diffusion coefficient of the free EcMutL–EcMutH complex, unlabelled EcMutS (5 nM) and EcMutL–Cy3 (10 nM) in imaging buffer (100 mM NaCl) plus 1 mM ATP were first co-injected. After 5 min the flow cell was flushed with imaging buffer containing 100 mM NaCl and 1 mM ATP to remove unbound proteins. EcMutH–AF647 (5 nM) in imaging buffer containing 50–150 mM NaCl and 1 mM ATP was then introduced. 15 min after the wash diffusing EcMutH particles were monitored.
AMP–PNP pre-incubation
EcMutL or EcMutL(R95F) (200 nM) was incubated with 2.5 mM ATP or AMP-PNP in 100 µl Buffer A for 5 min. In a separate reaction, EcMutS (11 nM) was incubated with 1.1 mM ATP in 900 µl Buffer A for 30 s. The two reactions were then mixed and introduced into the flow cell chamber immediately followed by the single-molecule imaging.
Single-molecule data analysis
We found that 93% (52 out of 56) of the EcMutS sliding clamps displayed 1D diffusion along the mismatch DNA, whereas 7% (4 out of 56) remained on the mismatch (Extended Data Table 3). It is likely that the 7% EcMutS that remained on the mismatch reflects inactive proteins that do not respond to ATP binding11,13 and was excluded from further analysis. Molecules that diffused for at least 10 s (300–1,500 ms frame rate) were included in the diffusion analysis.
For studies involving EcMutS and EcMutL, fluorescent molecules in two channels were co-localized using a custom written MATLAB script. In these studies 80% (43 out of 54) of the co-localized molecules displayed 1D diffusion, while 20% (11 out of 54) exhibited insignificant movement (Extended Data Table 3). Most of the stationary molecules appeared to be associated with the flow-cell surface and not subsequently stained DNA molecules (Extended Data Table 3). A similar distribution was observed for the EcMutS–EcMutL(R95F) complex (Extended Data Table 3). We excluded these immobile molecules from further analysis and only included molecules that diffused for at least for 10 s (250–600 ms frame rate).
In the presence of EcMutS and EcMutL, 89% (85 out of 95) of the EcMutH molecules displayed stable 1D diffusion along the DNA, while 11% (10 out of 95) exhibited insignificant movement (Extended Data Table 3). Most of the stationary molecules appeared to be associated with the flow-cell surface and not subsequently stained DNA molecules (Extended Data Table 3). We excluded these immobile molecules from further analysis and only included molecules that diffused for at least for 10 s.
EcMutL sliding clamps were easily distinguished from the EcMutS–EcMutL complex as a result of its extremely fast diffusion along the DNA (Fig. 2e, g). We included molecules with D > 0.05 µm2 s−1 for this analysis.
Position determination on DNA
After the real-time measures, the 17.3-kb mismatched DNA was stained with Syto 59 (700 nM, Invitrogen) or Sytox Orange (250 nM, Invitrogen). The left (PL) and the right (PR) end positions of the DNA were determined by plotting the fluorescent intensities along the length of the stained DNA (Extended Data Fig. 1d). Horizontal positions of diffusing particles (PP) along the length of the DNA were tracked by DiaTrack 3.04 (Sydney, Australia), in which the particle intensities were fit to a two-dimensional Gaussian function to obtain their positions with sub-pixel resolution. The positions were then converted to lengths in bp by the following equation: 17,332 bp × (PP−PL) / (PR−PL), where 17,332 bp is the length of the mismatched DNA. A 1,000 bp (~2 pixels) binning size was used to construct the position histograms.
Diffusion coefficient measurement and diffusion distance calculation
Particles were tracked using DiaTrack as described above to obtain single-molecule trajectories. Diffusion coefficients were calculated from the trajectories as described previously36. Briefly, the diffusion coefficient (D) was determined from the slope of a mean–square displacement (MSD) versus time plot using the equation MSD(t) = 2 Dt, where t is the time interval. The first 10% of the total measurement time was taken for point fitting. A minimum number of 50 frames were used to calculate the diffusion coefficients except for EcMutS–EcMutL complexes at 125 mM or 150 mM NaCl, in which 30 frames were used as the minimum because of the shortened lifetime. The MSD of each molecule was calculated by:
where t = nΔT (n = 1, 2, 3…., ΔT is the sampling rate), N = total number of diffusion events, x = horizontal position, and i = diffusion event. Diffusion coefficients were graphed in box plots (Figs. 1c, 2g, 3c, Extended Data Fig. 5) showing the mean (red line), median (indentation), the upper and the lower quartiles (box ends) and the outliers (whiskers). Diamonds indicate individual events. The average diffusion distance (d) was calculated using the equation: , where t is the average lifetime of the particles on the DNA (Fig. 2d). Only EcMutS diffusion distance was reported during dissociation events of EcMutS–EcMutL complex.
Lifetime measurement
A 100-ms or 200-ms frame rate was used to measure transient-bound EcMutL or EcMutH on DNA. A 1.5-s frame rate with 300-ms laser exposure time was used to minimize photo-bleaching during EcMutS sliding clamp or EcMutL sliding clamp lifetime measurements. A 1.0-s frame rate with 300-ms laser exposure time was used to minimize photo-bleaching during EcMutL–EcMutH complex lifetime measurements. A 600-ms frame rate with a 300-ms laser exposure time was used to detect transient association-dissociation during EcMutS–EcMutL complex lifetime measurements. Kymographs were generated along the DNA by a kymograph plugin in ImageJ (J. Rietdorf and A. Seitz, EMBL Heidelberg). The dwell times of EcMutS sliding clamps, EcMutL particles or EcMutH particles on DNA were obtained from kymographs and binned to generate dwell time distributions, which were then fit to single exponential decay functions to determine the mean ± s.e.m. For EcMutS–EcMutL complexes, kymographs of both channels were merged and dwell times were obtained from the overlapping regions of the kymographs. Since we never observed EcMutH DNA binding at physiological ionic conditions, the lifetime of the EcMutL–EcMutH complex was obtained from kymographs of EcMutH channel alone.
Binning method
All the binning methods in diffusion coefficient and lifetime analysis were described previously36 and shown as below:
where: N = numbers of events; max = maximum value of events; min = minimum value of events; bin start = min; bin end = min + (bin size × number of bins). Bins distribution were then fit to standard curves37.
EcMutS–EcMutL complex, EcMutL sliding clamp and EcMutL–EcMutH complex frequency measurements
EcMutS–EcMutL complex, EcMutS–EcMutL(R95F) complex, EcMutL sliding clamp, and EcMutL(R95F) sliding clamp frequency measurements were performed at a 600-ms frame rate with a 300-ms laser exposure time. Following the infusion of proteins, single-molecule movies (10 min) were recorded either immediately (Figs. 2h, 3g) or after 10 min incubation to establish equilibrium (Fig. 3d). EcMutL or EcMutL(R95F) were tracked by DiaTrack and the trajectories were obtained as described above. EcMutL or EcMutL(R95F) with a minimum lifetime of 30 s and a minimum diffusion coefficient of 0.1 µm2 s−1 were counted as the number of EcMutL sliding clamps (NL or NL(R95F)). EcMutS and EcMutL (or EcMutL(R95F)) channels were merged and co-localized molecules with a minimum lifetime of 10 s were counted as EcMutS–EcMutL or EcMutS–EcMutL(R95F) complexes (NSL or NSL(R95F)). Following the real-time single-molecule recording, the number of DNA molecules (NDNA) was determined by Sytox Orange staining. The frequencies of EcMutL sliding clamps (FL), EcMutL(R95F) sliding clamps (FL(R95F)), EcMutS–EcMutL complexes (FSL) and EcMutS–EcMutL(R95F) complexes (FSL(R95F)) were calculated using the following equations that also included corrections for labelling efficiencies of the proteins (the numbers in the denominator, Extended Data Table 1):
EcMutL–EcMutH complex frequency measurement experiments were performed at a 600-ms frame rate with a 300-ms laser exposure time by using unlabelled EcMutS (5 nM), EcMutL–Cy3 (10 nM) and EcMutH–AF647 (5 nM). Following the infusion of proteins, single-molecule movies (10 min) were recorded immediately (Fig. 4a). EcMutH was tracked using DiaTrack and the trajectories were obtained as described above. EcMutH particles with a minimum lifetime of 10 s were counted as the number of EcMutL–EcMutH complex (NLH). Following the real-time single-molecule recording, the number of DNA molecules (NDNA) was determined by Syto 59 staining. The frequencies of EcMutL–EcMutH complex (FLH) were calculated using the following equation that also included corrections for labelling efficiencies of the proteins (the numbers in the denominator, Extended Data Table 1):
All single-molecule studies were performed at least two separate times.
Analysis of the distribution of EcMutS–EcMutL complex dissociation processes
Following the infusion of proteins, single-molecule movies (10 min) were recorded after a 10 min incubation to establish equilibrium (Figs. 2a, 3e). Kymographs of EcMutS–EcMutL complex or EcMutS–EcMutL(R95F) complex were obtained by merging the two channels. We included only the initial events for individual molecules in the analysis when multiple events between the same molecules were observed.
MMR complementation in vivo
P. L. Foster (Indiana University) supplied the E. coli strains (all derivatives of MG1655 F- lambda- ilvG- rfb-50 rph-1). Mutation rates to rifampicin resistance were determined as previously described34, using at least seven independent colonies for each genotype. ΔmutS, ΔmutL and ΔmutH strains were co-transformed with respective MMR protein expression plasmids (Extended Data Table 2) and pTARA plasmid38 (for T7 RNA polymerase expression, a gift from K. Matthews, Addgene plasmid 31491). Single colonies were picked and grown overnight in the presence of 50 µg ml−1 kanamycin, 35 µg ml−1 chloramphenicol, 0.2% Arabinose, and IPTG (0.05 mM for EcMutS, 0.2 mM for EcMutL and 0.1 mM for EcMutH). As controls, single colonies of wild-type, ΔmutS, ΔmutL and ΔmutH strains without plasmids were similarly grown overnight. Dilutions of overnight cultures were plated on LB-Agar plates with or without 100 µg ml−1 rifampicin and allowed to grow overnight at 37 °C. The colonies on LB with or without rifampicin were counted and the mutation rates were determined by fluctuation analysis39.
EcMutH endonuclease activity assay
The d(GATC) endonuclease activity associated with EcMutH was assayed using 50 nM of the unmethylated FAM-labelled DNA substrate incubated with 4 µM EcMutH in a 50 µl reaction containing 20 mM Tris–HCl (pH 7.5), 5 mM MgCl2 and 0.1 mM DTT at 37 °C for 1 h. DNA was then denatured in 50% formamide at 95 °C for 10 min and resolved on a 12% denaturing PAGE gel.
Analysis of EcMutS–EcMutL complex by smFRET
Particle positions were tracked with DiaTrack and particle trajectories were determined as previously described36. The fluorescent intensities of the particles in both channels (IAF555 and IAF647) were obtained from the trajectories using a custom written MATLAB script. A background correction was applied to all the intensities by using intensities in blank area. The apparent FRET efficiency was calculated as IAF647/(IAF555 + IAF647).
Average free-energy barrier calculation for the EcMutS–EcMutL complex
To determine whether EcMutS–EcMutL complex diffusion includes rotational as well as translation diffusion we calculate the free-energy barrier of rotation along the DNA in aqueous solution (ε)23,36. These interactions can be described by diffusion on a rugged free-energy landscape by the following equation:
Where:
kB = Boltzmann constant; T = temperature (Kelvin); η = viscosity of water; R = Stoke’s radius of the complex; b = (10Bd)/(2π), describes the effect of the helical pitch of DNA with regards to sliding; Bd = distance between two base pairs (0.34 nm); Roc = minimum distance between the protein centre of mass and the DNA axis. Here, Roc is estimated to be zero, because the centre of mass of MutS or MutL sliding clamp is close to the DNA axis; and F(ε) = exp(− (ε/kBT)2), describes the fluctuating part of the potential function that obeys a Gaussian distribution23.
The Stoke’s radii of an EcMutS dimer and an EcMutL dimer are 5 nm and 9 nm, respectively34,40. There is no available Stoke’s radius for the EcMutS–EcMutL complex; however, it is expected to be larger than that of EcMutL. Thus, we estimated a Stoke’s radius of 9 nm for the EcMutS–EcMutL complex. The calculated ε in the equation using the experimentally determined diffusion coefficient for the EcMutS-EcMutL complex (0.004 ± 0.002 µm2 s−1) yields an energy landscape of 1.7 ± 0.2 kBT (s.d.).
Data availability
The data that support the findings of this study are available from the authors upon reasonable request.
Extended Data
Extended Data Figure 1. The construction of mismatched DNA used in single-molecule total internal reflection fluorescence (smTIRF) microscopy.
a, A schematic illustration for the construction of a 17.3-kb mismatched DNA. L or R (blue) indicates the orientation of the DNA relative to the L and R cos end of λ-phage DNA. P (red) indicates the 5′-phosphate of the DNA. b, A schematic illustration of 17.3-kb mismatched DNA observation by prism-based smTIRF microscopy. c, Representative mismatched DNA visualized by smTIRF microscopy in the absence of flow. The DNA was stained with Sytox Orange and a 40 × 85 µm field of view is shown. d, A schematic illustration of the DNA length determination. e, The length distribution of the mismatched DNA observed by smTIRF microscopy. Gaussian fit of the data are shown along with the mean ± s.d.
Extended Data Figure 2. The fluorophore-labelled E. coli MMR proteins used in these studies and the formation of an EcMutS sliding clamp on DNA.
a, Coomassie stained (top) and fluorescent (bottom) SDS–PAGE gels of labelled MMR proteins. For gel source data, see Supplementary Fig. 1. b, A crystal structure of the N-terminal domain of EcMutL bound to AMP-PNP (top) and magnification of the binding domain (bottom; PDB ID: 1B63). AMP-PNP is shown in green and Arg-95 (R95) is shown in magenta24. c, An illustration of the kymograph construction of three separate EcMutS sliding clamps on a single mismatched DNA. d, The distribution of diffusion coefficients for the EcMutS sliding clamp. The data were fit to a Gaussian with the mean ± s.d. e, The distribution of dwell times (mean ± s.e.m.) for the EcMutS sliding clamp.
Extended Data Figure 3. EcMutL does not bind DNA in physiological ionic conditions.
a, b, Representative kymographs and dwell-times (mean ± s.e.m.) for EcMutL binding to a mismatched DNA at various conditions. c–h, The distributions of dwell times (mean ± s.e.m.) for EcMutL on mismatched DNA at different biochemical conditions as indicated.
Extended Data Figure 4. Representative kymographs of EcMutS–EcMutL complex and EcMutL particles.
a, Representative kymographs showing the loading of EcMutL (green) on DNA by EcMutS sliding clamp (red). b, Representative kymographs of a diffusing EcMutS–EcMutL complex (merged channels) and a non-diffusing EcMutS (red) in the same field of view. The static kymograph of a non-diffusing EcMutS indicates that the change in protein position caused by microscope stage drifting is negligible. c, Representative kymographs of oscillating EcMutS–EcMutL complexes. Two channels (red, EcMutS; green, EcMutL) were merged. d, The distribution of the association times (mean ± s.e.m.) for EcMutS–EcMutL complexes during the oscillating phase. e, Representative kymographs of fast-diffusing EcMutL dissociation from EcMutS–EcMutL complexes. Two channels (red, EcMutS; green, EcMutL) were merged.
Extended Data Figure 5. EcMutH lifetime on DNA and diffusion coefficient of EcMutS–EcMutL–EcMutH and/or EcMutL–EcMutH complex.
a, A schematic illustration of EcMutH endonuclease assay (left) and a comparison of labelled or unlabelled EcMutH endonuclease activities (right). For gel source data, see Supplementary Fig. 1. b, c, Representative kymographs and dwell times (mean ± s.e.m.) showing EcMutH on a single mismatched DNA under various ionic and magnesium conditions. d–g, The distributions of dwell times (mean ± s.e.m.) for EcMutH on a single mismatched DNA at different biochemical conditions as indicated. h, Box plots showing D for oscillating (EcMutS)–EcMutLCy3–EcMutHAF647 ((S)–L–H) complex; the established EcMutSAF555–EcMutL–EcMutHAF647 complex (S–L–H); and free EcMutLCy3–EcMutHAF647 complex (L–H) at 100 mM NaCl. i, Box plots showing D for established EcMutS–EcMutL–EcMutH complex at different NaCl concentrations. Two-sample t-test showed no significant difference between diffusion coefficients (P > 0.1). j, Box plots showing D for free EcMutL–EcMutH complex at different NaCl concentrations. Two-sample t-test showed significant differences between diffusion coefficients (P < 0.05). k, Top left, representative kymographs showing FRET between C-terminal AF555-labelled EcMutS and N-terminal AF647-labelled EcMutL (N-ter). Bottom, fluorescent intensities of EcMutS–AF555 (donor, green), EcMutL–AF647 (acceptor, red) and FRET (blue) between them when only the green laser was used for illumination. Right, a schematic illustration of kymographs. Experimental FRET measure (EEcMutS–EcMutL = 0.48 ± 0.05; mean ± s.d.) and theoretical FRET (EEcMutS–EcMutL = 0.56) based on crosslink structure22 appeared comparable. n = number of molecules throughout.
Extended Data Figure 6. The interactions and kinetic properties of the molecular switch/sliding clamp mechanism for E. coli MMR.
a, Illustration of the kinetics and diffusion properties of EcMutS. b, Illustration of the kinetics and diffusion of EcMutS with EcMutL. c, Illustration of the kinetics and diffusion of EcMutS, EcMutL and EcMutH. d, Oscillation dynamics of the EcMutS–EcMutL–EcMutH complex (see main text). Coil, 1D-diffusion search along the backbone; dashed straight arrow, rotation-independent 1D-diffusion; black curved arrow, binding; red curved arrow, oscillating complex; dashed curved arrow, binding-dissociation; binding times and ATP (•) are indicated.
Extended Data Table 1.
The oligonucleotides and fluorophore-labelled MMR proteins used in these studies
| Name* | Sequences |
|---|---|
| EcMutL(R95F) for | GCCATTATCAGCCTGGGCTTTTTCGGTGAGGCGCTGGCGAGTATC |
| EcMutL(R95F) rev | GATACTCGCCAGCGCCTCACCGAAAAAGCCCAGGCTGATAATGGC |
| EcMutL(N-ter) for | GGAGGCCATATGCTCTGCACACCGTCGCGTGGAGGGCATCACCATCACCATCATTCATCAATGCCAA TTCAGGTCTTACC |
| EcMutL(N-ter) rev | TCCGCCCTCGAGTTACTCATCTTTCAGGGCTTTTATCG |
| Lambda mismatch 1 | Phos-GGGCGGCGACCTGCTTAGGATCATCGAGGATCGACGTCGGTGCAATTCAGCGGACTAGTCC |
| Lambda mismatch 2 | AGGTCGCCGCCCGGACTAGTCCGCTGAATTGCACCGACGTTGATCCTCGATGATCCTAAGC |
| Lambda linker 1 | Phos-TTCTTGGAGTCCCCTGCAGCGATTAATACGACTAGAGC |
| Lambda linker 2 | Biotin-GCTCTAGTCGTATTAATCGCTGCAGGGGACTCCA |
| Lambda linker 3 | Phos-CGCTTAGTGCTATGATGCGTTCGATCACTCCATGTGATC |
| Lambda linker 4 | Biotin-GATCACATGGAGTGATCGAACGCATCATAGCACTA |
| EcMutH for1 | AGGGCATCACCATCACCATCATTCATCAATGTCCCAACCTCGCCCA |
| EcMutH for2 | GGAGGCCATATGCTCTGCACACCGTCGCGTGGAGGGCATCACCATCACCA |
| EcMutH rev | GGAGGCGGATCCCTACTGGATCAGAAAATGAC |
| Protein† | Labelled monomer | Unlabelled dimer | Dimer with a single fluorophore |
Dimer with two fluorophores |
|---|---|---|---|---|
| AF647 labelled EcMutS | 26% | 55% | 38% | 7% |
| Cy3 labelled EcMutL | 18% | 67% | 30% | 3% |
| Cy3 labelled EcMutL(R95F) | 16% | 71% | 26% | 3% |
| AF647 labelled EcMutH | 50% | N/A | N/A | N/A |
Oligonucleotides used in these studies.
Fluorophore-labelling efficiencies of MMR proteins used in these studies.
Extended Data Table 2.
Cellular complementation and mutation rates of MMR proteins
| Strain | MMR proteins in expression plasmids* |
Genotype | Mutation rates† (per 109 cells) |
Range (per 109 cells) |
|---|---|---|---|---|
| MG 1655 | - | wild type | 5.2 | 1.8–9.0 |
| MG 1655 ΔmutS | - | mutS− | 522.0 | 334.9–860.8 |
| MG 1655 ΔmutS | EcMutS (D835R, R840E)-his6-ald6 | MutS-(D835R, R840E) | 1.2 | 0.4–12.9 |
| MG 1655 ΔmutL | - | mutL− | 1004.9 | 572.2–3481.1 |
| MG 1655 ΔmutL | EcMutL-hiS6-ald6 | MutL+ | 6.3 | 0.4–9.5 |
| MG 1655 ΔmutL | EcMutL (R95F)-his6-ald6 | MutL (R95F) | 702.3 | 29.5–1981.3 |
| MG 1655 ΔmutL | ald6-his6-EcMutL | MutL+ | 0.8 | 0.4–1.2 |
| MG 1655 ΔmutH | - | mutH− | 100.2 | 77.8–371.9 |
| MG 1655 ΔmutH | ald6-his6-EcMutH | MutH+ | 3.3 | 1.2–5.7 |
Amino acid substitutions are indicated in parenthesis; the arrangement of the hexa-histidine (his6) and formylglycine-generating enzyme (ald6) recognition sequence relative to the N terminus (beginning) or C terminus (end) of the MMR gene.
The median mutation rates are reported.
Extended Data Table 3.
The frequency of particle varieties observed by single-molecule analysis
| Proteins | Diffusion | Co-localize with stained DNA |
Ratio | Number of molecules |
|
|---|---|---|---|---|---|
| EcMutS only | + | + | 88% | 93% | 56 |
| + | −* | 5% | |||
| −† | + | 7% | |||
|
| |||||
| EcMutS-EcMutL complex | + | + | 69% | 80% | 54 |
| + | −* | 11% | |||
| − | + | 4% | |||
| − | − | 16% | |||
|
| |||||
| EcMutS-EcMutL (R95F) complex | + | + | 76% | 85% | 46 |
| + | −* | 9% | |||
| − | + | 4% | |||
| − | − | 11% | |||
|
| |||||
| EcMutL-EcMutH complex | + | + | 80% | 89% | 95 |
| + | −* | 9% | |||
| − | + | 1% | |||
| − | − | 10% | |||
The DNA was probably broken during staining.
Immobile particles bound near the mismatch.
Extended Data Table 4.
Diffusion coefficients
| Protein conformation | [NaCI] (mM) | Mean ± S.D. (10−3 µm2s−1) |
|---|---|---|
| EcMutS sliding clamp | 100 | 43 ± 16 |
|
| ||
| EcMutS-EcMutL complex | 50 | 4±2 |
| 75 | 4±3 | |
| 100 | 4±2 | |
| 125 | 5±3 | |
| 150 | 5±3 | |
|
| ||
| Fast diffusing EcMutL | 25 | 453 ± 311 |
| 100 | 888 ± 393 | |
| 150 | 1716 ±623 | |
| 200 | 2220 ± 778 | |
|
| ||
| EcMutS-EcMutL(R95F) complex | 100 | 3±2 |
|
| ||
| (EcMutS)-EcMutL-EcMutH* | 100 | 10±10† |
|
| ||
| EcMutS-EcMutL-EcMutH‡ | 50 | 4±2 |
| 75 | 5±3 | |
| 100 | 5±3 | |
|
| ||
| Free EcMutL-EcMutH complex§ | 50 | 24 ±23 |
| 100 | 41 ± 34∥ | |
| 150 | 118 ±151 | |
Oscillating complexes potentially containing unlabelled EcMutS (EcMutS) with co-localized EcMutL-Cy3 and EcMutH-AF647.
A two-sample t-test suggests a significant difference (P=0.001) in diffusion coefficient between the EcMutS-EcMutL complex and (EcMutS)-EcMutL-EcMutH at 100 mM NaCl.
Complexes containing co-localized EcMutS-AF555, unlabelled EcMutL and EcMutH-AF647.
See Methods.
A two-sample t-test suggests a significant difference (P<0.0001) in diffusion coefficient between the free EcMutL-EcMutH complex and (EcMutS)-EcMutL-EcMutH at 100 mM NaCl.
Supplementary Material
Acknowledgments
We would like to thank C. Bell and our laboratory colleagues for many helpful insights and discussions. This work was supported by NRF of Korea Grant No. 2011-001309 (J.-B.L) and NIH grant CA67007 (R.F.).
Footnotes
Supplementary Information is available in the online version of the paper.
Author Contributions J.L., J.H., J.-B.L. and R.F. designed the experiments; B.M.B., and J.B., performed genetic analysis; J.L. purified and labelled the proteins; J.L. and J.H. performed the single-molecule studies; J.L., J.H., J.-B.L. and R.F. analysed the data; D.K. developed the Matlab script for diffusion analysis and particle co-localization. J.L., J.H., J.-B.L. and R.F. wrote the paper and all authors participated in critical discussions.
The authors declare no competing financial interests.
References
- 1.Fishel R. Mismatch repair. J. Biol. Chem. 2015;290:26395–26403. doi: 10.1074/jbc.R115.660142. [DOI] [PMC free article] [PubMed] [Google Scholar]
- 2.Wang JY, Edelmann W. Mismatch repair proteins as sensors of alkylation DNA damage. Cancer Cell. 2006;9:417–418. doi: 10.1016/j.ccr.2006.05.013. [DOI] [PubMed] [Google Scholar]
- 3.Martín-López JV, Fishel R. The mechanism of mismatch repair and the functional analysis of mismatch repair defects in Lynch syndrome. Fam. Cancer. 2013;12:159–168. doi: 10.1007/s10689-013-9635-x. [DOI] [PMC free article] [PubMed] [Google Scholar]
- 4.Ghodgaonkar MM, et al. Ribonucleotides misincorporated into DNA act as strand-discrimination signals in eukaryotic mismatch repair. Mol. Cell. 2013;50:323–332. doi: 10.1016/j.molcel.2013.03.019. [DOI] [PMC free article] [PubMed] [Google Scholar]
- 5.Kawasoe Y, Tsurimoto T, Nakagawa T, Masukata H, Takahashi TS. MutSα maintains the mismatch repair capability by inhibiting PCNA unloading. eLife. 2016;5:e15155. doi: 10.7554/eLife.15155. [DOI] [PMC free article] [PubMed] [Google Scholar]
- 6.Lujan SA, Williams JS, Clausen AR, Clark AB, Kunkel TA. Ribonucleotides are signals for mismatch repair of leading-strand replication errors. Mol. Cell. 2013;50:437–443. doi: 10.1016/j.molcel.2013.03.017. [DOI] [PMC free article] [PubMed] [Google Scholar]
- 7.Putnam CD. Evolution of the methyl directed mismatch repair system in Escherichia coli . DNA Repair (Amst.) 2016;38:32–41. doi: 10.1016/j.dnarep.2015.11.016. [DOI] [PMC free article] [PubMed] [Google Scholar]
- 8.Kolodner RD, Mendillo ML, Putnam CD. Coupling distant sites in DNA during DNA mismatch repair. Proc. Natl Acad. Sci. USA. 2007;104:12953–12954. doi: 10.1073/pnas.0705698104. [DOI] [PMC free article] [PubMed] [Google Scholar]
- 9.Qiu R, et al. MutL traps MutS at a DNA mismatch. Proc. Natl Acad. Sci. USA. 2015;112:10914–10919. doi: 10.1073/pnas.1505655112. [DOI] [PMC free article] [PubMed] [Google Scholar]
- 10.Cho WK, et al. ATP alters the diffusion mechanics of MutS on mismatched DNA. Structure. 2012;20:1264–1274. doi: 10.1016/j.str.2012.04.017. [DOI] [PMC free article] [PubMed] [Google Scholar]
- 11.Gorman J, et al. Single-molecule imaging reveals target-search mechanisms during DNA mismatch repair. Proc. Natl Acad. Sci. USA. 2012;109:E3074–E3083. doi: 10.1073/pnas.1211364109. [DOI] [PMC free article] [PubMed] [Google Scholar]
- 12.Jeon Y, et al. Dynamic control of strand excision during human DNA mismatch repair. Proc. Natl Acad. Sci. USA. 2016;113:3281–3286. doi: 10.1073/pnas.1523748113. [DOI] [PMC free article] [PubMed] [Google Scholar]
- 13.Jeong C, et al. MutS switches between two fundamentally distinct clamps during mismatch repair. Nat. Struct. Mol. Biol. 2011;18:379–385. doi: 10.1038/nsmb.2009. [DOI] [PMC free article] [PubMed] [Google Scholar]
- 14.Kunkel TA. Celebrating DNA’s repair crew. Cell. 2015;163:1301–1303. doi: 10.1016/j.cell.2015.11.028. [DOI] [PubMed] [Google Scholar]
- 15.Modrich P. Mechanisms and biological effects of mismatch repair. Annu. Rev. Genet. 1991;25:229–253. doi: 10.1146/annurev.ge.25.120191.001305. [DOI] [PubMed] [Google Scholar]
- 16.Liu J, et al. An efficient site-specific method for irreversible covalent labeling of proteins with a fluorophore. Sci. Rep. 2015;5:16883. doi: 10.1038/srep16883. [DOI] [PMC free article] [PubMed] [Google Scholar]
- 17.Heinen CD, et al. Human MSH2 (hMSH2) protein controls ATP processing by hMSH2-hMSH6. J. Biol. Chem. 2011;286:40287–40295. doi: 10.1074/jbc.M111.297523. [DOI] [PMC free article] [PubMed] [Google Scholar]
- 18.Acharya S, Foster PL, Brooks P, Fishel R. The coordinated functions of the E. coli MutS and MutL proteins in mismatch repair. Mol. Cell. 2003;12:233–246. doi: 10.1016/s1097-2765(03)00219-3. [DOI] [PubMed] [Google Scholar]
- 19.Gradia S, et al. hMSH2-hMSH6 forms a hydrolysis-independent sliding clamp on mismatched DNA. Mol. Cell. 1999;3:255–261. doi: 10.1016/s1097-2765(00)80316-0. [DOI] [PubMed] [Google Scholar]
- 20.Gorman J, Plys AJ, Visnapuu ML, Alani E, Greene EC. Visualizing one-dimensional diffusion of eukaryotic DNA repair factors along a chromatin lattice. Nat. Struct. Mol. Biol. 2010;17:932–938. doi: 10.1038/nsmb.1858. [DOI] [PMC free article] [PubMed] [Google Scholar]
- 21.Berg OG, von Hippel PH. Selection of DNA binding sites by regulatory proteins. Statistical-mechanical theory and application to operators and promoters. J. Mol. Biol. 1987;193:723–750. doi: 10.1016/0022-2836(87)90354-8. [DOI] [PubMed] [Google Scholar]
- 22.Groothuizen FS, et al. MutS/MutL crystal structure reveals that the MutS sliding clamp loads MutL onto DNA. eLife. 2015;4:e06744. doi: 10.7554/eLife.06744. [DOI] [PMC free article] [PubMed] [Google Scholar]
- 23.Blainey PC, et al. Nonspecifically bound proteins spin while diffusing along DNA. Nat. Struct. Mol. Biol. 2009;16:1224–1229. doi: 10.1038/nsmb.1716. [DOI] [PMC free article] [PubMed] [Google Scholar]
- 24.Ban C, Junop M, Yang W. Transformation of MutL by ATP binding and hydrolysis: a switch in DNA mismatch repair. Cell. 1999;97:85–97. doi: 10.1016/s0092-8674(00)80717-5. [DOI] [PubMed] [Google Scholar]
- 25.Lamers MH, Winterwerp HH, Sixma TK. The alternating ATPase domains of MutS control DNA mismatch repair. EMBO J. 2003;22:746–756. doi: 10.1093/emboj/cdg064. [DOI] [PMC free article] [PubMed] [Google Scholar]
- 26.Lee JY, et al. MutH complexed with hemi- and unmethylated DNAs: coupling base recognition and DNA cleavage. Mol. Cell. 2005;20:155–166. doi: 10.1016/j.molcel.2005.08.019. [DOI] [PubMed] [Google Scholar]
- 27.Feng G, Tsui HC, Winkler ME. Depletion of the cellular amounts of the MutS and MutH methyl-directed mismatch repair proteins in stationary-phase Escherichia coli K-12 cells. J. Bacteriol. 1996;178:2388–2396. doi: 10.1128/jb.178.8.2388-2396.1996. [DOI] [PMC free article] [PubMed] [Google Scholar]
- 28.Hall MC, Matson SW. The Escherichia coli MutL protein physically interacts with MutH and stimulates the MutH-associated endonuclease activity. J. Biol. Chem. 1999;274:1306–1312. doi: 10.1074/jbc.274.3.1306. [DOI] [PubMed] [Google Scholar]
- 29.Fishel R. Mismatch repair, molecular switches, and signal transduction. Genes Dev. 1998;12:2096–2101. doi: 10.1101/gad.12.14.2096. [DOI] [PubMed] [Google Scholar]
- 30.Gradia S, Acharya S, Fishel R. The human mismatch recognition complex hMSH2-hMSH6 functions as a novel molecular switch. Cell. 1997;91:995–1005. doi: 10.1016/s0092-8674(00)80490-0. [DOI] [PubMed] [Google Scholar]
- 31.Sacho EJ, Kadyrov FA, Modrich P, Kunkel TA, Erie DA. Direct visualization of asymmetric adenine-nucleotide-induced conformational changes in MutLα. Mol. Cell. 2008;29:112–121. doi: 10.1016/j.molcel.2007.10.030. [DOI] [PMC free article] [PubMed] [Google Scholar]
- 32.Hombauer H, Campbell CS, Smith CE, Desai A, Kolodner RD. Visualization of eukaryotic DNA mismatch repair reveals distinct recognition and repair intermediates. Cell. 2011;147:1040–1053. doi: 10.1016/j.cell.2011.10.025. [DOI] [PMC free article] [PubMed] [Google Scholar]
- 33.Senavirathne G, et al. Widespread nuclease contamination in commonly used oxygen-scavenging systems. Nat. Methods. 2015;12:901–902. doi: 10.1038/nmeth.3588. [DOI] [PMC free article] [PubMed] [Google Scholar]
- 34.Mendillo ML, Putnam CD, Kolodner RD. Escherichia coli MutS tetramerization domain structure reveals that stable dimers but not tetramers are essential for DNA mismatch repair in vivo. J. Biol. Chem. 2007;282:16345–16354. doi: 10.1074/jbc.M700858200. [DOI] [PubMed] [Google Scholar]
- 35.Edelstein A, Amodaj N, Hoover K, Vale R, Stuurman N. Computer control of microscopes using microManager. Curr. Protoc. Mol. Biol. 2010 doi: 10.1002/0471142727.mb1420s92. Chapter 14, Unit14.20. [DOI] [PMC free article] [PubMed] [Google Scholar]
- 36.Jones ND, et al. Retroviral intasomes search for a target DNA by 1D diffusion which rarely results in integration. Nat. Commun. 2016;7:11409. doi: 10.1038/ncomms11409. [DOI] [PMC free article] [PubMed] [Google Scholar]
- 37.Qian H, Kou SC. Statistics and related topics in single-molecule biophysics. Annu. Rev. Stat. Appl. 2014;1:465–492. doi: 10.1146/annurev-statistics-022513-115535. [DOI] [PMC free article] [PubMed] [Google Scholar]
- 38.Wycuff DR, Matthews KS. Generation of an AraC-araBAD promoter-regulated T7 expression system. Anal. Biochem. 2000;277:67–73. doi: 10.1006/abio.1999.4385. [DOI] [PubMed] [Google Scholar]
- 39.Lea DE, Coulson CA. The distribution of the numbers of mutants in bacterial populations. J. Genet. 1949;49:264–285. doi: 10.1007/BF02986080. [DOI] [PubMed] [Google Scholar]
- 40.Guarné A, et al. Structure of the MutL C-terminal domain: a model of intact MutL and its roles in mismatch repair. EMBO J. 2004;23:4134–4145. doi: 10.1038/sj.emboj.7600412. [DOI] [PMC free article] [PubMed] [Google Scholar]
Associated Data
This section collects any data citations, data availability statements, or supplementary materials included in this article.
Supplementary Materials
Data Availability Statement
The data that support the findings of this study are available from the authors upon reasonable request.


