

Abstract
Background
Compared to high-income countries (HICs), Sub-Saharan African (SSA) countries experience a comparatively higher early mortality from stroke. However, data on long-term mortality from stroke in SSA are lacking.
Objective
Our aim is to assess long-term outcomes of stroke in a SSA setting.
Methods
We conducted a retrospective analysis of longitudinal data involving 607 consecutive stroke survivor encountered at an out-patient clinic in Kumasi, Ghana between January 2012 and June 2014. Data were closed for analysis in June 2016. Data on demography, presence of vascular risk factors, stroke type and functional status were evaluated. We followed up subjects who were no longer attending clinic by phone to assess their vital status. Primary outcome was death after initiation of clinic care, and its predictors were determined using a Cox proportional hazards regression model.
Results
Mean ± SD age of cohort was 59.9 ± 13.9 years and 50.3% were females. Of the 607 stroke survivors, 377 (62.1%) were still alive, 59 (9.7%) were confirmed to have died while 171 (28.2%) were lost to follow-up at the clinic. Mean ± SD observation time for the cohort was 32 ± 30 months. Upon adjustment for confounders the independent predictors of mortality were age: aHR of 1.41 (95%CI, 1.15–1.73) for 10 years increase in age and diabetes mellitus: aHR of 2.24 (1.32–3.80).
Conclusion
Diabetes mellitus, a modifiable risk factor for stroke is associated with an increased risk for mortality among West African stroke survivors over the long-term.
Keywords: Diabetes mellitus, Ghana, long-term outcomes, stroke, survival
INTRODUCTION
More than four-fifths of the global burden of stroke is borne by populations living in Low-and-Middle Income countries (LMICs) to which all countries in sub-Saharan Africa (SSA) belong. (1–3) In these regions, stroke is characterized by a younger age of onset and is associated with high mortality rates in the immediate post-stroke period (4,5). The current surge in stroke burden in these settings is the result of rapid urbanization and adoption of western lifestyles culminating in high rates of vascular risk factors, cardinal of which are hypertension, diabetes mellitus, dyslipidemia and obesity. (6) Short-term mortality rates of stroke usually measured at 30-days post-stroke onset has been reported and its predictors have been characterized in SSA but there is a dearth of data on the predictors of long-term outcomes of stroke survivors on the continent.
Community-based studies on the trajectory of stroke survival would be ideal to assess long-term outcomes of strokes, however such studies are difficult to implement in LMICs. One such prospective community-based study involving 130 stroke cases in Tanzania reported case fatality rates at 28-days of 23.8%, 3-years at 60.0% and 7–10 years of 82.3%. (7–9) In another community-based study in Lagos state, Nigeria involving 160 stroke cases, 30-day mortality was reported at 16.2%. (10) The remainder of such studies has been hospital based with short-to-medium term follow up (11–14). For instance, among 200 hospitalized South African ischemic stroke subjects followed up for 12 months, case fatality was reported to be 38% (11) similar to a report from Maputo, Mozambique (12). All the cited studies did identify markers of stroke severity and age as independent predictors of stroke (7–14). However, the hospital-based studies have had short-to-medium term follow up periods and indeed none of the studies have evaluated the associations between vascular risk factors and long-term outcomes of stroke survivors under routine care settings.
A key guideline recommendation in prevention of adverse outcomes after stroke is vascular risk factor control which should be implemented early and monitored rigorously to prevent stroke recurrence and other CVD events (15). It is not clear from literature which cardiovascular risk factors are associated with poor post-stroke outcomes among African stroke survivors. This information is needed in order to craft culturally tailored interventions that would inform practice and help plan for resource allocation for stroke care which is predicted to burgeon over the next few decades. This study aims to present data on all-cause mortality and its determinants among 607 stroke survivors who enrolled into the Neurology clinic in Kumasi between 2011 and 2014. All-cause mortality was ascertained through verbal autopsies obtained from relatives of stroke survivors or medically certified deaths.
METHODS
Study Settings
This retrospective study was approved by the Committee on Human Research Publication and Ethics (CHRPE) of the Kwame Nkrumah University of Science and Technology. The study was conducted at the Neurology Clinic of the Komfo Anokye Teaching Hospital (KATH) in Kumasi, Ghana. Situated in the middle belt of Ghana, the KATH neurology clinic was established in 2011 to serve an estimated population of 15 million Ghanaians and receives referrals from 6 out of the 10 administrative regions of the country. (16) Approximately, 65% of all patients in the Neurology Clinic are stroke survivors. (16) Stroke survivors are referred to the neurology clinic upon discharge from the ward as in-patients or from surrounding hospitals and clinics for follow-up care with a focus on secondary prevention and rehabilitation. At enrollment into the clinic, patient charts from in-patient are used at the neurology clinic for follow-up. Typically stroke patients are scheduled for follow-up visits on months 1, 3, 6 and 12 with non-scheduled visits where necessary within the first year of enrollment. In subsequent years, follow-up visits to clinics are longer typically every 6 months.
Data Collection
Data was collected onto a questionnaire designed for the present analysis by a medical officer (GK). Variables collected included age, gender, marital status, occupation, religion, type of stroke, functional status of stroke survivors assessed using the Modified Rankin Scale, blood pressure measurements on admission and discharge as in-patients and vascular risk factors. The following vascular risk factors were collected from patient folders: hypertension, diabetes mellitus, dyslipidemia, cigarette smoking history, alcohol use, and history of cardiac disease. Stroke types were determined based on cranial CT scans performed within 10 days post-stroke. The following definitions were used for vascular risk factors:
-
□
Hypertension: A blood pressure cutoff of ≥140/90 mmHg for up to 72 hours after stroke, a history of hypertension, or use of antihypertensive drugs before stroke were regarded as indicators of hypertension.
-
□
Diabetes mellitus was defined based on history of diabetes mellitus, use of medications for diabetes mellitus, an HBA1C >6.5% or a fasting blood glucose (FBG) levels > 7.0mmol/l measured after the post-acute phase due to the known acute transient elevation of glucose as a stress response after stroke. (17)
-
□
Dyslipidemia was defined as total cholesterol of ≥5.2mmol/L, high-density lipoprotein (HDL) cholesterol ≤1.03mmol/l, triglycerides (TGL) ≥ 1.7mmol/l or Low-density lipoprotein (LDL) ≥ 3.4mmol/l or use of statin prior to stroke onset. (18)
-
□
Cigarette smoking: Smoking status was defined as current smoker (individuals who smoked any tobacco in the past 12 months) or never/former smoker. (19)
-
□
Alcohol use: Alcohol use was categorized into current users (users of any form of alcoholic drinks) or never/former drinker.
-
□
Cardiac disease: Cardiac disease was defined based on a history or current diagnosis of atrial fibrillation, cardiomyopathy, heart failure, ischemic heart disease, rheumatic heart disease after evaluation using ECG and echocardiography.
Follow-up
The present analysis involves 607 consecutive stroke survivors who enrolled into the Neurology clinic between January 2012 to June 2014 and data was closed for analysis in June 2016. The database was closed at June 2016 to allow for at least 24-months follow-up for the last subject who enrolled into the clinic in June 2014. During the last visit in June 2016, we assessed functional status of all clinic attendants using the Modified Rankin Scale (20). A subset of stroke survivors who were lost to follow-up with telephone contacts were called to ascertain their status as either dead or alive as well as their functional status. We used the following definitions for the vital status of study participants.
Loss-to-follow up: Any subject who had defaulted a clinic visit for more than 12 months before data was closed for analysis. Stroke survivors who could not be contacted were included as loss-to-follow up.
Death was ascertained by verbal autopsy from a relative of stroke survivor. A verbal autopsy is a method of gathering health information about a deceased individual to determine his or her cause of death. Descriptions of events prior to death were acquired via interviews with a relative familiar with the deceased and were analyzed by FSS and SA to assign a probable cause of death. Time to death was calculated between the date of onset of stroke and date of demise.
Attrition from care was defined as a combination of confirmed deaths and loss-to-follow up.
Recurrent strokes were confirmed using cranial CT scans for patients who had new onset of neurological symptoms of sudden onset or worsening of symptoms. This could only be performed among patients who presented to the teaching hospital where a CT scan is available.
Statistical Analysis
Means and medians were compared using the Student’s t-test or Mann-Whitney’s U-test for paired comparisons and Analysis of variance or Kruskal Wallis tests for more than 2 group comparisons were used. Proportions were compared using the Chi-squared test. Kaplan-Meier survival plots were constructed to assess proportions of subjects under follow-up with observations censored at month 36. Collinearity of variables was assessed by visual inspection of survival curves. Cox Proportional Hazards regression model was employed to assess the determinants of deaths during follow-up. In this model, variables such as age, gender, stroke type (ischemic, hemorrhagic, not-typed), systolic blood pressure at enrollment, vascular risk factors and functional status of stroke survivors were selected as independent variables to be tested in the model based on their known associations with poor stroke outcomes. In bivariate analysis, factors associated with the dependent variable at a p-value level of 0.10 were included in the multivariable model. In our primary outcome analysis, subjects who were lost to follow up were excluded from our analysis. However, sensitivity analyses were also performed which included subjects who were lost-to-follow up with an assumption of lost=dead or lost=alive. In all analysis, two-tailed p-values <0.05 were considered statistically significant with no adjustments for multiple comparisons. Statistical analysis was performed using SPSS version 19.
RESULTS
Demographic characteristics according to vital status of stroke survivors
Of the cohort of 607 stroke survivors, 377 (62.1%) were still alive, 59 (9.7%) were confirmed to have died while 171 (28.2%) were lost to follow-up at the clinic and their vital status could not be ascertained. Out of the 377 subjects who were alive, 314 were still attending the neurology clinic at closure of data for analysis but 63 had stopped clinic attendance. Among the 63 subjects who had stopped attending the neurology clinic, 29 were not on any treatment at home, 14 had enrolled for care at a primary health care post, 11 were on herbal/alternative medicines and 9 had relocated or travelled. The mean ± SD observation time for the cohort was 32 ± 30 months.
The mean ± SD age of occurrence of index stroke among stroke subjects who subsequently died after enrolling for care at the neurology clinic was significantly higher being 65.5 ± 12.1 years compared with those still alive- 58.1 ± 13.0 years, p<0.0001. Those who died were less likely to be gainfully employed at stroke onset compared with those alive. The three groups were comparable in their vascular risk factor profiles with the notable exception of diabetes mellitus which was significantly commoner among subjects who died at a frequency of 39% compared with 18.8% and 18.1% among those alive and lost-to-follow up respectively. (Table 1)
Table 1.
Comparison of baseline demographic and clinical characteristics of stroke survivors according to vital status.
| Alive N= 377 (62.1%) |
Lost-to-follow-up N=171 (28.2%) |
Dead N= 59 (9.7%) |
||
|---|---|---|---|---|
| Age, mean ± SD | 58.1 ± 13.0 | 62.1 ± 14.7 | 65.6 ± 12.1 | <0.0001 |
| Male gender, n (%) | 190 (50.4) | 83 (48.5) | 28 (47.5) | 0.87 |
| Marital Status | 0.24 | |||
| Married | 180 (47.7) | 77 (45.0) | 23 (39.0) | |
| Single/widow | 64 (17.0) | 38 (22.2) | 15 (25.4) | |
| Divorced | 18 (4.8) | 12 (7.0) | 6 (10.2) | |
| No data available | 116 (30.5) | 42 (25.7) | 15 (25.4) | |
| Employment status before stroke | 0.0001 | |||
| Employed | 212 (56.2) | 88 (51.5) | 26 (44.1) | |
| Unemployed | 60 (15.9) | 26 (15.2) | 8 (13.6) | |
| Retired | 45 (11.9) | 22 (12.9) | 21 (35.6) | |
| Data not available | 60 (15.9) | 34 (20.5) | 3 (6.8) | |
| Vascular risk factors | ||||
| Hypertension | 337 (89.4) | 149 (87.1) | 57 (96.6) | 0.12 |
| Diabetes Mellitus | 71 (18.8) | 31 (18.1) | 23 (39.0) | 0.001 |
| Dyslipidemia* | 113/238 (47.5) | 39/97(40.2) | 14/34 (41.2) | 0.43 |
| Alcohol use | 56 (14.9) | 24 (14.0) | 8 (13.6) | 0.95 |
| Cigarette smoking | 16 (4.2) | 4 (2.3) | 2 (3.4) | 0.54 |
| Cardiac disease | 3 (0.8) | 3 (1.8) | 1 (1.7) | 0.57 |
| Stroke type | 0.98 | |||
| Ischemic | 152 (40.3) | 71 (41.5) | 26 (44.1) | |
| Hemorrhagic | 70 (18.6) | 32 (18.7) | 11 (18.6) | |
| Untyped | 155 (41.1) | 68 (39.8) | 22 (39.8) | |
| Modified Rankin score at discharge, mean ± SD | 2.7 ± 1.7 | 2.8 ± 1.6 | 3.0 ± 1.6 | 0.57 |
| Duration of follow up (in months) at time of censoring data, mean ± SD | 44.5 ± 27.4 | 10.4 ± 10.4 | 7.5 ± 9.2 | <0.0001 |
Figure 1 shows the survival plots of stroke survivors after enrolling into the clinic. Mortality rates at 12, 24, and 36 months were 9.3%, 11.5% and 14.1% respectively using estimates from Kaplan-Meier curves. Attrition from care which is a composite of deaths and loss-to-follow up from clinic was 45.8% at month 12, 59.2% at month 24 and 68.3% at month 36.
Figure 1.
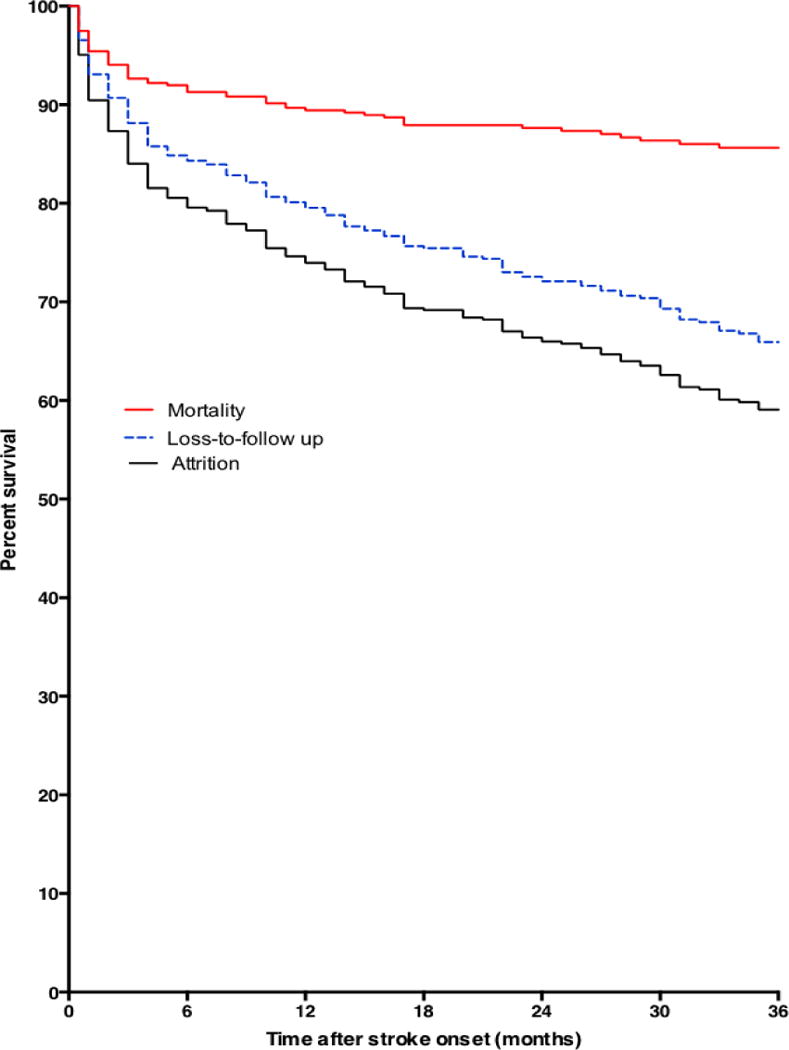
Kaplan Meier curves showing proportions dead, lost-to-follow up and attrition from care after enrolling into care at a Neurology clinic after surviving a stroke.
Causes of death
There were 59 confirmed deaths in the cohort. Most deaths occurred at home hence direct cause of death could be verified by medical death certificate for 17 (28.8%) subjects. Of these certified deaths, 12 were from recurrent strokes, 2 from hyperglycemic hyperosmolar syndrome, 1 each from status epilepticus, aspiration pneumonia and end-stage chronic kidney disease. Relatives were not able to provide exact cause of death for the remainder but indicated that most subjects may have died from complications from index stroke.
Predictors of all-cause mortality
On bivariate analysis, increasing age and diabetes mellitus were significantly associated with all-cause mortality among stroke survivors in the clinic (Figures 2 & 3). In primary analysis where subjects lost to follow-up were excluded, we found upon adjustment for confounders that the adjusted HR (95%) for age was 1.41 (1.15–1.73) for 10 years increase in age and diabetes mellitus was 2.24 (1.32–3.80). Upon adjustment for age, adjusted HR for mortality among women with diabetes was 2.43 (1.19–4.95), p=0.01 and for men was 2.40 (1.09–5.28), p=0.03. Furthermore, adjusted HR for mortality among ischemic stroke survivors with diabetes was 2.83 (1.31–6.12), for hemorrhagic stroke survivors was 2.49 (0.50–12.40) and for undetermined was 2.07 (0.84–5.11). In sensitivity analysis where lost-to-follow up was assumed to be = alive, age and diabetes mellitus were still significantly associated with risk of mortality but the association with diabetes was lost in another sensitivity analysis where lost-to-follow up was assumed to be = dead (Table 3). The HR (95% CI) of mortality for use of statin among diabetic patients was 0.65 (0.23–1.86), p=0.43.
Figure 2.
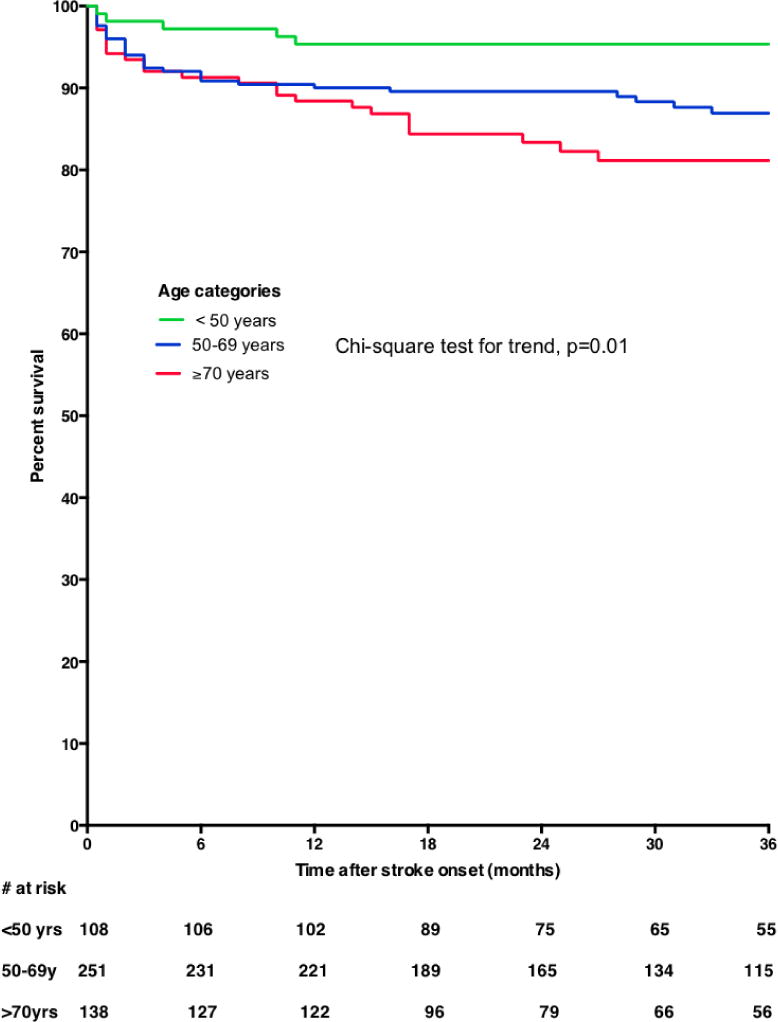
Kaplan Meier survival plots showing all-cause mortality curves according to age categories of stroke survivors
Figure 3.
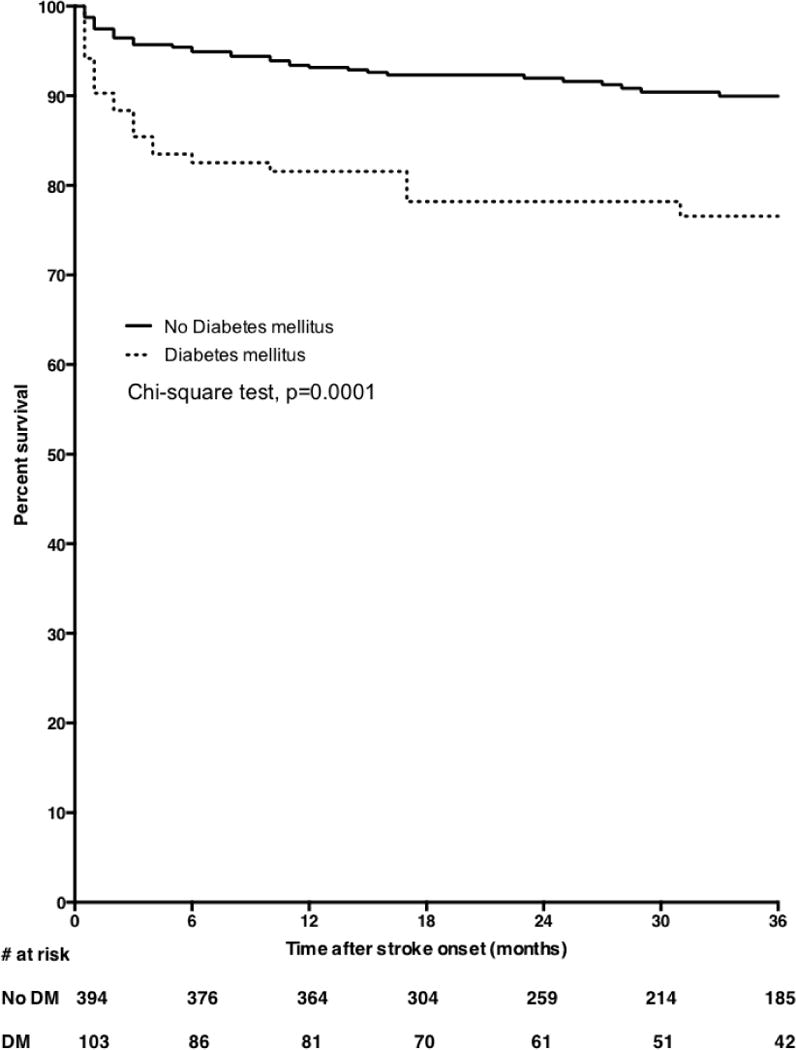
Kaplan Meier survival plots showing all-cause mortality curves according to diabetes mellitus status of stroke survivors
Table 3.
Predictors of all cause mortality among Ghanaian stroke survivors (Sensitivity analyses)
| Loss-to-follow-up = Alive
|
Loss-to-follow = Death
|
|||||||
|---|---|---|---|---|---|---|---|---|
| Predictor | Unadjusted HR (95% CI) |
P-value | Adjusted HR (95% CI) |
P-value | Unadjusted HR (95% CI) | P-value | Adjusted HR (95% CI) |
P-value |
| Age | ||||||||
| Age, each 10 year increase | 1.46 (1.21–1.77) | 0.0001 | 1.42 (1.17–1.73) | 0.0005 | 1.24 (1.12–1.36) | <0.0001 | 1.23 (1.11–1.36) | <0.0001 |
| Gender | ||||||||
| Female | 1.12 (0.68–1.83) | 0.66 | – | – | 1.09 (0.85–1.42) | 0.49 | – | – |
| Stroke type | ||||||||
| Hemorrhagic | 0.82 (0.41–1.65) | 0.58 | – | – | 0.97 (0.68–1.39) | 0.86 | – | – |
| Untyped | 0.74 (0.43–1.29) | 0.29 | 0.84 (0.63–1.12) | 0.23 | ||||
| Ischemic | 1.00 | 1.00 | ||||||
| Hypertension | 3.54 (0.87–14.50) | 0.08 | 2.75 (0.67–11.30) | 0.16 | 1.00 (0.65–1.53) | 1.00 | – | – |
| Diabetes Mellitus | 2.96 (1.79–4.89) | <0.0001 | 2.48 (1.50–4.12) | 0.0004 | 1.31 (0.96–1.77) | 0.09 | 1.21 (0.89–1.64) | 0.23 |
| Dyslipidemia | 0.85 (0.44–1.65) | 0.63 | – | – | 0.81 (0.57–1.15) | 0.24 | – | – |
| Alcohol use | 0.86 (0.41–1.81) | 0.70 | – | – | 0.97 (0.67–1.41) | 0.87 | – | – |
| Cigarette smoking | 0.83 (0.20–3.38) | 0.79 | – | – | 0.68 (0.30–1.53) | 0.35 | – | – |
| Cardiac disease | 2.96 (0.72–12.09) | 0.13 | – | – | 1.63 (0.61–4.39) | 0.33 | – | – |
| Modified Rankin score | ||||||||
| 3–5 | 1.45 (0.83–2.55) | 0.19 | – | – | 1.06 (0.79–1.42) | 0.70 | – | – |
| 0–2 | 1.00 | 1.00 | ||||||
Recurrent strokes
There were 23 recorded recurrent stroke (event rate of 3.8% of entire cohort), 12 of which led to subsequent mortality of stroke survivors. Among the remaining 11 subjects who survived recurrent strokes, 5 were still under care at closure of data for analysis and 6 were at home using alternative medicines.
Functional status of stroke survivors alive at closure of data
The median (IQR) Modified Rankin Score was 1 (0–3) among stroke survivors at last visit in 2016 or based on assessment by telephone call of subjects no longer coming to clinic as shown in figure 4.
Figure 4.
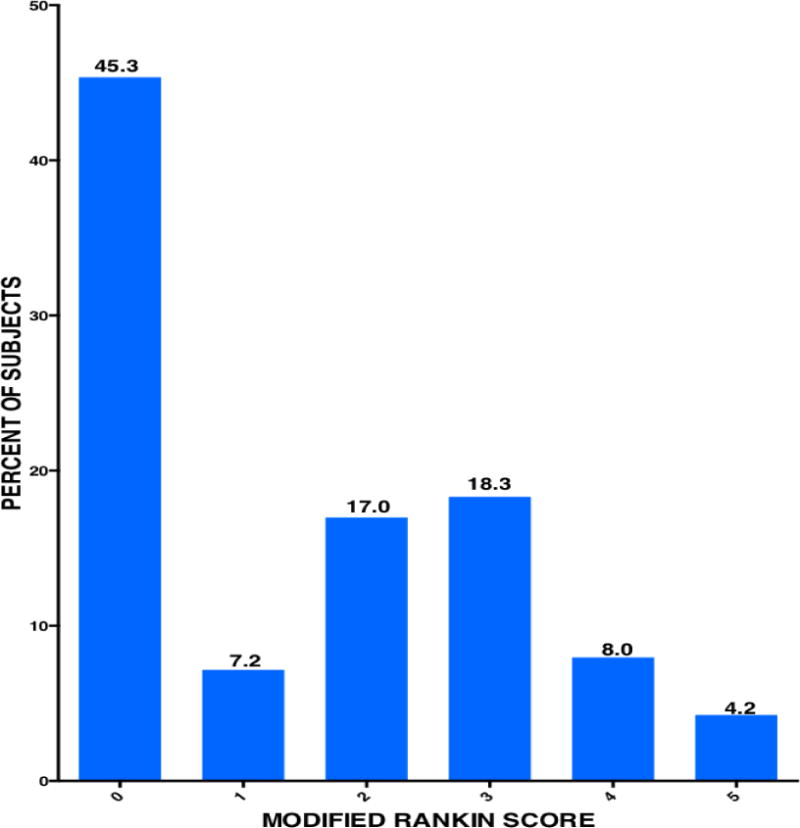
Functional Status of Stroke survivors after a mean of 44.5 ± 27.4 months after stroke onset
DISCUSSION
This is one of the first studies in SSA to describe the medium to long-term trajectory of survival and functional status of stroke patients presenting for routine care in a tertiary medical center. Post-stroke mortality rate was approximately 10% and an additional 28% of subjects were lost-to-follow up with unknown vital status. The majority of subjects alive had mild to moderate functional deficits. We found increasing age and presence of diabetes mellitus to be independent predictors of all cause mortality among this cohort. Whilst our findings generally depict a beneficial outlook for this cohort of Ghanaian stroke survivors, we agree that the setting for their medical care may not be reflective of the situation across most of Africa.
Direct comparison of our findings with previous studies in SSA is challenged by the fact that most reported hospital based studies commenced follow-up of stroke patients after stroke onset. The usually cited follow-up duration ranged between 30 days and 12 months (11–14). The community-based study in Hai district in rural Tanzania may approximate our study in terms of follow-up duration, in that stroke survivors within the community were prospectively followed up after they had survived a stroke. (7–10) However it is uncertain whether the stroke survivors in that study were receiving secondary preventive therapies for risk factor modulation and/or physiotherapy. We began follow-up of stroke subjects after they had been discharged from hospital for outpatient care. The average duration from stroke onset to enrollment into our clinic was approximately 1 month and most patients were on secondary preventive interventions at presentation and we were either optimized or maintained existing therapies (16). Indeed among this cohort, we have previously reported systolic blood pressure control rates of up to 70% within the first year after stroke (21) with high rates of compliance with evidence-based secondary prevention cardiovascular medication utilization (22). In the Community based study in Tanzania, crude case fatality rate at 3 years was 60% (9). Assuming the worst case scenario where all subjects in our cohort who were lost-to-follow up might be considered to have died, we estimate a crude case fatality of 40%.
Among the modifiable vascular risk factors, diabetes mellitus emerged as a dominant risk for stroke mortality in this long-term cohort with an adjusted HR of 2.24 (95%CI: 1.32–3.80). This association between post-stroke mortality and diabetes has been similarly reported among stroke survivors in North America (23, 24), in Europe (25–31), and in Asia (32, 33). The significant impact of diabetes on post-stroke mortality persisted regardless of gender but was more significant among ischemic stroke survivors compared with those who survived hemorrhagic strokes in our study. It is notable that the excess mortality among diabetic stroke survivors was most profound within the first 6 months post-stroke compared with non-diabetics in this cohort. This is similar to reports from a Chinese stroke registry (32) and may be due to poor glycemic control after stroke in LMIC settings. However, data emanating from HIC have shown a time-dependent relationship between excess mortality among diabetics compared with non-diabetic stroke survivors over the longer term. For instance, a Veteran cohort analysis among nearly 49,000 ischemic stroke survivors, failed to show excess mortality among diabetics compared with non-diabetics at 60 days and 1 year, however over the longer term, there was a 15% higher risk of death among diabetics. (24) The surge in mortality among diabetics over the longer post-stroke period has been attributed to accelerated atherosclerosis. We have previously proposed that given the unique context of SSA, a multipronged intervention comprising systematic health education at hospital discharge, use of post-discharge trained community lay navigators, implementation of nurse-led group clinic and administration of health technology would improve CVD outcomes particularly among diabetic stroke survivors through enhanced self-efficacy and intrinsic motivation. (34)
A coordinated post-stroke care pathway, which incorporates the implementation of risk factor control, management of post-stroke complications such as depression, rehabilitation and re-integration into society of stroke survivors by a multidisciplinary team remains a goal to be attained in most LMICs where stroke burden is greatest. However by virtue of their physical and cognitive impairments, stroke survivors are often confronted by a myriad of difficulties in accessing medical care. Indeed we found among 63 subjects who had stopped attending the Neurology clinic that the greater majority were at home using either alternative treatments or no treatments at all. Hence where support systems for stroke survivors are not robust, attrition from care would prevent stroke patients from receiving optimal management. In view of these renowned challenges for post-stroke care in SSA, task shifting strategies, (35, 36), simplification of medical therapies known to improve adherence such as the CVD polypill (37) and mobile health interventions (38,39) that are currently undergoing systematic, feasibility testing in Africa to gather evidence for efficacy are eagerly awaited to inform the change required to curb the poor outcomes of stroke in LMICs.
A limitation of the present study is the high loss-to-follow up rate among stroke survivors whose vital status could not be ascertained due to the retrospective nature of the study design. We however performed sensitivity analyses to account for subjects whose vital status could not be ascertained due to loss-to-follow up which led to fairly similar conclusions regarding increasing age and stroke mortality and also for diabetes when loss-to-follow up was assumed to be equal to alive but significance was lost when a converse assumption was made. Furthermore, exact causes of deaths could not be certified in most cases because such data are not systematically documented in our setting. Information available from relatives of deceased subjects indicated most deaths were related to post-stroke complications such as respiratory infection, decubitus ulcers and possibly uncontrolled seizures. Again, the rates of recurrent stroke in this cohort may have been underestimated due to the loss-to-follow up. However, given the lack of data on which vascular risk factors contribute to post-stroke mortality among Africans in general, we think our findings contribute significantly to current knowledge. We also argue for the setting up of stroke registries in LMICs to monitor long-term outcomes of stroke survivors to help inform strategies to improve the poor outcomes of strokes in these regions.
In conclusion, diabetes mellitus, a modifiable risk factor for stroke, and increasing age are associated with mortality over the long-term among West African stroke survivors. Further prospective studies are warranted in LMICs to evaluate the determinants of mortality among stroke survivors to inform secondary prevention interventions aimed at improving the poor outcomes of stroke in these regions.
Table 2.
Predictors of all cause mortality among Ghanaian stroke survivors (Primary analysis)
| Predictor | Unadjusted HR (95% CI) |
P-value | Adjusted HR (95% CI) |
P-value |
|---|---|---|---|---|
| Age | ||||
| Each 10-year increase | 1.44 (1.18–1.76) | 0.0003 | 1.41 (1.15–1.73) | 0.001 |
| Gender | ||||
| Female | 1.14 (0.68–1.89) | 0.63 | – | – |
| Male | 1.00 | |||
| Stroke type | ||||
| Hemorrhagic | 0.88 (0.43–1.77) | 0.71 | – | – |
| Untyped | 0.79 (0.45–1.40) | 0.43 | ||
| Ischemic | 1.00 | |||
| Hypertension | ||||
| Yes | 3.22 (0.79–13.20) | 0.10 | 2.64 (0.64–10.90) | 0.18 |
| No | 1.00 | |||
| Diabetes Mellitus | ||||
| Yes | 2.65 (1.57–4.48) | 0.0003 | 2.24 (1.32–3.80) | 0.003 |
| No | 1.00 | |||
| Dyslipidemia | ||||
| Yes | 0.83 (0.42–1.65) | 0.60 | – | – |
| No | 1.00 | |||
| Alcohol use | ||||
| Yes | 0.93 (0.44–1.95) | 0.84 | – | – |
| No | 1.00 | |||
| Cigarette smoking | ||||
| Yes | 0.89 (0.22–3.66) | 0.88 | – | – |
| No | 1.00 | |||
| Cardiac disease | ||||
| Yes | 1.47 (0.20–10.60) | 0.70 | – | – |
| No | 1.00 | |||
| Modified Rankin score | ||||
| 3–5 | 1.42 (0.79–2.55) | 0.24 | – | – |
| 0–2 | 1.00 |
Acknowledgments
Grant R21 NS094033 from the National Institute of Neurological Disorder and Stroke.
Footnotes
Publisher's Disclaimer: This is a PDF file of an unedited manuscript that has been accepted for publication. As a service to our customers we are providing this early version of the manuscript. The manuscript will undergo copyediting, typesetting, and review of the resulting proof before it is published in its final citable form. Please note that during the production process errors may be discovered which could affect the content, and all legal disclaimers that apply to the journal pertain.
Conflict of Interests: None to declare.
References
- 1.Feigin VL, Krishnamurthi RV, Parmar P, et al. Update on the Global Burden of Ischemic and Hemorrhagic Stroke in 1990–2013: The GBD 2013 Study. Neuroepidemiology. 2015;45(3):161–76. doi: 10.1159/000441085. [DOI] [PMC free article] [PubMed] [Google Scholar]
- 2.Feigin VL, Forouzanfar MH, Krishnamurthi R, et al. Global and regional burden of stroke during 1990–2010 findings from the Global Burden of Disease Study 2010. Lancet. 2014 Jan 18;383(9913):245–54. doi: 10.1016/s0140-6736(13)61953-4. [DOI] [PMC free article] [PubMed] [Google Scholar]
- 3.Feigin VL, Roth GA, Naghavi M, et al. Global burden of stroke and risk factors in 188 countries, during 1990–2013: a systematic analysis for the Global Burden of Disease Study 2013. Lancet Neurol. 2016 Jun 9; doi: 10.1016/S1474-4422(16)30073-4. [DOI] [PubMed] [Google Scholar]
- 4.O’Donnell MJ, Chin SL, Rangarajan S, et al. Global and regional effects of potentially modifiable risk factors associated with acute stroke in 32 countries (INTERSTROKE): a case-control study. Lancet. 2016 Jul 15; doi: 10.1016/S0140-6736(16)30506-2. [DOI] [PubMed] [Google Scholar]
- 5.Sarfo FS, Akassi J, Awuah D, et al. Trends in stroke admission and mortality rates from 1983 to 2013 in Central Ghana. J Neurol Sci. 2015;357(1-2):240–5. doi: 10.1016/j.jns.2015.07.043. [DOI] [PubMed] [Google Scholar]
- 6.Owolabi MO, karolo-Anthony S, Akinyemi R, et al. The burden of stroke in Africa: a glance at the present and a glimpse into the future. Cardiovasc J Afr. 2015 Mar;26(2 Suppl 1):S27–S38. doi: 10.5830/CVJA-2015-038. [DOI] [PMC free article] [PubMed] [Google Scholar]
- 7.Walker RW, Jusabani A, Aris E, et al. Correlates of short- and long-term case fatality within an incident stroke population in Tanzania. S Afr Med J. 2013;103:107–12. doi: 10.7196/samj.5793. [DOI] [PubMed] [Google Scholar]
- 8.Walker R, Whiting D, Unwin N, et al. Stroke incidence in rural and urban Tanzania: a prospective, community-based study. Lancet Neurol. 2010;9:786–92. doi: 10.1016/S1474-4422(10)70144-7. [DOI] [PubMed] [Google Scholar]
- 9.Walker RW, Wakefield K, Gray WK, Jusabani A, Swai M, Mugusi F. Case-fatality and disability in the Tanzania Stroke Incidence Project cohort. Acta Neurol Scand. 2016;133:49–54. doi: 10.1111/ane.12422. [DOI] [PMC free article] [PubMed] [Google Scholar]
- 10.Danesi MA, Okubadejo NU, Ojini FI, Ojo OO. Incidence and 30-day case fatality rate of first-ever stroke in urban Nigeria: the prospective community based Epidemiology of Stroke in Lagos (EPISIL) phase II results. J Neurol Sci. 2013;331:43–7. doi: 10.1016/j.jns.2013.04.026. [DOI] [PubMed] [Google Scholar]
- 11.Mudzi W, Stewart A, Musenge E. Case fatality of patients with stroke over a 12-month period post stroke. S Afr Med J. 2012;102:765–7. doi: 10.7196/samj.5742. [DOI] [PubMed] [Google Scholar]
- 12.Gomes J, Damasceno A, Carrilho C, et al. Determinants of early case-fatality among stroke patients in Maputo, Mozambique and impact of in-hospital complications. Int J Stroke. 2013;8(Suppl. 100):69–75. doi: 10.1111/j.1747-4949.2012.00957.x. [DOI] [PubMed] [Google Scholar]
- 13.Alkali NH, Bwala SA, Akano AO, Osi-Ogbu O, Alabi P, Ayeni OA. Stroke risk factors, subtypes, and 30-day case fatality in Abuja, Nigeria. Niger Med J. 2013;54:129–35. doi: 10.4103/0300-1652.110051. [DOI] [PMC free article] [PubMed] [Google Scholar]
- 14.Sarfo FS, Acheampong JW, Tetteh LA, Oparebea E, Akpalu A, Bedu-Addo G. The profile of risk factors and in-patient outcomes of stroke in Kumasi, Ghana. Ghana Med J. 2014;48(3):127–34. doi: 10.4314/gmj.v48i3.2. [DOI] [PMC free article] [PubMed] [Google Scholar]
- 15.Kernan WN, Ovbiagele B, Black HR, et al. American Heart Association Stroke Council, Council on Cardiovascular and Stroke Nursing, Council on Clinical Cardiology, and Council on Peripheral Vascular Disease. Guidelines for the prevention of stroke in patients with stroke and transient ischemic attack: a guideline for healthcare professionals from the American Heart Association/American Stroke Association. Stroke. 2014;45:2160–2236. doi: 10.1161/STR.0000000000000024. [DOI] [PubMed] [Google Scholar]
- 16.Sarfo FS, Akassi J, Badu E, et al. Profile of neurological disorders in an adult neurology clinic in Kumasi, Ghana. eNeurologicalSci. 2016;3:69–74. doi: 10.1016/j.ensci.2016.03.003. [DOI] [PMC free article] [PubMed] [Google Scholar]
- 17.Alberti KG, Zimmet PZ. Definition, diagnosis and classification of diabetes mellitus and its complications. Part 1: diagnosis and classification of diabetes mellitus provisional report of a WHO consultation. Diabet Med. 1998;15(7):539–53. doi: 10.1002/(SICI)1096-9136(199807)15:7<539::AID-DIA668>3.0.CO;2-S. [DOI] [PubMed] [Google Scholar]
- 18.National Cholesterol Education Program (NCEP) Expert Panel on Detection, Evaluation, and Treatment of High Blood Cholesterol in Adults (Adult Treatment Panel) Third Report of the National Cholesterol Education Program (NCEP) Expert Panel on Detection, Evaluation, and Treatment of High Blood Cholesterol in Adults (Adult Treatment Panel III) Circulation. 2002;106:3143–3421. [PubMed] [Google Scholar]
- 19.O’Donnell MJ, Xavier D, Liu L, et al. Risk factors for ischaemic and intracerebral haemorrhagic stroke in 22 countries (the INTERSTROKE study): a case-control study. Lancet. 2010 Jul 10;376(9735):112–23. doi: 10.1016/S0140-6736(10)60834-3. [DOI] [PubMed] [Google Scholar]
- 20.Wilson JT, Hareendran A, Grant M, et al. Improving the assessment of outcomes in stroke: use of a structured interview to assign grades on the modified Rankin Scale. Stroke. 2002 Sep;33(9):2243–6. doi: 10.1161/01.str.0000027437.22450.bd. [DOI] [PubMed] [Google Scholar]
- 21.Sarfo FS, Kyem G, Ovbiagele B, et al. One-year rates and determinants of post-stroke systolic blood pressure control among Ghanaians. J Stroke Cerebrovasc Dis. 2017 Jan;26(1):78–86. doi: 10.1016/j.jstrokecerebrovasdis.2016.08.033. [DOI] [PMC free article] [PubMed] [Google Scholar]
- 22.Sarfo FS, Ovbiagele B, Akassi J, Kyem G. Baseline prescription and one-year persistence of secondary prevention drugs after an index stroke in Central Ghana. eNeurologicalSci. 2017;6:68–73. doi: 10.1016/j.ensci.2016.12.003. [DOI] [PMC free article] [PubMed] [Google Scholar]
- 23.Sprafka JM, Virnig BA, Shahar E, McGovern PG. Trends in diabetes prevalence among stroke patients and the effect of diabetes on stroke survival: the Minnesota Heart Survey. Diabet Med. 1994;11:678–684. doi: 10.1111/j.1464-5491.1994.tb00332.x. [DOI] [PubMed] [Google Scholar]
- 24.Kamalesh M, Shen J, Eckert GJ. Long term postischemic stroke mortality in diabetes. A Veteran Cohort Analysis. Stroke. 2008;39:2727–31. doi: 10.1161/STROKEAHA.108.517441. [DOI] [PubMed] [Google Scholar]
- 25.Icks A, Claessen H, Morbach S, et al. Time-dependent impact of diabetes on mortality in patients with stroke. Diabetes Care. 2012;35:1868–1875. doi: 10.2337/dc11-2159. [DOI] [PMC free article] [PubMed] [Google Scholar]
- 26.Jorgensen H, Nakayama H, Raaschou HO, Olsen TS. Stroke in patients with diabetes. The Copenhagen Stroke Study. Stroke. 1994;25:1977–1984. doi: 10.1161/01.str.25.10.1977. [DOI] [PubMed] [Google Scholar]
- 27.Ericksson M, Carlberg B, Eliasson M. The disparity in long-term survival after a stroke in patients with and without diabetes persists: the Northern Sweden MONICA study. Cerebrovasc Dis. 2012;34(2):153–60. doi: 10.1159/000339763. [DOI] [PubMed] [Google Scholar]
- 28.Rønning OM. Very long-term mortality after ischemic stroke: predictors of cardiovascular death. Acta Neurol Scand Suppl. 2013;(196):69–72. doi: 10.1111/ane.12053. [DOI] [PubMed] [Google Scholar]
- 29.Greisenegger S, Zehetmayer S, Ferrari J, et al. Clinical predictors of death in young and middle-aged patients with ischemic stroke or transient ischemic attack: long-term results of the Vienna Stroke registry: clinical predictors of ischemic stroke mortality in patients <60 years. J Neurol. 2011;258(6):1105–13. doi: 10.1007/s00415-010-5893-9. [DOI] [PubMed] [Google Scholar]
- 30.Sarker SJ, Heuschmann PU, Burger I, et al. Predictors of survival after hemorrhagic stroke in a multi-ethnic population: the South London Stroke Register (SLSR) J Neurol Neurosurg Psychiatry. 2008;79(3):260–5. doi: 10.1136/jnnp.2007.129189. [DOI] [PubMed] [Google Scholar]
- 31.Viitenen M, Eriksson S, Asplund K, Wester PO, Winblad B. Determinants of long-term mortality after stroke. Acta Med Scand. 1987;221(4):349–56. doi: 10.1111/j.0954-6820.1987.tb03355.x. [DOI] [PubMed] [Google Scholar]
- 32.Jia Q, Zhao X, Wang C, et al. Diabetes and poor outcomes within 6 months after acute ischemic stroke: the China National Stroke Registry. Stroke. 2011;42:2758–2762. doi: 10.1161/STROKEAHA.111.621649. [DOI] [PubMed] [Google Scholar]
- 33.Ray BK, Hazra A, Ghosal M, et al. Early and delayed fatality of stroke in Kolkata, India: results from a 7-year longitudinal population-based study. J Stroke Cerebrovasc Dis. 2013;22(4):281–9. doi: 10.1016/j.jstrokecerebrovasdis.2011.09.002. [DOI] [PubMed] [Google Scholar]
- 34.Ovbiagele B. Tackling the growing diabetes burden in Sub-Saharan Africa: a framework for enhancing outcomes in stroke patients. J Neurol Sci. 2015;348(1–2):136–41. doi: 10.1016/j.jns.2014.11.023. [DOI] [PMC free article] [PubMed] [Google Scholar]
- 35.Owolabi MO, Akinyemi RO, Gebregziabher M, et al. Randomized controlled trial of a multipronged intervention to improve blood pressure control among stroke survivors in Nigeria. Int J Stroke. 2014;9(8):1109–16. doi: 10.1111/ijs.12331. [DOI] [PubMed] [Google Scholar]
- 36.Wahab KW, Owolabi M, Akinyemi R, Jenkins C, Arulogun O, Akpa O, et al. Short-term pilot feasibility study of a nurse-led intervention to improve blood pressure control after stroke in Nigeria. J Neurol Sci. 2017;377:116–120. doi: 10.1016/j.jns.2017.04.005. [DOI] [PubMed] [Google Scholar]
- 37.Sarfo FS, Ovbiagele B. Stroke minimization through additive anti-atherosclerotic agents in routine treatment (SMAART): A pilot trial concept for improving stroke outcomes in sub-Saharan Africa. J Neurol Sci. 2017;377:167–173. doi: 10.1016/j.jns.2017.04.012. [DOI] [PubMed] [Google Scholar]
- 38.Sarfo FS, Treiber F, Jenkins C, et al. Phone-based intervention under nurse guidance after stroke (PINGS): A study protocol for a randomized controlled trial. Trials. 2016;17(1):436. doi: 10.1186/s13063-016-1557-0. [DOI] [PMC free article] [PubMed] [Google Scholar]
- 39.Sarfo FS, Adamu S, Awuah D, Sarfo-Kantanka O, Ovbiagele B. Potential role of tele-rehabilitation to address barriers to implementation of physical therapy among West African stroke survivors: A cross-sectional survey. J Neurol Sci. 2017;381:203–208. doi: 10.1016/j.jns.2017.08.3265. [DOI] [PMC free article] [PubMed] [Google Scholar]