Abstract
In this work, we reevaluated long standing conjectures as to the source of the exceptionally large compliance of the bladder wall. Whereas, these conjectures were based on indirect measures of loading mechanisms, in this work we take advantage of advances in bioimaging to directly assess collagen fibers and wall architecture during biaxial loading. A custom biaxial mechanical testing system compatible with multiphoton microscopy (MPM) was used to directly measure the layer dependent collagen fiber recruitment in bladder tissue from 9 male Fischer rats (4 adult and 5 aged). As for other soft tissues, the bladder loading curve was exponential in shape and could be divided into toe, transition and high stress regimes. The relationship between collagen recruitment and loading curves was evaluated in the context of the inner (lamina propria) and outer (detrusor smooth muscle) layers. The large extensibility of the bladder was found to be possible due to folds in the wall (rugae) that provide a mechanism for low resistance flattening without any discernible recruitment of collagen fibers throughout the toe regime. For more extensible bladders, as the loading extended into the transition regime, a gradual coordinated recruitment of collagen fibers between the lamina propria layer (LP) and detrusor smooth muscle layer (DSM) was found. A second important finding was that wall extensibility could be lost by premature recruitment of collagen in the outer wall that cut short the toe region. This change was correlated with age. This work provides, for the first time, a mechanistic understanding of the role of collagen recruitment in determining bladder extensibility and capacitance.
Keywords: bladder compliance, collagen recruitment, multiphoton, extracellular matrix
1 Introduction
The human bladder is a highly compliant organ that can expand from an empty state to store 450 ± 64.4 ml of urine at relatively low pressures of 43.5 ± 7.3 cm of H2O in young adults (18 yrs) (Kershen et al. 2002). This is quite remarkable given the low extensibility of the collagen fibers that make up the bulk of the extracellular matrix in the bladder wall. However, the compliance of the bladder wall can decrease with age and disease (Ameda et al. 1999; Kohan et al. 2000). This increased stiffness not only diminishes the bladder capacity but also results in increased filling pressures that are transmitted to the kidney and can cause recurrent infection, abdominal pain and, in severe cases, reflux nephropathy or chronic kidney failure (Andersson and Wein 2011; Zeidel 2016). Hence, it is of great importance to understand the mechanical source of the bladder extensibilty and how this functional property is changed during aging and disease.
Structurally, the bladder wall is a layered composite with passive components (elastin, collagen fibers and smooth muscle cells) as well as active components (smooth muscle cells). The components are distributed in laminated structures within the bladder wall that are typically grouped into three layers, Fig. 1. Moving from the lumen, these are the mucosa, the muscularis propria (herein referred to as the detrusor smooth muscle (DSM) layer and the adventitia. The mucosa is composed of an urothelium, a basement membrane and a lamina propria (LP). The LP contains a densely packed, interwoven network of collagen I and III fibers (Ewalt et al. 1992; Chang et al. 1999). The DSM is a composite of smooth muscle bundles intermixed with type III collagen fibers and elastin fibers. The collagen fibers are believed to interconnect the smooth muscle cells (SMC) within the bundles (Ewalt et al. 1992) and are less densely packed than in the lamina propria layer. The outer surface of the bladder is formed of loose connective tissue commonly termed the adventitia.
Fig. 1.

Schematic of a cross section of the bladder wall showing the three major layers (mucosa, detrusor smooth muscle layer and adventitia). The folds (rugae) of the mucosa layer involve both the urothelium and LP layers. Smooth muscle bundles are shown aligned in two layers within the DSM.
Even though it is generally accepted that bladder compliance is of tremendous clinical importance, a small number of studies performed nearly two decades ago are the main source of information on the physical source of bladder wall extensibility. In 1992, Ewalt et al. published what appears to be the first conjecture as to the source of bladder compliance, attributing bladder extensibility to folds in the LP collagen fibers, (Ewalt et al. 1992). They conjectured the wavy LP fibers have little resistance to straightening, enabling the bladder to undergo large changes in volume with small increases in pressure. They attributed the bladder filling capacity entirely to the LP layer, and in particular to the volume at which the LP collagen fibers are engaged.
Chang et al. (1999) explored the conjecture of Ewalt et al. by analyzing the collagen fibers in bladders filled to 0%, 25%, 50%, 75% and 100% of their total capacity. They similarly attributed bladder capacity entirely to the lamina propria and made a second conjecture that the mechanical role of the detrusor layer is to simply serve as “the limiting or girding layer to prevent over-distension of the bladder wall”. This emphasis on the LP layer as the limiting factor for wall compliance was primarily supported by a comparison of estimates of the maximum tension of the lamina propria and detrusor layer (G. Susset, Jacques, H. Regnier 1981) and their change in thickness during filling (Chang et al. 1999). These conjectures, while often referenced, have not been reevaluated, (e.g. (Aitken and Bägli 2009; Andersson and McCloskey 2014)) with the exception of recent uniaxial work on mouse bladder (Hornsby 2016). Hence, there is a need for further direct evidence to prove or disprove these conjectures.
While there is a lack of direct measurements of the varied mechanical roles of the LP and DSM layers during bladder filling, changes to the extracellular matrix have been associated with altered mechanical function. For example, Ewalt et al. (1992) found that, in the non-compliant bladders of children (≤ 14), the interfascicular space (between SMC bundles) accumulates type III collagen fibers and elastin. They postulated these changes prevent normal expansion of the detrusor layer and thereby affect bladder compliance. Non-compliant bladders have also been studied in the context of spinal cord injured and partial bladder obstruction (Chen et al. 2013). In these settings, non-compliant bladders were found to have increased density and volume of smooth muscle cells (Hald and Horn 1998), increased quantities of elastin, and decreased collagen fibers in the detrusor layer (Nagatomi et al. 2004; Kim et al. 1991). The ratio of collagen types I and III as well as collagen fiber orientation were also found to be significantly different in the detrusor layer of the non-compliant bladder relative to the compliant (Kim et al. 1991; Chang et al. 1999; Ewalt et al. 1992). These changes were speculated to directly or indirectly cause the loss of bladder compliance.
In this work, we make use of advances in bioimaging coupled with mechanical testing to revisit these two conjectures. In particular, the purpose of the current study is to investigate the relationship between bladder wall structure and compliance during loading using recently developed imaging tools that enable concurrent imaging of collagen fibers and mechanical testing in intact, unfixed bladder samples (Hill et al. 2012). We developed a planar biaxial system compatible with multiphoton imaging (MPM) that enables imaging of collagen fiber recruitment during simulated bladder filling - approximated as a planar biaxial deformation. The structural and mechanical data were quantified and used to evaluate the mechanisms responsible for compliance and loss of compliance in rat bladders. Attention was given to changing roles of the wall layers during loading from zero strain through supraphysiological levels.
An enhanced understanding of the structural mechanisms responsible for bladder compliance will guide the development of novel medical treatments of bladder dysfunction, and provide design objectives for tissue engineered bladders aimed at mimicking the remarkable compliance of the bladder (Pokrywczynska et al. 2015). Furthermore, this study will identify the structural milieu of the intramural cells, knowledge that is essential for understanding the growth and remodeling process in health and disease (Aitken and Bägli 2009).
2 Methods
2.1 Tissue preparation
Nine male Fischer rats (Species F344, adult and aged rats from National Institute on Aging of the NIH) were used in this study, separated by age with 4 adult rats (12 months) and 5 aged rats (21-24 month). The unloaded meridional length (ho) and diameter (wo) were measured in the explanted bladder. The bladders were then cut open longitudinally and trimmed into square pieces with widths of 6mm ± 1mm such that the sides of the samples were aligned with the in situ longitudinal and circumferential directions, Fig. 2a. To inhibit smooth muscle cell contraction samples were immersed in Hanks Buffer Salt Solution (HBSS) containing, (in mM) NaCl 138, KCl 5, KH2PO4 0.3, NaHCO3 4, MgCl2 1, HEPES 10, glucose 5.6, with pH 7.4, 310 mOsm/l) without calcium and with added EDTA (0.5mM). The voltage calcium channel blocker nifedipine (5uM; Sigma) and the SERCA pump inhibitor, thapsigargin (1uM; Tocris Biosciences), which prevents the reloading of intracellular calcium stores, were also added.
Fig. 2.
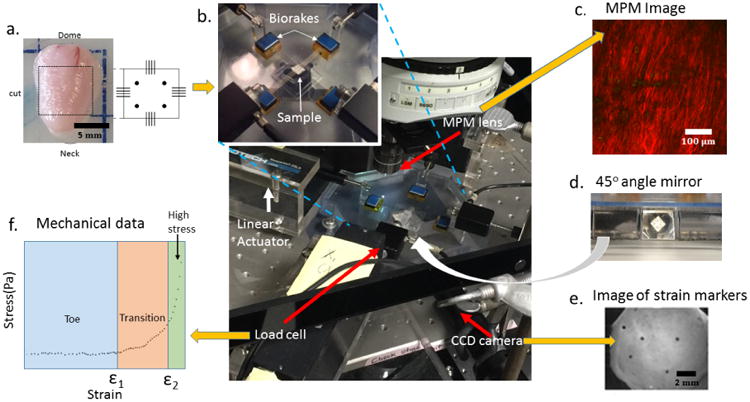
Schematic of experimental system developed for mechanical testing and bioimaging of bladder samples. Yellow arrows indicate input (one) and output (three) for the system. (a) Bladder and schematic of of square tissue sample (input), (b) Biaxial testing system under MPM lens with insert showing magnification of tissue loaded on biorakes, (c) Representative projected stack of images showing second harmonic generation signal from MPM imaging (output), (d) Image from 45° mirror showing underside of loaded sample, (e) Image from CCD camera showing strain markers imaged using mirror system (output), (f) Representative loading stress strain curve showing toe, transition and high stress regimes of curve obtained using mechanical testing system (output).
2.2 Mechanical testing and constitutive modeling
Mechanical testing was performed using a custom biaxial system specifically designed for testing bladder tissue concurrent with imaging under a multiphoton microscope, Fig. 2. This design enabled imaging of collagen fibers in intact specimens without staining or fixation. In the biaxial system, displacement can be independently controlled by four actuators (Aerotech, Inc., linear actuator ANT-25LA) and force measurements are performed using load cells on two of the actuators (Transducer techniques, nonrepeatibility 0.05% of R.O., capacity 5 lbs), Fig. 2b. Tissue is mounted on the device using biorakes (World Precision Instruments, Inc.). The biaxial system includes a CCD camera and a 45 degree offset mirror to enable imaging of strain markers from beneath the mounted tissue, Fig. 2d,e. This imaging system enables MPM imaging at prescribed biaxial strains.
Prior to testing, the unloaded thickness to of each sample was measured in 5 positions using a 0-150mm digital caliper (Marathon watch company Ltd) and average Fiducial strain markers (Basalt microspheres, 425-500 μm, Whitehouse Scientific) were attached to the abluminal side of each sample for strain calculation. During testing, the square sample was first loaded lumen side up on the biorakes, Fig. 2b. Following Wognum et al. (2009), a tare-load was applied to the sample after which it was preconditioned, then unloaded, then loaded to the tare-load, then mechanically tested. Five consecutive equibiaxial loading cycles to a stretch of 1.8 were used for preconditioning with a tare-load of 0.02N. The post-precondition tare-loaded state is used as reference configuration. The lumen surface was imaged under MPM at stepwise increases in strains, Fig. 2c, (Section 2.5). To avoid tissue damage while obtaining a large range of strain, loading was stopped at a strain where the collagen fibers were visibly straightened (recruited) defined as the maximum strain. Hence, an individual maximum strain was identified for each sample. After lumen side imaging, 5 equibiaxial loading cycles to the maximum strain were performed at a strain rate of 1% s−1. The strain marker locations were recorded by a CCD camera using the 45 degree mirror block beneath the sample (Fig. 2d,e) and used to obtain the loading curves. The sample was then flipped and the imaging was repeated from the abluminal side, once again until collagen recruitment was observed. The components of the Green-Lagrange strains were calculated from the fiducial marker locations using a finite element interpolation method (Sacks 2000). Components of the Cauchy stress tensor were calculated using load measurements with estimates of current cross sectional area obtained from the strain measurements under the approximation of isochoric motion.
For the purpose of analyzing the loading regimes and motivated by prior studies of the bladder wall (Gloeckner et al. 2002), the rat bladder was modeled as an incompressible, hyperelastic, isotropic material with Cauchy stress tensor
| (1) |
where p is the Lagrange multiplier associated with incompressibility, I1 is the first invariant of the left Cauchy-Green deformation tensor B, μ is the shear modulus and material constant γ controls the exponential dependence on I1. An exponential dependence on stretch was proposed by Fung (1967) and the form in (1) is commonly used for soft biological tissues. Data sets for the planar biaxial loading studies were combined for the longitudinal and circumferential directions and used to obtain the material constants in (1).
2.3 Calculation of bladder compliance and capacity
The International Continence Society (ICS) defines bladder compliance C as
| (2) |
(given in units of ml per cm of H20) where ΔP is the change in intraluminal pressure between two different loading states and ΔV is the corresponding change in volume (Abrams et al. 2002). The initial loading state is chosen as the start of filling while the second and higher loading state is either the cystometric capacity or the state immediately before any muscular bladder contractions have started (that would lead to substantial bladder leakage). Cystometric capacity is defined as the bladder volume when the patient has a normal desire to void, (Abrams et al. 2002).
In this work, consistent with the ICS definition for compliance, we consider the two states to be the zero pressure state (Po) and the cystometric pressure (P1) set equal to 45 mmHg for rats, (Alexander 1971). The corresponding volumes are denoted Vo and V1, respectively so the compliance is (V1 – V0)/(P1 – P0). The bladder capacity is simply V1, namely, the amount of urine the bladder can hold at the cystometric pressure.
In estimating the volume at the zero pressure state, the bladder was approximated as an ellipsoid (Vo = πw2h/6), using animal specific values for wo and ho. An effective unloaded spherical radius ro was then calculated from
| (3) |
The corresponding loaded volume was estimated from the analytic solution for pressure inflation of a spherical membrane Beatty (1987) with bladder specific material constants obtained from the planar biaxial studies. In particular, the intraluminal pressure for the exponential model as a function of stretch λ
| (4) |
where λ is the ratio of the current radius to ro.
2.4 Assessment of regimes of the loading curve
Following the approach of Sacks (2000), when the rat bladder is at maximum filling pressure, the intramural stress in the bladder wall is set to 100 KPa, estimated from an equilibrium balance for a sphere (Laplace's law). For this reason, we consider loading curves up to 100 KPa. Using the exponential fit, loading curves were extrapolated to this maximum stress with corresponding maximum strain, (∊max), where ∊ = (λ2 – 1)/2. The average curve for each of the principal directions was calculated and divided into three regimes: toe regime, transition regime, and high stress regime as follows. To determine the strain defining the end of the toe regime, first a linear fit of the data starting from the origin was performed with an R2 of 0.99. The toe regime, or low stress regime was then defined by strains in the range [0, ∊1), where ∊1, is the strain at which the loading data deviates from the linear fit by 450 Pa. The high stress regime was defined as ∊ ∈ (∊2,∊max], Fig. 2f. Here ∊2 was similarly defined relative to a linear fit to the data with an R2 of 0.98, in this case, beginning with the maximum of the high stress data rather than the origin. The transition regime was defined as the intermediate regime, ∊ ∈[∊1,∊2], Fig. 2f.
2.5 Multiphoton imaging
Tissues were scanned with multiphoton imaging using a Z step size of 2 μm, following methods in (Hill et al. 2012). Briefly, a multiphoton microscope (Olympus FV1000 MPE) equipped with a Coherent Chameleon TiSapphire pulsed Laser was used to image collagen fibers. An excitation wavelength of 800 nm and 1.12 NA 25 × MPE water immersion objective were used for all samples. Signals from second harmonic generation (SHG) were collected using a 400 nm emission filter with a ±50 nm spectral bin.
2.6 Evaluation of fiber recruitment from multiphoton images
Multiphoton image stacks were used to obtain 3D reconstructions of the collagen fiber architecture that were mapped to the corresponding point on the loading curve by matching the loading level. Collagen fibers could be clearly imaged up to depths of approximately 200 μm in unloaded samples. Collagen fibers were traced in 2D slices through the depth of the 3D reconstructed model (Filament function in Imaris, Bitplane, Switzerland), Fig. 3, (Hill et al. 2012).
Fig. 3.
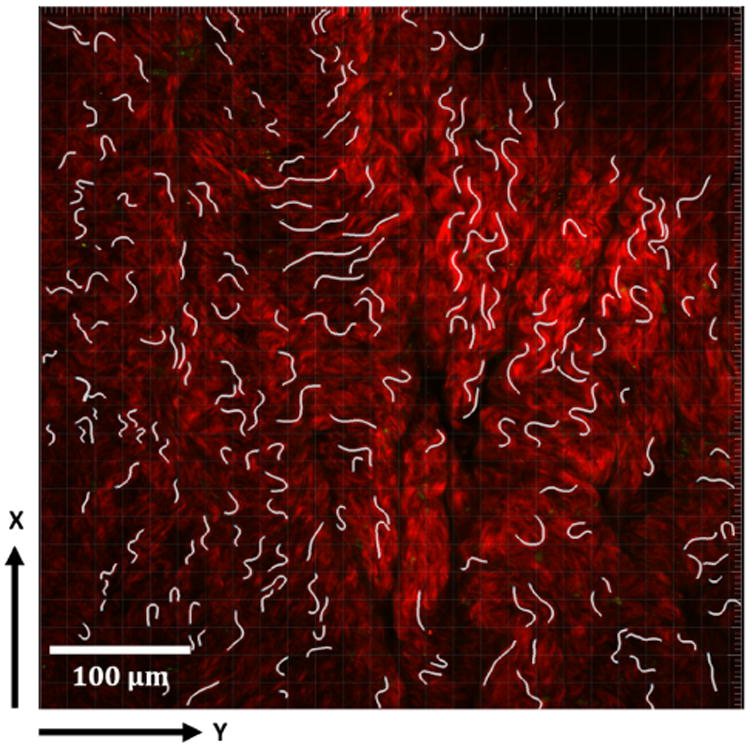
Collagen fiber tracings shown in white in a 2D projection of a representative 3D reconstructed model formed from 2D multiphoton stacks. MPM signal from collagen fibers seen in red.
Fiber arc length (s) was determined for each fiber tracing. Cord length (L) was defined as the length of a best linear fit line to the same segment. Fiber straightness was defined as the ratio of chord length to arc length L/s (Hill et al. 2012). A fiber was designated as recruited to load bearing when its straightness reached 0.98 (Hill et al. 2012; Hill 2011). Careful attention was given to assuring the fiber straightness results for each sample at each load were independent of the number of fiber tracings. In particular, a mean value of straightness of the first j tracings was defined as,
| (5) |
The difference between the calculated straightness for j+1 tracings and j tracings was defined as a residual of m(j):
| (6) |
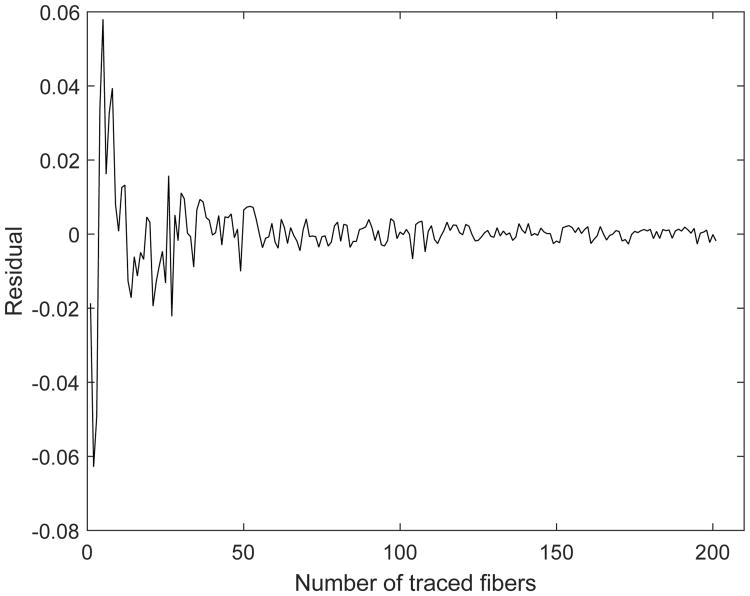
When the residual satisfied abs[e(j)] < 0.005, the number of fiber tracings was deemed sufficient to evaluate fiber straightness. A representative plot for e(j) is shown in Fig. 4 and illustrates how the bounds on the residual diminish with increasing number of fiber tracings, tending toward zero.
Fig. 4. Residual e(j) as a function of number of fibers considered in calculating fiber straightness. Definition of residual is given in Eq. 6.
2.7 Quantification of the flattening of the lamina propria
The mucosa of the unloaded bladder wall is wavy, Fig. 1, and gradually flattens under load. The flatness/waviness of the LP was assessed in 3D reconstructions of the MPM images by calculating the vertical position of the surface. The lamina propria was defined to be flat when the standard deviation of the vertical position was less than 20 microns.
2.8 Immunohistochemistry
Immunofluorescent (IH) staining was performed to identify regions of smooth muscle cell bundles and location of cell nuclei, following established protocols from the Center for Biologic Imaging (CBI), (details can be found at www.cbi.pitt.edu/Protocols.htm). Briefly, after preparing the square sample for mechanical testing, a portion of the remaining tissue was fixed in 4% PFA (paraformaldehyde Cross sections were obtained by freezing the specimen in OCT and 2 μm thick slices were cut using a cryostat (HM 50SE, Microm). The sample was incubated (diluted by 1% NGS) with primary antibody for αSMA (Sigma C6198). To stain cell nuclei, the slices were then washed with 1× PBS 3 times and incubated without illumination in DAPI (4′,6-diamidino-2-phenylindole, 1:1000, Life Technologies All sections were then imaged using Olympus Fluoview 1000 confocal microscopy (Olympus Imaging America, Melville, NY). A neighboring section similarly stained with DAPI but without antibody for αSMA was imaged using multiphoton microscopy.
3 Results
3.1 Overview of collagen fiber and cellular distribution across the wall layers
To provide context for discussions of the enface images of collagen fibers, a cross section of the rat bladder is provided in Fig. 5, with IH staining imagined under confocal microscope and a neighboring section imaged using MPM. Fig. 5(a) shows cell nuclei (blue) and αSMA positive regions in red whereas Fig. 5(b) shows the cell nuclei (yellow) and collagen fibers (red). In Fig. 5(a), moving from the lumen downwards, the cell density diminishes as one moves through the mucosa from the urothelium to the lamina propria. The adjacent detrusor layer has large regions of αSMA positive staining indicating areas of smooth muscle bundles. Sparse cell nuclei can be seen in the adventitial layer. In Fig. 5(b), consistent with Fig.5(a), the urothelium layer has a dense display of cell nuclei. Under MPM, the collagen within the lamina propria can be seen. Moving into the detrusor layer, regions of dense collagen fibers are interspersed with regions populated with cells corresponding to regions of smooth cell bundles in Fig. 5(a). Further outwards, the collagen within a thin adventitial layer can be seen. This sample has been gently flattened before fixation, so waviness is not seen in the mucosa layer.
Fig. 5.
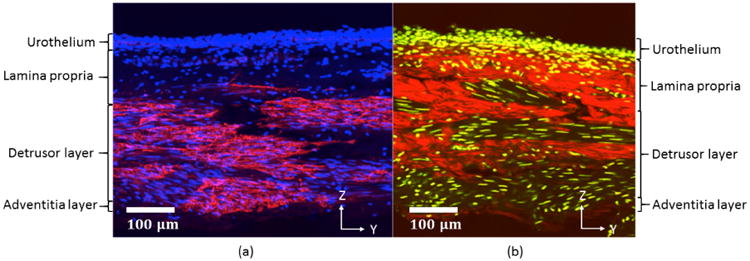
Bladder cross section imaged using (a) Confocal microscopy and (b) Multiphoton Microscopy. In (a), cell nuclei are shown in blue (DAPI), while red shows regions positive for αSMA. Cell nuclei are yellow in (b) with collagen fiber signal in red. The y-z plane corresponds to the longitudinal and transmural directions, respectively. Lumen side is on the top of the image.
3.2 Mechanical response of the bladder wall
The raw data for the biaxial testing for each sample are shown in Fig. 6, averaged for the longitudinal and circumferential directions. This data was well fit by the exponential model (1) with an R2 > 0.94 for all samples, Table 1.
Fig. 6.
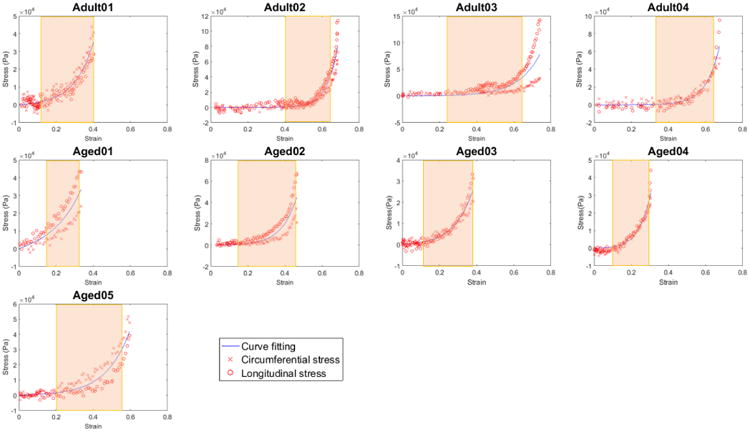
Mechanical loading curves for bladder tissue showing Cauchy stress as a function of strain (∊) with biaxial raw data (red) and curve obtained from fit of the exponential model in Eq. 1 (blue) to the averaged data. Material parameters shown in Table 1. The transition regime for each curve is delineated by a colored rectangle.
Table 1.
Mechanical properties for each bladder sample. Material constants μ, γ and corresponding R2 for fit of constitutive model in Eq. 1 to data shown in Fig. 6. Strains ∊1 and ∊2 separate the low strain, transition and high strain regimes of the loading curve.
| Sample | μ (Pa) | γ | R2 | ∊1 | ∊2 | Type |
|---|---|---|---|---|---|---|
| Adult01 | 4635 | 2.2 | 0.95 | 0.13 | 0.40 | II |
| Adult02 | 22 | 4.2 | 0.98 | 0.40 | 0.63 | I |
| Adult03 | 625 | 2.0 | 0.94 | 0.24 | 0.64 | I |
| Adult04 | 90 | 3.3 | 0.98 | 0.34 | 0.63 | I |
| Aged01 | 11,015 | 1.4 | 0.99 | 0.15 | 0.34 | II |
| Aged02 | 1814 | 2.9 | 0.98 | 0.16 | 0.44 | II |
| Aged03 | 4050 | 2.2 | 0.98 | 0.13 | 0.40 | II |
| Aged04 | 7720 | 3.7 | 0.96 | 0.11 | 0.31 | II |
| Aged05 | 1500 | 1.8 | 0.98 | 0.20 | 0.57 | I |
3.3 Two bladder wall types identified based on wall extensibility
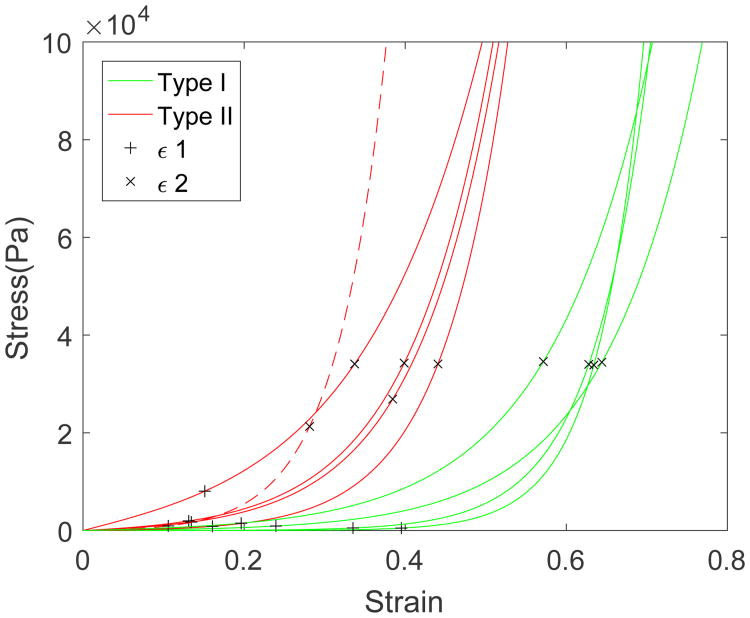
The strains ∊1 and ∊2 at the interface between the three loading regimes (toe, transition, and high-stress regimes) are given in Table 1. Two different categories of bladder were defined based on these strains. In particular, the method of k means clustering was used to partition the n = 9 observations into k = 2 clusters, where each observation belongs to the cluster with the nearest mean. Type I has mean values (∊1 = 0.29, ∊2 = 0.61), while Type II has means (∊1 = 0.14, ∊2 = 0.38), Table 1. A student T-test showed these groups were statistically distinct, (p=0.038 for ∊1, and p=0.00011 for ∊2). Type I wall is more extensible due to longer toe regimes (larger ∊1) and larger strains before the onset of the high stress regime (∊2). These differences can be seen visually for each bladder in Fig. 6 and for the combined data set in Fig. 7. The blinded separation of the samples into two wall types is clearly seen in Fig. 7, where data for Type I are shown in green and for Type II in red.
Fig. 7.
Cauchy stress as a function of strain for wall types I (green) and II (red) corresponding to composite of curves from Fig. 6. The strain at the end of toe regime (∊1) and end of transition regime (∊2) are designated by “+” and “×’, respectively.
3.4 Bladder compliance can be maintained despite increased wall stiffness
The bladder capacity, defined here as the bladder volume at cystometric pressure, is an important variable for the health of the animal since it determines how much urine can be stored comfortably before voiding. As noted earlier, bladder compliance and capacity are proportional for a fixed cystometric pressure. It follows from a simple equilibrium balance that reduced capacity can arise due to increased stiffness (μ, γ), decreased volume (Vo) and/or increased wall thickness to. The average compliance (and hence capacity) of the more extensible Type I bladders is nearly twice that of Type II bladders and these groups are statistically distinct (p=0.0038), Table 2 and Fig. 8.
Table 2. Comparison of the unloaded wall thickness to, unloaded volume Vo, volume expansion V-Vo, and compliance C between the two wall types.
| Sample | Wall Type | to(mm) | Vo(mm3) | V–Vo(mm3) | C(ml/cmH2O) |
|---|---|---|---|---|---|
| Adult02 | I | 0.52±0.02 | 170 | 414 | 0.0069 |
| Adult03 | I | 0.61±0.04 | 166 | 446 | 0.0074 |
| Adult04 | I | 0.46±0.05 | 182 | 460 | 0.0077 |
| Aged05 | I | 0.66±0.03 | 143 | 317 | 0.0053 |
|
| |||||
| Average | I | 0.56 | 165 | 409 | 0.0068 |
|
| |||||
| Std | I | 0.09 | 17 | 65 | 0.0011 |
|
| |||||
| Adult01 | II | 0.66±0.03 | 115 | 138 | 0.0023 |
| Aged01 | II | 0.72±0.03 | 129 | 116 | 0.0019 |
| Aged02 | II | 0.85±0.02 | 214 | 291 | 0.0048 |
| Aged03 | II | 0.92±0.04 | 245 | 293 | 0.0049 |
| Aged04 | II | 1.12±0.04 | 151 | 80 | 0.0013 |
|
| |||||
| Average | II | 0.85 | 171 | 184 | 0.0031 |
|
| |||||
| Std | II | 0.18 | 56 | 101 | 0.0017 |
Fig. 8.
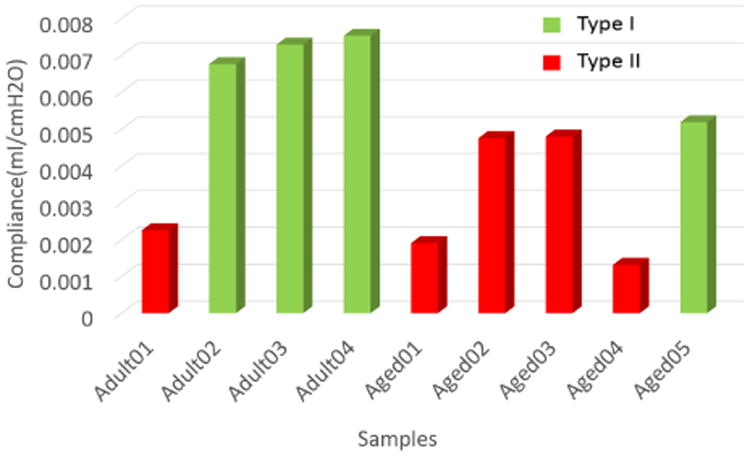
Compliance of Type I (green) and Type II (red) bladder walls.
Two of the (Type II) bladders (Aged02 and Aged03) maintained a relatively large capacity (compliance) despite lower extensibility through increased Vo, Fig. 8 and Table 2. The wall thickness was within one standard deviation of the average for Type II walls and therefore did not play a large role in maintaining a high bladder capacity. These two bladders had the largest unloaded volumes of the entire cohort and Vo was more than 30% greater than the average volume of the Type I bladders, Table 2. As a result, the capacities of these Type II bladders were within 70% of the average for Type I bladders. In contrast, the other three Type II walls were not enlarged relative to the Type I bladders and their capacities were reduced to less than 34% of the average capacity for the type I walls.
3.5 Relationship between flattening of rugae and bladder loading curves
A representative projected stack of MPM images as viewed from the lumen side of the bladder wall in the unloaded state is seen Fig. 9(a), The waviness of the unloaded luminal surface (rugae) can be seen with the undulated collagen fibers in red. Since the depth of the stack is less than the depth of the unloaded LP layer, these undulations are truncated, leading to areas absent of the red signal in this projected view. In Fig. 9(b), the surface elevation of the luminal surface is shown as a contour plot for the 3D reconstructed stacks in Fig.9(a). The surface folds are clearly multi-dimensional, not, for example, ridges running in the longitudinal direction.
Fig. 9.

Rugae of the unloaded bladder wall as seen in (a) Projected stack of multiphoton images with collagen fibers in red and (b) Corresponding contour plot of surface elevation with peaks of undulated surface (large z-value) shown in yellow.
3.5.1 Rugae are not flattened until transition regime
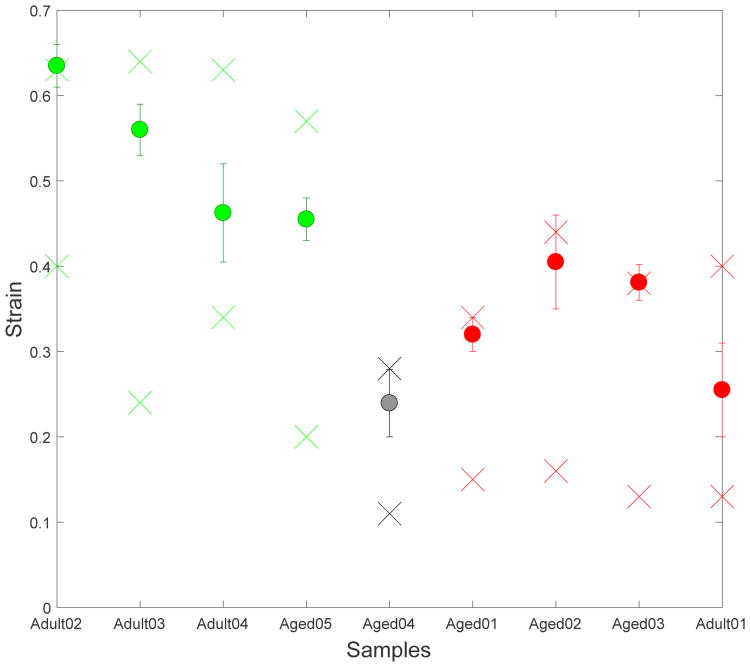
The regime in the loading curve where rugae were lost for each sample is seen in Fig. 10. The two “×” marks denote the strain (y-axis) at which the transition regime begins and ends. The “o” denotes the strain at which the luminal surface was flattened. Since the imaging was done at discrete strain values, for each sample, there is a bar, signifying the largest strain at which the tissue was wavy and the smallest strain at which it was imaged as flat. In all cases, the flattening occurred beyond the toe region, within the transition regime, Fig. 10. We found that LPs of Type II walls were flattened at lower strains in general than Type I walls.
Fig. 10.
Strain at which the undulations in the luminal surface (rugae) were lost for each of the nine cases. The two “×” marks for each case denote the strain (y-axis) at which the transition regime begins and ends. The “o” denotes the strain at which the luminal surface was flattened. Green, red and black correspond to wall types I, II, and II′, respectively.
3.6 Collagen fiber recruitment across the bladder wall
Fig. 11 shows the fiber recruitment with increasing strain as seen in projected stacks of MPM images from both the luminal side (row 1) and abluminal side (row 2). From the luminal side, both the flattening of the undulations as well as the straightening of the collagen fibers in the LP and onset of recruitment can be seen. From the abluminal side, highly coiled fibers can be seen in the DSM layer for the toe regime with gradual straightening of the collagen fibers with increasing strain.
Fig. 11.

Projected stacks of MPM images showing Adult04 as viewed from the luminal (row 1) and abluminal (row 2) sides. Panels one to three correspond to the toe, transition and high stress regimes, respectively. With increasing strain, undulations (rugae) of the mucosa on the luminal side are flattened (row 1), followed by straightening (recruitment) of the collagen fibers (column 3).
3.6.1 LP and DSM collagen recruitment is coordinated in extensible bladder walls
In order to understand the relative role of collagen recruitment in the DSM and LP layers during loading, we quantified the percentage of recruited collagen fibers from both the luminal (lamina propria) and abluminal sides (detrusor layer) and considered these with respect to the toe, transition and high stress regimes, Fig. 12. A representative fiber tracing for the abluminal side was shown in Fig. 3. The fraction of recruited fibers at 4 different strain points in each of the LP and DSM layers is shown in Fig. 12. Since the MPM images were performed independently on luminal and abluminal sides, the data for the LP and DSM layers are obtained at slightly shifted strains within each regime, and this is reflected in the horizontal location of the recruitment data within a regime.
Fig. 12.

Percentage of recruited collagen fibers for the LP layer (red) and DSM layer (blue) at different strain levels during biaxial loading for (a) Type 1 bladders, (b) Type II bladders. As in Fig. 6, the transition regime is delineated by a colored rectangle. For Type II walls, collagen fibers from the LP layer largely remained unrecruited throughout this transition regime while the DT fibers commenced recruitment within the transition regime. Even in the high strain regime, the LP fibers showed only little to moderate recruitment in Type II walls, with the exception of Aged04.
No fibers were recruited in the toe regime for any of the samples (n=9), Fig. 12. In Type I bladders, recruitment of collagen fibers was coordinated in the LP and DSM layers. In particular, collagen fibers from both the lamina propria and detrusor layer began to be recruited in the transition regime and most of the fibers were straightened in both layers in the high stress regime. For all Type II samples except one (Aged04), the recruitment of collagen in the LP and DSM layers was uncoordinated. Namely, few LP collagen fibers were recruited in the transition regime and the recruitment of DSM fibers dominated this regime. The premature recruitment of the DSM collagen continued through the high stress regime for these walls In contrast, the Type II bladder (Aged04) showed a coordinated fiber recruitment to Type I bladders and is referred to as Type II′ wall in further discussions and shown as dashed red lines in Fig. 7. The Type II′ wall (Aged04) had the earliest flattening of the LP layer, Fig. 10, and the shortest toe regime with ∊1(II′) = 0.11, Table 1.
3.7 Aged versus adult bladder
The bladders from the adult rats were more likely to be Type I (3 out of 4), whereas the aged bladders were generally Type II (4 out of 5). The aged bladders were thicker than the adult bladders (p=0.019) with averages of 0.89 ± 0.18 mm and 0.56 ± 0.09 mm. The Type I and Type II walls had average thicknesses of 0.56 ± 0.09 mm and 0.79± 0.12 mm, respectively. The Type II′ wall, an aged bladder, was substantially thicker than the other walls, with a thickness of 1.12 mm. In addition, we found the wall thickness of adult samples are negatively correlated (R2= -0.85) to their initial volume while the aged samples, except for the unusual case Aged04 (Type II′), showed the opposite trend (R2 = 0.95).
4 Discussion
The bladder is one of the most compliant organs in the body. For example, a normal rat bladder can expand to about three times its initial volume. The same passive components of the bladder wall, such as elastin and collagen fibers, are also found in the walls of other biological tissues. It is the wall architecture, or the way these components are combined, that must be responsible for the bladder's extensibility. In this work, we focus on the passive properties of the rat bladder wall in the absence of SMC active contraction. A custom designed planar biaxial system compatible with multiphoton microscopy was designed and used to directly investigate the relationship between bladder wall structure and wall extensibility during loading in fresh bladder samples from adult and aged rats.
To understand the changing roles of the wall layers during loading, we defined three regimes for the bladder mechanical loading curves: the toe regime, transition regime, and high stress regime. Since the bladder material stiffness increases so rapidly in the high stress regime the bladder extensibility is largely determined by the length of the toe and transition regimes, Fig. 7. Namely, the steep increase in wall stiffness in the high stress regime inhibits further substantial bladder expansion, essentially “locking in” the maximum bladder volume.
Two wall types- classified by extensibility
Within 5 aged samples and 4 adult samples, we identified for the first time, two types of bladder walls, defined by measures of their extensibility, ∊1 and ∊2. Type I walls have longer toe regions and later onset of the high stress regime compared with Type II and these differences reached statistical significance. The increased extensibility of Type I walls was shown to be largely due to significantly longer toe regimes than Type II bladders. The average length of the transition regime is also longer, but it does not reach statistical significance.
Mechanisms for long toe regimes
The high extensibility associated with longer toe regimes is only possible if both the inner (mucosa) and outer (DSM and adventitial) layers of the wall are both extensible. In this work, we showed the extensibility of the LP layer is due to folds (rugae) in the bladder wall. With increasing strain the LP gradually flattens with little resistance to load. In parallel, the LP collagen fibers become more planar and eventually begin to straighten. Importantly, the rugae do not fully flatten, nor does collagen recruitment commence until after the end of the toe regime (in the transition regime). Therefore, the bladder wall has two levels of undulations to provide extensibility: wall undulations (rugae) on the order of 100 microns, Fig. 9, as well as undulations in the collagen fibers themselves, on the order of tens of microns. This second level does not engage until after the rugae (first level) are flattened.
Previous work has suggested the high extensibility of the outer wall is provided by the architecture of the SMC bundles and collagen fibers. In particular, that in the unloaded bladder the SMC bundles are connected by wavy collagen fibers, (Chang et al. 1999). Hence, the reorientation and stretching of the SMC bundles as well as straightening of the wavy collagen fibers are mechanisms that provide high extensibility in the DSM layer. Our results are consistent with this conjecture. In particular, while we did not investigate the connection between the SMC bundles and collagen fibers in this work, we have shown the DSM collagen fibers were not recruited until the transition regime was reached. This is consistent with the proposed mechanism for large extensibility of this layer. A schematic of mechanisms for extensibility of the LP and DSM layers is shown in Fig. 14.
Fig. 14.
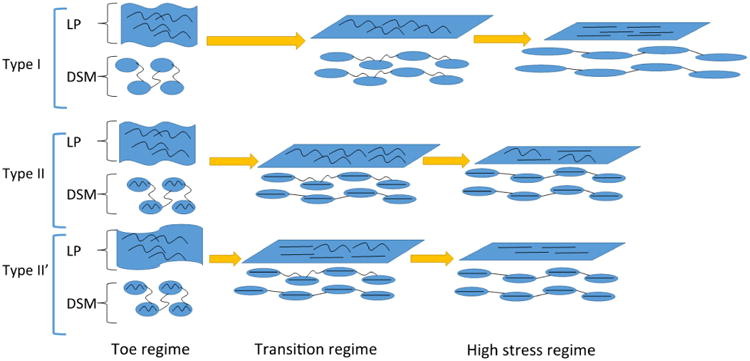
Schematic of the conjectured roles of collagen fibers in the LP and DSM layers by wall type. The current work suggests that in all wall types, extensibility in the toe regime is achieved by flattening of the rugae without collagen fiber recruitment. In the toe regime, the extensibility of the DSM is conjectured by Chang et al. (1998, 1999) to arise from the wavy nature of the collagen fibers connecting extensible SMC bundles (shown as ovals in the figure). Therefore, SMC bundles remain relatively unloaded in this regime. The current work demonstrated that in the transition regime of Type I walls, fiber recruitment was coordinated in the LP and DSM layers (both demonstrating gradual straightening). In contrast, in Type II walls, the toe region is cut short by early recruitment of the DSM collagen which, based on the work of Chang et al., is conjectured to arise from infiltration of fibers in the SMC bundles as well as other stiffening mechanisms (infiltrated collagen fibers schematically shown in SMC in II and II′ walls). As a result, complete recruitment of LP collagen fibers in Type II walls is inhibited, even in the high stress regime, as seen in the current study. and illustrated here. In Type II′ walls, although the LP and DSM fiber recruitment is coordinated, the rugae are flattened prematurely, resulting in the earliest recruitment (not shown). Nonetheless, collagen fibers in both the DSM and LP layers are ultimately recruited in the high stress regime as found in this study and illustrated here.
Mechanisms responsible for stiffening in the transition regime of Type I bladders
In the transition regime of Type I walls, the stress increase is due to the gradual fiber recruitment of fibers in both layers. Among all the Type I bladders, sample Adult02 has the shortest transition region. From the MPM images (not shown), it is clear that this is due to the abrupt collagen fiber recruitment of both LP and DSM layers. The fiber recruitment in the LP and DSM layers of all Type I are coordinated in that both layers demonstrate collagen recruitment that continues to substantial levels in the high stress regime, Fig. 12(a).
Physical mechanisms responsible for loss of bladder extensibility (Type II and Type II′ walls)
The central difference in the Type II and Type II′ walls compared with the Type I walls was the shortened toe regime. Since the toe regime is a region of high extensibility under low loads, even a small amount of loading of stiff collagen fibers will end this regime and force it to enter the transition regime. We found that Type II bladders have a shorter toe regime because the DSM fibers were straightened prematurely (lower strains than Type I walls), ending the toe regime and preventing extensive recruitment of LP collagen, Figs. 12. In contrast, in the Type II′ wall, fibers from both the LP and DSM layers were recruited prematurely, resulting in the earliest flatten of the LP among all the samples, Fig. 10. As result, this case had the shortest toe regime.
In Type II walls the early recruitment of DSM collagen fibers prevented the LP fibers from engaging and straightening In fact, large fractions of LP fibers remained unrecruited even in the high stress regime, Fig. 12(b). In Type II walls, the DSM collagen fibers will take a more dominant role than LP fibers in physiological and supraphysiological load bearing. In one sample (Aged01), we also saw a lack of coordination of fiber recruitment even within the DSM layer itself with some highly recruited fibers preventing continuing recruitment of other still highly tortuous fibers, Fig. 13. This is consistent with the unchanging fraction of recruited DSM fibers over the transition regime in that sample, Fig. 12(b).
Fig. 13.
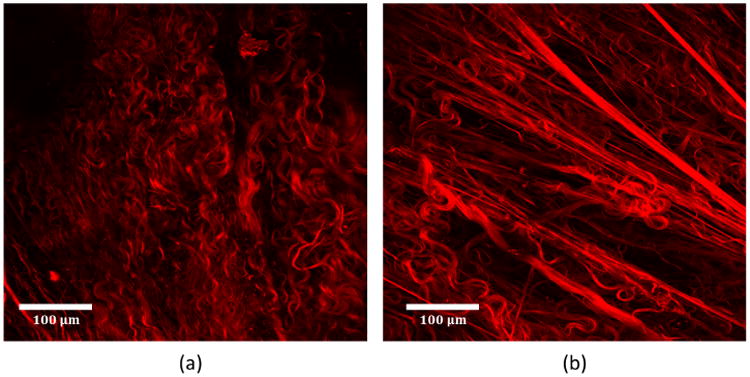
Collagen fibers in Type II wall (Aged01) as seen in projected stacks of abluminal MPM images (a) toe regime and (b) transition regime. Unbalanced fiber recruitment is seen in the DSM where some fibers are fully straightened and others are highly tortuous.
These findings suggest the DSM layer of Type II walls somehow lost one or more of the mechanisms for structural transformation to accommodate extension before fibers are recruited. Mure and Galdo found an increased ratio of type III to type I collagen in non-compliant bladders (Mure et al. 2004). Chang found that in normal bladder, type III collagen localization is largely confined to the interfascicular regions (between SMC bundles) of the detrusor while in non-compliant bladder, type III collagen is found not only in the intrafasciular region, but also within the smooth muscle bundles (Chang et al. 1999). The abnormal type III collagen fibers in the SMC bundles may be the cause of the earlier fiber recruitment because they could stiffen the SMC bundles, forcing earlier recruitment of the interfascicular fibers.
Overview of structure/function relationship
The relative roles of the collagen fibers in the LP and DSM layers, including conjectures regarding the role of the connection between SMC bundles and collagen fibers are shown in a schematic in Fig. 14. In the toe regime of all wall types, the LP is wavy and no fibers are recruited to load bearing. The DSM layers collagen fibers are drawn to shown an interconnection with smooth muscle bundles (following the conjecture of Chang et al. (1998) and further supported by recent work on murine bladder using MPM (Hornsby 2016)). As shown in the present work, during further loading of the Type I wall, the LP layer becomes flattened and collagen fibers in both layers are gradually recruited to load bearing. For Type II walls, the toe regime ends earlier than for Type I walls and the fiber loading is unsynchronized. For Type II walls, some of the DSM collagen fibers become load bearing prematurely inhibiting the strains needed for the collagen in the LP layer to become load bearing.
Effects of aging
The heterogeneous aging process seen across species (with some animals aging more rapidly than others, for example, or in different ways), can confound analysis. For this reason, we looked for wall types based on mechanical response, rather than trends with aging. Despite the small numbers of samples in this study, a high statistical significance was found, demonstrating a propensity for aged walls to be Type II and of increased thickness.
Extensibility, bladder capacity and bladder compliance
In this work, we have emphasized the need to consider bladder extensibility separately from bladder capacity and bladder compliance. Like other soft tissues such as arteries, the relationship between local stress and strain is highly nonlinear and cannot be captured with a single measure of stiffness. This is particularly important for the bladder, since the the bladder empties and fills during normal filling/voiding cycles. This is in contrast to, for example, an artery wall where the cyclic loading takes place about a largely inflated state.
Bladder compliance, which is often used in the literature on the biology of the bladder wall, is a linear approximation to the bladder pressure/volume relationship. In particular, it is defined as the slope of in vivo bladder volume versus pressure curves, from the unloaded bladder to the bladder capacity (near the leak point). This is a very rough approximation to the mechanical response of the entire bladder. It does not separate out the three regimes of loading, nor consider the wall properties independent of the response of the bladder as a whole. While compliance may be the most amenable measurement in vivo, there are some concerns when it is used ex vivo for assessment of the bladder wall. First, we have shown that the bladder capacity is dominated by the length the toe regime, (not even the stiffness in this regime). Secondly, we have found a bladder with a shorter toe region can compensate for low extensibility through an increase in bladder size. Namely, two bladders can have roughly the same compliance, yet one can have a shortened toe region due to uncoordinated recruitment of collagen in the LP and DSM layers.
Limitations and future directions
In this study, we focused attention on a population of male Fischer rats. In future studies, it will be important to extend this study to female rats as well as to human bladders. While, we would have liked to have increased the population size for this study even further, we were limited by the challenges associated with obtaining older rats as well as the time consuming aspects of the MPM analysis. Nonetheless, statistical significance was achieved relating wall type to structure of the extracellular matrix during loading.
The interconnection between layers is an interesting topic in the bladder wall as well as in other soft tissues, where it is also relatively unexplored. Recent work has, for example, explored these interconnections in the aortic wall in the context of delamination of wall layers (e.g. Pal et al. (2014)). We believe this interconnection will have only a secondary effect on loading mechanisms during inflation, though this is certainly of interest for future studies. The current work does not assume any level of importance on the role of these fibers during bladder filling.
Unlike the elastin content in arterial walls, there are no elastic layers (lamellae) in the bladder wall. Rather, the bladder elastin is found in the form of small quantities of fibers throughout the lamina propria, and in a loose network around the muscle fascicles (Murakumo et al. 1995). In this work, we have similarly found only small quantities of elastic fibers relative to collagen fibers and have not investigated their distinct role in load bearing.
To our knowledge, the rigorous approach used in Section 2.6 for attaining results that are independent of number of fiber tracings (similar to mesh independence studies) is unprecedented in fiber analysis of soft tissues. Furthermore, fiber length was found to have little impact on the results (Supplemental Material). In this regards, we would like to point out that the objective of fiber tracing in the current study is to identify percentage of fibers that are straightened. This is a less demanding challenge than identifying fiber tortuosity as a function of strain, such as was done in Hill et al. (2012).
Necessarily, this study was carried out ex-vivo. There is currently no method for measuring collagen recruitment across the wall layers in vivo. In the future, studies could be performed to evaluate recruitment in fixed, inflated bladders to provide further evidence to support the current findings. However, such studies would be limited by the need to consider different bladders for each loading level, rather than a single sample across all loading levels, such as was done in the present work. Future work could also explore the structural mechanisms behind bladder viscoelasticity and anisotropy (Nagatomi et al. 2004; Parekh et al. 2010).
5 Conclusions
This work has taken advantage of advances in bioimaging to directly assess collagen fibers and wall architecture during biaxial loading. It was directly shown for the first time, that the large extensibility of the bladder is determined largely by the length of the toe region of the loading curve, which arises from gradual flattening of the folds in the bladder wall. These rugae provide a mechanism for low resistance flattening without any discernible recruitment of collagen fibers throughout the toe regime. We have shown that, in contrast to prior conjectures on the bladder wall, that a coordinated recruitment of collagen across the LP and DSM layers is essential for the large extensibility of the bladder wall. In extensible bladder walls, the collagen fibers in both the lamina propria and detrusor layers contribute to limiting distension at higher filling pressures. Furthermore, wall extensibility can be lost by premature recruitment of collagen in the DSM that cuts short the toe region and prevents extensive recruitment of collagen fibers in the LP. Loss of bladder extensibility (Type II walls) was more common in the aged population. Knowledge of the mechanisms responsible for bladder compliance is essential for providing targets for improved diagnostics, developing novel medical treatments of bladder dysfunction, and for understanding the biomechanical environment of the intramural cells that drive changes in the bladder wall in health and disease.
Supplementary Material
Acknowledgments
The authors gratefully acknowledge the NIH National Institute on Aging for funding through 1R56 AG050408-01(PI Birder) as well as the aged rats used in this study. The authors also gratefully acknowledge Mr. Chih Yuan Chuang for performing the immunohistochemistry work to obtain Figure 5. The custom biaxial system and some preliminary data for the present work were previously described in the Proceedings of the 5th International Conference on Computational and Mathematical Biomedical Engineering - CMBE2017, Cheng et al. (2017).
Footnotes
7 Conflict of Interest: Four authors of the authors (Cheng, Birder, Kullmann, Robertson) received funding from that National Institute on Aging for this work. The authors have no additional conflicts to report.
8 Supplemental Material: We developed a method to evaluate measured mean straightness and recruited fiber percentage as a function of different bins of fiber length, Table 3. We tested this for one of the sample adult02 and found the variance (sample standard deviation) is less 1.7 %. Namely, the results were almost insensitive to the length of fibers that were traced.
References
- Abrams P, Cardozo L, Fall M, Griffiths D, Rosier P, Ulmsten U, Van Kerrebroeck P, Victor A, Wein A. The standardisation of terminology in lower urinary tract function: Report from the standardisation sub-committee of the International Continence Society. Urology. 2002;61(1):37–49. doi: 10.1016/s0090-4295(02)02243-4. [DOI] [PubMed] [Google Scholar]
- Aitken KJ, Bägli DJ. The bladder extracellular matrix. Part II: Regenerative applications. Nat Rev Urol. 2009;6(11):612–621. doi: 10.1038/nrurol.2009.202. [DOI] [PubMed] [Google Scholar]
- Alexander R. Mechanical properties of urinary bladder. Am J Physiol. 1971;220(5):1413–1421. doi: 10.1152/ajplegacy.1971.220.5.1413. [DOI] [PubMed] [Google Scholar]
- Ameda K, Sullivan MP, Bae RJ, Yalla SV. Urodynamic Characterization of Nonobstructive Voiding Dysfunction in Symptomatic Elderly Men. J Urol. 1999;162:142–146. doi: 10.1097/00005392-199907000-00035. [DOI] [PubMed] [Google Scholar]
- Andersson KE, McCloskey KD. Lamina propria: The functional center of the bladder? Neurourol Urodyn. 2014;33(1):9–16. doi: 10.1002/nau.22465. [DOI] [PubMed] [Google Scholar]
- Andersson KE, Wein AJ. Pharmacologic management of lower urinary tract storage and emptying failuren. In: Wein AJ, Kavoussi LR, Partin AW, Peters CA, editors. Campbell-Walsh Urol. 11th. Philadelphia, PA: Elsevier; 2011. pp. 1836–1874. chapter Pharmacolo. [Google Scholar]
- Beatty MF. Topics in finite elasticity: Hyperelasticity of rubber, elastomers, and biological tissues-with examples. Appl Mech Rev. 1987;40:1699–1734. [Google Scholar]
- Chang S, Chung J, Yeung M, Howard P, Macarak E. Roles of the lamina propria and the detrusor in tension transfer during bladder filling. Scand J Urol Nephrol Suppl. 1999;201(M):38–45. doi: 10.1080/003655999750042132. [DOI] [PubMed] [Google Scholar]
- Chang SL, Howard PS, Koo HP, Macarak EJ. Role of type III collagen in bladder filling. Neurourol Urodyn. 1998;17(2):135–45. doi: 10.1002/(sici)1520-6777(1998)17:2<135::aid-nau7>3.0.co;2-e. [DOI] [PubMed] [Google Scholar]
- Chen J, Drzewiecki BA, Merryman WD, Pope JC. Murine bladder wall biomechanics following partial bladder obstruction. J Biomech. 2013;46(15):2752–2755. doi: 10.1016/j.jbiomech.2013.07.022. [DOI] [PubMed] [Google Scholar]
- Cheng F, Robertson AM, Hornsby J, Birder L, Watkins S, Watton P. An experimental approach for understanding the layer dependent role of collagen recruitment during loading in the rat bladder wall. In: Nithiarasu P, Robertson A, editors. Proceedings of the 5th International Conference on Computational and Mathematical Biomedical Engineering - CMBE2017. Vol. 1. 2017. pp. 396–399. [Google Scholar]
- Ewalt DH, Howard PS, Blyth B, Snyder HM, Duckett JW, Levin RM, Macarak EJ. Is lamina propria matrix responsible for normal bladder compliance? J Urol. 1992;148(2 Pt 2):544–9. doi: 10.1016/s0022-5347(17)36650-8. [DOI] [PubMed] [Google Scholar]
- Fung YC. Elasticity of soft tissues in simple elongation. Am J Physiol. 1967;213(6):1532–1544. doi: 10.1152/ajplegacy.1967.213.6.1532. [DOI] [PubMed] [Google Scholar]
- Susset G, Jacques H, Regnier C. Viscoelastic properties of bladder strips: standardization of a technique. J Urol. 1981;18:445–450. [PubMed] [Google Scholar]
- Gloeckner DC, Sacks MS, Fraser MO, Somogyi GT, de Groat WC, Chancellor MB. Passive biaxial mechanical properties of the rat bladder wall after spinal cord injury. J Urol. 2002;167(May):2247–2252. [PubMed] [Google Scholar]
- Hald T, Horn T. The human urinary bladder in ageing. Br J Urol. 1998;82(1)(2):59–64. doi: 10.1046/j.1464-410x.1998.0820s1059.x. [DOI] [PubMed] [Google Scholar]
- Hill MR. PhD thesis. University of Pittsburgh; 2011. A Novel Approach for Combining Biomechanical and Microstructural Analyses to Assess the Mechanical Damage Properties of the Artery Wall. [Google Scholar]
- Hill MR, Duan X, Gibson GA, Watkins S, Robertson AM. A theoretical and non-destructive experimental approach for direct inclusion of measured collagen orientation and recruitment into mechanical models of the artery wall. J Biomech. 2012;45(5):762–71. doi: 10.1016/j.jbiomech.2011.11.016. [DOI] [PMC free article] [PubMed] [Google Scholar]
- Hornsby J. PhD thesis. University of Oxford; 2016. Bladder Microstructural and Biomechanical Modelling: in Vivo, in Vitro and in Silico. [Google Scholar]
- Kershen RT, Azadzoi KM, Siroky MB. Blood Flow, Pressure and Compliance in the Male Human Bladder. J Urol. 2002;168(1):121–125. [PubMed] [Google Scholar]
- Kim KM, Kogan BA, Massad CA, Huang YC. Collagen and elastin in the obstructed fetal bladder. J Urol. 1991;146(2 (Pt 2)):528–531. doi: 10.1016/s0022-5347(17)37844-8. [DOI] [PubMed] [Google Scholar]
- Kohan A, Danziger M, Vaughan E, Jr, Felsen D. Effect of aging on bladder function and the response to outlet obstruction in female rats. Urol Res. 2000:33–37. doi: 10.1007/s002400050007. [DOI] [PubMed] [Google Scholar]
- Murakumo M, Ushiki T, Abe K, Matsumura K, Shinno Y, Koyanagi T. Three-dimensional arrangement of collagen and elastin fibers in the human urinary bladder: A scanning electron microscopic study. J Urol. 1995;154:251–256. [PubMed] [Google Scholar]
- Mure PY, Galdo M, Compagnone N. Bladder function after incomplete spinal cord injury in mice: quantifiable outcomes associated with bladder function and efficiency of dehydroepiandrosterone as a therapeutic adjunct. J Neurosurg. 2004;100(1 Suppl Spine):56–61. doi: 10.3171/spi.2004.100.1.0056. [DOI] [PubMed] [Google Scholar]
- Nagatomi J, Gloeckner DC, Chancellor MB, DeGroat WC, Sacks MS. Changes in the biaxial viscoelastic response of the urinary bladder following spinal cord injury. Ann Biomed Eng. 2004;32(10):1409–1419. doi: 10.1114/b:abme.0000042228.89106.48. [DOI] [PubMed] [Google Scholar]
- Pal S, Tsamis A, Pasta S, Amore AD, Gleason TG, Vorp DA, Maiti S. A mechanistic model on the role of radially-running collagen fibers on dissection properties of human ascending thoracic aorta. J Biomech. 2014;47(5):981–988. doi: 10.1016/j.jbiomech.2014.01.005. [DOI] [PMC free article] [PubMed] [Google Scholar]
- Parekh A, Cigan AD, Wognum S, Heise RL, Chancellor MB, Sacks MS. Ex vivo deformations of the urinary bladder wall during whole bladder filling: Contributions of extracellular matrix and smooth muscle. J Biomech. 2010;43(9):1708–1716. doi: 10.1016/j.jbiomech.2010.02.034. [DOI] [PubMed] [Google Scholar]
- Pokrywczynska M, Gubanska I, Drewa G, Drewa T. Application of bladder acellular matrix in urinary bladder regeneration: The state of the art and future directions. Biomed Res Int. 2015;2015 doi: 10.1155/2015/613439. [DOI] [PMC free article] [PubMed] [Google Scholar]
- Sacks MS. Biaxial mechanical evaluation of planar biological materials. J Elast. 2000;61:199–246. [Google Scholar]
- Wognum S, Schmidt DE, Sacks MS. On the mechanical role of de novo synthesized elastin in the urinary bladder wall. J Biomech Eng. 2009;131(10):101018. doi: 10.1115/1.4000182. [DOI] [PubMed] [Google Scholar]
- Zeidel M. Obstructive Uropathy. In: Goldman L, Schafer A, editors. Goldmans Cecil Medicine. Elsevier; 2016. p. Chapt 123. [Google Scholar]
Associated Data
This section collects any data citations, data availability statements, or supplementary materials included in this article.


