

Abstract
The cellular composition of brains shows largely conserved, gradual evolutionary trends between species. In the primate spinal cord, however, the glia-neuron ratio was reported to be greatly increased over that in the rodent spinal cord. Here, we re-examined the cellular composition of the spinal cord of one human and one non-human primate species by employing two different counting methods, the isotropic fractionator and stereology. We also determined whether segmental differences in cellular composition, possibly reflecting increased fine motor control of the upper extremities, may explain a sharply increased glia-neuron ratio in primates. In the cynomolgus monkey spinal cord, the isotropic fractionator and stereology yielded 206–275 million cells, of which 13.3–25.1% were neurons (28–69 million). Stereological estimates yielded 21.1% endothelial cells and 65.5% glial cells (glia-neuron ratio of 4.9–5.6). In human spinal cords, the isotropic fractionator and stereology generated estimates of 1.5–1.7 billion cells and 197–222 million neurons (13.4% neurons, 12.2% endothelial cells, 74.8% glial cells), and a glia-neuron ratio of 5.6–7.1, with estimates of neuron numbers in the human spinal cord based on morphological criteria. The non-neuronal to neuron ratios in human and cynomolgus monkey spinal cords were 6.5 and 3.2, respectively, suggesting that previous reports overestimated this ratio. We did not find significant segmental differences in the cellular composition between cervical, thoracic and lumbar levels. When compared with brain regions, the spinal cord showed gradual increases of the glia-neuron ratio with increasing brain mass, similar to the cerebral cortex and the brainstem.
Keywords: spinal cord, quantification, isotropic fractionator, stereology, human, primate, glia neuron ratio, evolution
INTRODUCTION
After a long period of conflicting claims, the number of neurons and non-neuronal cells in the human brain has recently been clarified and a consensus has emerged (Azevedo et al., 2009; von Bartheld et al., 2016). However, uncertainty remains about the other major component of the central nervous system (CNS), the spinal cord, in terms of numerical composition, for both the human and the non-human primate spinal cord (Herculano-Houzel, 2017). Earlier estimates derived from indirect projections postulated that the human spinal cord contained 13.5 million neurons (based on extrapolation from dog spinal cords, Gelfan, 1963), 20 million neurons (based on extrapolation from monkey spinal cords, Herculano-Houzel et al., 2016) or one billion neurons (Kalat, 1998; also cited in Chudler, 2016). While numbers of neurons in the human spinal cord have to date only been estimated based on extrapolations and formulas derived from other species (Gelfan, 1963; Herculano-Houzel et al., 2016), one recent study used the isotropic fractionator to estimate the total number of cells in the spinal cord of eight non-human primate species (at 21–380 million), as well as the number of neurons (at 1.7–11.4 million, Burish et al., 2010). The latter work estimated only numbers of neurons and non-neuronal cells (the combination of glial cells and endothelial cells) and suggested an upper limit to the glia-neuron ratio (GNR) of nearly 40:1 (Burish et al., 2010). Such a GNR is more than one order of magnitude higher than that in rodent spinal cords (GNR of 2:1 to 3:1, Bjugn, 1993; Bjugn and Gundersen, 1993). Since other CNS components such as cerebral cortex, cerebellum, and rest of brain (brainstem) show a much more consistent or gradually changing GNR between species, including humans, the apparent wide fluctuations between species for GNRs in the spinal cord were surprising.
We here examined three questions: (1) Since numerical estimates of spinal cord cells in primates have to date been exclusively obtained by using the isotropic fractionator, we asked whether such estimates could be verified by using a stereology approach in conjunction with the isotropic fractionator method. (2) Could the surprising differences in GNR of the spinal cord between primates and rodents (and other non-mammalian vertebrates) be due to the emergence of fine motor control of the upper extremities, and related differences in cell composition between the cervical and the other segments of the spinal cord? (3) How does the GNR and the non-neuron to neuron ratio (nNNR) in the spinal cord compare with brain regions and with other species when brains become larger?
MATERIALS and METHODS
Human and animal tissues
Three spinal cords from cynomolgus monkey (Macaca fascicularis) and three human spinal cords were examined for this study. Macaque monkey (cynomolgus) spinal cords were obtained from Charles River Preclinical Services (Reno, NV). The Charles River Institutional Animal Care and Use Committee (IACUC) approved euthanization of monkeys (for reasons not related to this study), assuring compliance with the United States Department of Agriculture, Public Health Service Office of Laboratory Animal Welfare Policy and the Animal Welfare act. Monkeys were sedated with ketamine (10 mg/kg), then administered 0.7 ml Beuthanasia-D solution (pentobarbital sodium and phenytoin sodium) followed by exsanguination. The spinal cords were removed and placed in cold Krebs bicarbonate buffer of the following composition (in mM): 118.5 NaCl, 4.7 KCl, 2.5 CaCl2, 1.2 MgCl2, 23.8 NaHCO3, 1.2 KH2PO4, 11.0 dextrose for 30 min during the transport on ice to the University of Nevada, Reno. Spinal cords were then fixed in 4% paraformaldehyde for 24–48 hours at room temperature. We examined spinal cords from three female macaque (cynomolgus) monkeys with an average age of 3.4 years (range 3.1–3.6). The spinal cords weighed on average 3.8 g (range 3.7–3.9 g). The IACUC of the University of Nevada, Reno approved the tissue donations and use of tissues. The human spinal cords were obtained from the Anatomical Donation Program at the University of Nevada, Reno School of Medicine (tissues donated for research and teaching). Donors comprised two males and one female. The average age was 71.3 years (range: 64–80 years). None of the donors had any known neurodegenerative or neurological disease affecting the spinal cord. The postmortem interval was approximately 24 hours. Tissues were fixed using conventional formaldehyde fixation (arterial perfusion with a 2:1 dilution of 37% formalin, followed by several months of fixation and storage in a 1% formalin solution), or by embalming fluid fixation, Maryland state concentrate (arterial perfusion with a 2:1 dilution of 24–36 liters of 33.3% glycerin, 27.8% phenol, 33.3% methanol, 2.1% formaldehyde; fixation for several months in the same fixative, followed by storage in 95% ethanol). The spinal cords weighed on average 27.7 g (range: 24.6–33.3 g).
Tissue processing
Using scalpel blades, tissue samples of approximately 100 mg were dissected in a systematic random sampling scheme from the cervical, thoracic, and lumbar regions of the spinal cord and used for tissue processing according to the isotropic fractionator (IF) technique (Herculano-Houzel and Lent, 2005). Small segments (about 1–2 mm thick) were taken adjacent to tissue samples collected for IF and used for stereology. The weight of each sample was determined on a Sartorius BP 110 S balance prior to further tissue processing.
Isotropic Fractionator (IF) processing
Processing of tissues followed the protocol as previously described (Herculano-Houzel and Lent, 2005; Herculano-Houzel et al., 2015). In brief, tissue samples of 100 mg were homogenized in 1–2 ml standard solution (40 mM sodium citrate and 1% Triton X-100), using a Wheaton 15 ml glass tissue grinder until all visible fragments were dissolved. Homogenates were transferred to 15 ml conical tubes, along with the solution collected from several washes of the homogenizer. Tubes were centrifuged in an Eppendorf centrifuge (Model 5416) for 10 minutes at 4,000 g. Supernatants were collected and transferred to separate tubes and stained with 1% 4′6-diamidino-2-phenylindole (DAPI, Invitrogen) to verify that no nuclei remained in the supernatant, allowing to conclude that all nuclei were contained within the pellet. The nuclear pellets were resuspended in phosphate-buffered saline (PBS) with 1% DAPI. This mixture was agitated throughout the procedure to prevent sedimentation. Aliquots of 5 μl were loaded onto a hemocytometer (Reichert Bright-Line). Counts of cell nuclei were performed per manufacturer’s instructions by using boundary lines to calculate the applicable volumes of each chamber. Counts were repeated 20 times, resulting in a coefficient of error (CE) of less than 0.1. Average nuclear density was multiplied by total suspension volume and divided by sample weight to obtain the number of nuclei (and by extension, number of cells) per mg tissue. To estimate total neuron number, 500 μl was removed from the suspension and nuclei were collected by centrifugation, and resuspended in a 0.2 M solution of boric acid, (pH 9.0), and heated for 1 h at 75°C. Nuclei were again centrifuged, washed in PBS, and incubated overnight at room temperature with anti-NeuN mouse IgG (1:300 in PBS; EMD Millipore, Billerica, MA). They were washed in PBS, and incubated in cyanine 3-conjugated goat anti-mouse IgG secondary antibody (Life Technologies, 1:400 in 40% PBS, 10% goat serum, and 50% DAPI) for 2 hours, centrifuged, washed in PBS, and then suspended in a small volume of PBS for observation in a Neubauer counting chamber on a fluorescent microscope (Nikon Eclipse E600). We counted a minimum of 500 DAPI-stained nuclei for each sample. The proportion of NeuN-positive nuclei was determined separately for each region of the spinal cord and multiplied by the total number of nuclei to yield total number of neurons in each segment. The total number of “non-neuronal nuclei” was calculated by subtracting the number of NeuN-containing nuclei from the total number of nuclei. Since the NeuN antibody did not work reliably in the human tissue, the fraction of neuron numbers for the human spinal cord was estimated based on morphological data obtained in the adjacent tissues (see below).
Paraffin embedding, sectioning and counting
Fixed tissue samples were dehydrated in an ascending alcohol series and embedded in Paraplast Plus Tissue Embedding Medium (McCormick Scientific). Samples were sectioned exhaustively into sections of 25–35 μm thickness using a rotary microtome (AO Spencer 820). Every 10th section was collected in a water bath at 45°C on Surgipath pre-cleaned Micro Slides Snow Coat X-tra glass slides or silane-coated glass slides (Fisherbrand, Fisher Scientific). The sections were dried for at least 24 hours at 45–48°C, were then deparaffinized and stained for 2–5 min with hematoxylin (7.5% Hematoxylin Accustain™, Harris hematoxylin solution, modified, Sigma) and for 1 min with eosin (0.2% Eosin Y solution, intensified, Eosin Protocol™, Fisher Scientific). The hematoxylin-eosin stain was used, because it was shown to be equally effective as Nissl stains in discerning small dorsal horn neurons in the spinal cord, which have a very low content of rough endoplasmic reticulum (Nathaniel and Nathaniel, 1966; Bjugn and Gundersen, 1993), and also because hematoxylin-eosin produced advantageous differential staining of the entire vascular system in some of the serial sections. The microtome’s section advance was verified to be accurate within 6% of the nominal section thickness. All sections were dehydrated, cleared in xylene and mounted with Di-N-Butyl Phthalate in xylene (DPX, Electron Microscopy Sciences, refractive index = 1.52) under cover glasses (Corning, 11/2, 170 μm thick). At least six sections from each spinal cord were used for sampling, and in each of those sections 8–12 counting boxes (100 μm × 100 μm × section thickness) were applied. In each counting box, 16–40 particles were sampled, with 750–900 nuclei counted for each segment, and about 2,400 nuclei for each spinal cord. An analysis of the distribution of particles in the z-axis was performed on a total of 38 sections, to determine the position of approximately 700 particles in the section, to ensure optimal placement of guard zones (Hatton and von Bartheld, 1999; Gardella et al., 2003; von Bartheld, 2012). These analyses showed differential compression with enhanced densities of particles at the tissue margins, as expected for paraffin sections (Fig. 1). Accordingly, guard zones (which are recommended only in cases of lost caps, Baryshnikova et al., 2006) were not used, because there was no evidence of lost caps. Sections of a final thickness of 22.5 ± 7.8 μm (SD, n=20, monkey) and 31.4 ± 8.2 μm (SD, n=18, human) were examined at a magnification of 1,000-fold on a Nikon Optiphot microscope equipped with a z-axis encoder (MFC-1 from Applied Scientific Instrumentation), a 100× oil objective (NA= 1.25) and a 10× eye piece. Data were analyzed using Nikon NIS elements software version 4.0. The program’s graticule was used to perform systematic random sampling of fifty 10,000 μm2 areas and to count stained nuclei, using an unbiased counting rule (Schmitz and Hof, 2005). Unbiased counting rules are designed to ensure that the number of particles scored within the counting box is indeed representative of the volume of the sample, and avoids double-counting of nuclei or nucleoli (Williams and Rakic, 1988). The total area of each section was estimated by using NIS software’s area function, by drawing a line around the section perimeter as seen with a 2× objective, and letting the program automatically calculate the area. We multiplied the average nuclear density by the average section area and the number of sections cut. This was divided by the tissue sample weight to obtain the number of nuclei per mg sample tissue weight. We estimated the percentage of presumptive endothelial cell nuclei within systematic random samples by counting 100 cells in histological sections and determining how many of them met our criteria for endothelial cells, including elongation of cells and association with blood vessels. To determine whether cell ratios differed significantly between segments of the spinal cord, we compared them using single factor ANOVA. To determine whether the two methods gave different results for total cell numbers or for neuron numbers, we used paired, two-tailed Student’s t-test.
Fig. 1.
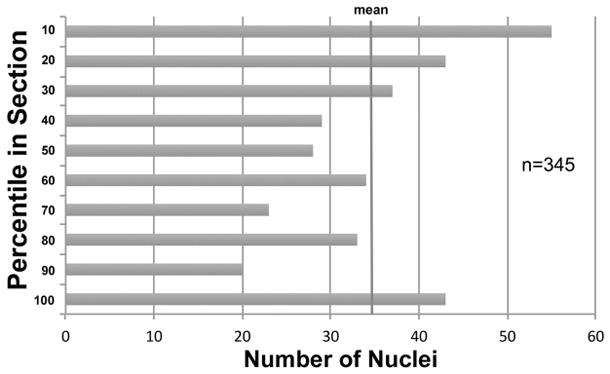
Distribution of nuclei in the z-axis of tissue sections. The center of the nucleus of 345 cells was measured in 18 sections, and their distribution was plotted for 10-percentile bins, with the “10” percentile bin being the top of the tissue section (against the cover glass), and the bottom (“100”) percentile bin adjacent to the glass slide. There was no loss of caps at the tissue margins, but rather an increased density of nuclei, indicating differential compression. The measurements for human tissue sections (mean final thickness of 31.4 μm) of the spinal cord are shown, and the z-axis analysis was similar for monkey sections. Accordingly, no guard zones were used, since they would have caused an underestimate due to predominant sampling in the low-density core of the tissue section.
Survey of glia-neuron ratios (GNRs) and non-neuronal-neuron ratios (nNNRs) from previously published work
To compare our data on GNRs and nNNRs in the spinal cord with those from other CNS regions (cerebral cortex, cerebellum, rest of brain), we compiled data for the same and other vertebrate species from the literature. These data points were from either histological/stereological or isotropic fractionator studies, primarily from the labs of Bjugn, Friede, Haug, Herculano-Houzel, Kaas, Pakkenberg, Sherwood, and Stolzenburg, and included data from species such as frog, mouse, shrew, mole, rat, rabbit, monkey, dolphin, seal, human, elephant, and whale, among others, as indicated in the Tables. The GNRs and nNNRs were plotted on a log scale over brain mass, and the slopes of GNRs and nNNRs were calculated and compared for different CNS regions, using linear regression models through Statistical Analysis Systems (SAS 9.4).
The relationship between the glia-neuron ratio (GNR) and the non-neuronal-neuron ratio (nNNR) for cerebral cortex, brain stem and cerebellum
We determined both the GNR and the nNNR, depending on the type of counting method used. The distinction between these two ratios is important. Figure 2 illustrates the differences and the relationship between the two ratios. Stereology is a histological counting method that identifies and distinguishes glial cells from neurons; it allows – with some caveats (small neurons may be difficult to discern from glial cells) – to compare numbers of glia with numbers of neurons, thus resulting in a GNR for the structure examined. The isotropic fractionator (IF) collects the nuclei from all three major types of CNS cells (glia, neurons and endothelial cells), and then identifies among all the cells those that are neurons, based on staining with a neuron-specific antibody. Accordingly, the number of neurons is established, as well as the number of all non-neuronal cells (glia and endothelial cells combined). Therefore, the IF only establishes an nNNR for the CNS structure, but not a GNR. The nNNR, however, sets an upper limit for the GNR, and the GNR can be estimated when the relative fraction of endothelial cells and glial cells among the total number of non-neuronal cells is known (typically between 12% and 30% of all non-neuronal cells, depending on the structure, Nurnberger, 1958; Blinkov and Glezer, 1968; Brasileiro-Filho et al., 1989; Bjugn and Gundersen, 1993; Davanlou and Smith, 2004; Lyck et al., 2009; Garcia-Amado and Prensa, 2012; Bahney and von Bartheld, 2014; reviewed in: von Bartheld et al., 2016). The nNNR is always larger than the GNR, but by a relatively small and predictable percentage, as shown in Figure 2 for three brain regions.
Fig. 2.

The three pairs of graphs demonstrate the differences between the glia-neuron ratio (GNR) and the non-neuronal to neuron ratio (nNNR), exemplified for three brain structures: Cerebral Cortex, Cerebellum and “Rest of Brain” (Diencephalon and Brainstem). Histological counting methods such as stereology determine the number of neurons (blue) and glial cells (red), while the isotropic fractionator (IF) determines numbers of neurons and non-neuronal cells, the latter being composed of both glial (red) and endothelial cells (green). Since the endothelial cells make up between 12% and 30% of all non-neuronal cells, the nNNR is only modestly larger than the GNR, as illustrated in three typical examples: Cerebral cortex, brainstem, and cerebellum. The numbers of the three cell types are chosen to demonstrate simple math and ratios, but roughly reflect the known ratios in the selected three brain regions. Note that the nNNR increases over the GNR merely from 2 to 3 in cortex, from 10 to 15 in rest of brain, and from 0.1 to 0.25 in cerebellum.
RESULTS
Cell numbers in a non-human primate spinal cord (cynomolgus monkey, Macaca fascicularis)
Isotropic Fractionator (IF)
We estimated the average number of cell nuclei in the spinal cord to be 275 million ± 55.5 million (SD, n=3), with a range of 230–337 million cells (Table 1). The percentage of NeuN-labeled cell nuclei among all cell nuclei was 21.5–28.2%, with a mean of 25.1%. Accordingly, the number of neurons in the spinal cord is about 69 million.
Table 1.
Estimates of cell numbers and ratios in the cynomolgus monkey spinal cord
| Isotropic Fractionator (IF) | |||||||||
|---|---|---|---|---|---|---|---|---|---|
| Segment | Cell # ±SD million | range million | nN % | neuron % | nNNR ± SD | segment comparison | p-value | significant? | |
| Cervical (c) | 82.7 ± 18.2 | 68–103 | 74.3 | 25.7 | 3.0 ± 0.75 | c. vs th. | 0.26 | n.s. | |
| Thoracic (th) | 118.0 ± 6.2 | 111–120 | 78.5 | 21.5 | 3.7 ± 0.42 | c. vs lu. | 0.75 | n.s. | |
| Lumbar (lu) | 74.3 ±42.6 | 42–122 | 71.8 | 28.2 | 2.8 ± 0.92 | c. vs th.+ lu. | 0.71 | n.s. | |
|
| |||||||||
| Total | 275 ±55.5 | 230–337 | 74.9 | 25.1 | 3.2 ± 0.47 | ||||
|
| |||||||||
| Stereology | |||||||||
| Segment | Cell # ± SD million | range million | glia % | neuron % | endo % | GNR ± SD | segment comparison | p-value | significant? |
|
| |||||||||
| Cervical (c) | 67.6 ± 15.6 | 49–78 | 66.9 | 10.4 | 22.6 | 7.3 ± 3.61 | c. vs th. | 0.41 | n.s. |
| Thoracic (th) | 89.7 ± 10.9 | 83–102 | 68.4 | 12.9 | 18.7 | 5.3 ± 0.85 | c. vs lu. | 0.25 | n.s. |
| Lumbar (lu) | 48.9 ± 7.9 | 40–54 | 61.3 | 16.7 | 22.0 | 4.2 ± 1.95 | c vs th.+lu. | 0.16 | n.s. |
|
| |||||||||
| Total | 206.2 ± 31.2 | 172–334 | 65.5 | 13.3 | 21.1 | 5.6 ± 1.57 | |||
Abbreviations: c, cervical; endo, endothelial cell; GNR, glia-neuron ratio; lu, lumbar; nN, non-neuronal cell; nNNR, non-neuron to neuron ratio; n.s., not significant; SD, standard deviation; th, thoracic.
Stereology
Examples of stained histological sections for the monkey spinal cord are shown in Figure 3A–B. Note that the entire vascular system, including the smallest capillaries, was stained with an orange hue, which greatly facilitated identification of endothelial cells. Based on the stereology approach, we estimated the average number of cell nuclei in the spinal cord to be 206 million ± 31.2 million (SD, n=3), with a range of 172–334 million cells (Table 1). According to our stereology data, we estimated that the average percentage of neuronal nuclei in the entire spinal cord was 13.4% of the total cell number (27.4 million neurons, based on a total cell number of 206 million). This percentage is significantly less (p=0.015) than that of NeuN-labeled cell nuclei in the IF protocol, indicating that, as already mentioned, many small neurons (up to 11.7% of all cells) in the spinal cord may be mis-classified as glial cells in histological sections. The average percentage of endothelial cells in the entire spinal cord was 21.1% of all cells, and other cells (presumed to be glial cells) was estimated to be 65.5% of all cells in the whole spinal cord (Table 1). Regarding segmental regions, the average percentage of neurons ranged from 10.4% (cervical) to 16.7% (lumbar), the average percentage of endothelial cells ranged from 18.7% (thoracic) to 22.6% (cervical), and the average percentage of glia ranged from 61.3% (lumbar) to 68.4% (thoracic), as shown in Table 1.
Fig. 3A–D.

Representative photomicrographs of neurons, glial cells and endothelial cells in the spinal cord of cynomolgus monkey (A–B) and human spinal cord (C–D). Panels A, B and C show neurons and glial cells, panels A, B and D show endothelial cells (indicated by arrows). Panels A and B are from the ventral horn in the cervical spinal cord, panel C is from the ventral horn of the thoracic cord, and panel D is from the white matter of the thoracic cord (anterior corticospinal tract). Paraffin-embedded tissue sections were stained with hematoxylin-eosin. Scale bar (shown in panel C, same magnification for all panels) = 20 μm. Note that in panels A and B, all blood vessels (including capillaries) show a distinct orange color, unlike the pink neuropil, thereby facilitating the identification of endothelial cells.
The total cell numbers estimated by IF and stereology were not significantly different (p=0.215, t-test). Neuron numbers estimated by the two methods were significantly different, with the IF yielding 69.4 million neurons vs. 27.4 million by stereology (p=0.015), likely because of the difference in the percentage identified as neurons, as mentioned above.
Nonneuronal-neuron ratio (nNNR) and glia-neuron ratio (GNR) in a non-human primate spinal cord
Isotropic Fractionator
The IF provides the information to calculate the ratio of non-neuronal versus neuronal cell types. The total number of spinal cord cells according to the IF was a mean of 275 million. When one subtracts the number of neurons (69 million), there are 206 million non-neuronal cells. Dividing those by neurons (69 million) yields an nNNR of 3.2 (3.2 ± 0.47, SD, see Table 1).
(nNNR, nonneuronal to neuron ratio; TC, total cell number; N, neuron number)
Stereology
Based on the percentages of cell types obtained from our histology data, we directly calculated the GNR for the spinal cord: 65.54 divided by 13.35 = 4.9. That is the traditional, histology-based GNR, with the caveat that some small neurons and glia cannot be distinguished with certainty (see above). When the information from the IF procedure is taken into account (an additional 11.7% of all cells may be neurons rather than glia), the GNR is 2.1. When stereology data was used to calculate the nNNR, 206 million cells minus 13.4% neurons = 178.4 million non-neuronal cells, divided by 27.6 million neurons, this yields an nNNR of approximately 5.6 (5.6 ± 1.57, SD, see Table 1). This stereology-derived nNNR is larger than that obtained by the IF (about 3), presumably because with stereology, a significant number of small neurons are classified as glial cells (Bjugn and Gundersen, 1993).
Segmental analysis of the spinal cord in a non-human primate spinal cord
We examined the possibility of segmental differences in cell ratios in the cynomolgus spinal cord, because a previous study of primate spinal cords (Burish et al., 2010) reported a much larger nNNR than would be expected based on published GNRs for rodents (Bjugn, 1993; Bjugn and Gundersen, 1993). As shown in Table 1, the IF-derived percentages of non-neuronal cells (71.8–78.5%) and neuronal cells (21.5–28.2%) differed little, and resulted in nNNRs for the cervical, thoracic and lumbar spinal cords of 3.0, 3.7, and 2.8, respectively. The differences between ratios were statistically not significant (Table 1). Likewise, the percentages of glia and neurons based on stereology ranged between 61.3% and 68.4% for glia, and between 10.4% and 16.7% for neurons, with GNRs for the cervical, thoracic and lumbar levels of 7.3, 5.3, and 4.2, respectively. Despite a trend for larger GNRs in the cervical spinal cord, statistically, these ratios were not significantly different from each other (Table 1).
Cell numbers, nonneuronal-neuron ratio (nNNR) and glia-neuron ratio (GNR) in the human spinal cord
Isotropic Fractionator (IF)
Using the IF procedure, we estimated the average number of cell nuclei in the spinal cord to be 1.66 billion ± 251.8 million (SD, n=3), with a range of 1.4–1.9 billion cells. Since the neuron-specific antibody did not work reliably in the fixed human tissue, we could only establish the total cell number, but not the neuron number by using the isotropic fractionator (IF) protocol. However, we could estimate total neuron numbers and the GNR and nNNR by combining IF data (for total cell numbers) with the information about percentages of cell types in adjacent tissue, obtained through the stereology approach. The nNNR was calculated by adding to the number of glial cells (1.160 billion) all endothelial cells (182.9 million) to get the sum of 1.343 billion non-neuronal cells, and dividing this by the number of neurons in the spinal cord (195–221 million):
(nNNR, nonneuronal to neuron ratio; G, number of glial cells; E, number of endothelial cells; N, number of neurons)
This amounts to an nNNR of about 6.5 (6.51 ± 1.03, SD, see Table 2). The segmental analysis showed that the percentage of non-neuronal cells ranged from 86.0% to 87.4%, and the percentage of neurons (based on morphology) was between 12.6% and 14.0%. The nNNR was 7.25, 5.33, and 6.94 for the cervical, thoracic and lumbar spinal cord, respectively. There were no statistically significant differences in the nNNR between segments (for details, see Table 2).
Table 2.
Estimates of cell numbers and ratios in the human spinal cord
| Isotropic Fractionator (IF) (cell types based on morphology) | |||||||||
|---|---|---|---|---|---|---|---|---|---|
| Segment | Cell # ± SD million | range million | nN % | neuron % | nNNR ± SD | segment comparison | p-value | significant? | |
| Cervical (c) | 535.5 ± 98.9 | 424–615 | 86.5 | 13.5 | 7.2 ± 2.91 | c. vs. th. | 0.34 | n.s. | |
| Thoracic (th) | 670.3 ± 131.9 | 557–815 | 86.0 | 14.0 | 5.3 ± 1.03 | c. vs lu. | 0.87 | n.s. | |
| Lumbar (lu) | 457.9 ± 97.7 | 350–539 | 87.4 | 12.6 | 6.9 ± 0.60 | c. vs th.+lu. | 0.42 | n.s. | |
|
| |||||||||
| Total | 1,660 ± 251.8 | 1,400–1,900 | 86.6 | 13.4 | 6.5 ± 1.03 | ||||
|
| |||||||||
| Stereology | |||||||||
| Segment | Cell # ±SD million | range million | glia % | neuron % | endo % | GNR ± SD | segment comparison | p-value | significant? |
|
| |||||||||
| Cervical (c) | 479.6 ± 33.4 | 445–519 | 80.5 | 13.5 | 6.8 | 7.1 ± 2.94 | c. vs th. | 0.54 | n.s. |
| Thoracic (th) | 544.4 ± 57.9 | 486–602 | 72.6 | 14.0 | 13.4 | 5.7 ± 2.42 | c. vs lu. | 0.42 | n.s. |
| Lumbar (lu) | 445.4 ± 76.0 | 367–511 | 71.2 | 12.6 | 16.3 | 5.6 ± 0.47 | c. vs th.+lu. | 0.33 | n.s. |
|
| |||||||||
| Total | 1,469 ± 50.3 | 1,298–1,575 | 74.8 | 13.4 | 12.2 | 6.1 ± 0.86 | |||
Abbreviations: c, cervical; endo, endothelial cell; GNR, glia-neuron ratio; lu, lumbar; nN, non-neuronal cell; nNNR, non-neuron to neuron ratio; n.s., not significant; SD, standard deviation; th, thoracic.
Stereology
Using stereology, we estimated the average number of cell nuclei in the spinal cord to be 1.47 billion ± 148.9 million (SD, n=3), with a range of 1.3–1.6 billion cells. The glia-neuron ratio (GNR) in the human spinal cord was calculated to be about 6 (6.15 ± 0.86, SD, Table 2). The segmental analysis showed that the percentage of glia ranged from 71.2% to 80.5%, and the percentage of neurons (based on morphology) ranged from 12.6% to 14.0%. The GNR was 7.25, 5.33, and 6.94 for the cervical, thoracic and lumbar spinal cord, respectively (Table 2). There were no statistically significant differences in the GNR between segments (Table 2). There were no statistically significant differences in total cell numbers between the two methods (p=0.314, t-test).
Survey of GNRs and nNNRs from other CNS parts and species
Whether GNRs increase with increasing brain mass is controversial (Stolzenburg et al., 1989; Nedergaard et al., 2003; Marino, 2006; Sherwood et al., 2006; Herculano-Houzel et al., 2007; Herculano-Houzel, 2011). To place our data on cell numbers and ratios in the spinal cord of human and non-human primates in a larger comparative and evolutionary context, we compiled data from previous quantitative studies on spinal cords and three other CNS parts: cerebral cortex, cerebellum, and rest of brain (brainstem). We list all GNRs and nNNRs that were available in the literature in Tables 3 and 4, sorted by the total brain mass for each species. We then graphed each data point for either GNRs or nNNRs against brain mass on a logarithmic scale and applied linear regression models, using the formula y = α + β ln (x), where y is GNR or nNNR, α is the intercept, β is the slope, and x is brain mass. In the formula, x was transformed to natural logarithm (ln), and the slopes of GNRs and nNNRs were compared (Fig. 4A–F). The obvious outliers (indicated as red squares in Fig. 4B, D) were excluded from the model. As can be seen in the Figure 4A–F, the GNRs and nNNRs gradually increased with increasing brain mass in most CNS regions: cerebral cortex, rest of brain, and spinal cord, but not in cerebellum. The slope of GNRs with increasing brain mass was +0.39 for cerebral cortex, and +0.50 for spinal cord. The slope for nNNRs with increasing brain mass was +0.25 for cerebral cortex, +0.93 for rest of brain, and +0.33 for spinal cord, with outliers removed. There was no correlation between the brain mass and the nNNR for the cerebellum. Accordingly, there is a strong positive correlation of GNRs and nNNRs with brain mass in most CNS structures. The data from two previous studies on nNNRs do not fit with the other data: The nNNRs from a recent elephant study (Herculano-Houzel et al., 2014) were significantly higher for cerebral cortex and for rest of brain than would have been expected based on the GNRs and nNNRs among other species (Fig. 4B, D); and all the nNNRs for spinal cords from one study (Burish et al., 2010) were significantly higher and the slope significantly steeper (+6.63, p=0.0012) than expected based on other species’ GNRs and nNNRs for spinal cord with slopes between +0.25 and +0.93 (Fig. 4E, F). Possible reasons for these discrepancies are considered in the Discussion. Overall, we conclude that ratios of cell types (GNRs and nNNRs) in the spinal cord of primates are similar to those of the brainstem (“rest of brain,” Fig. 2), but differ from the ratios in the entire primate brain (Fig. 5).
Table 3.
Glia-neuron ratios (GNRs) for cerebral cortex, cerebellum and spinal cord in different vertebrate species
| Common Name | Latin Name | Brain weight (g) | GNR | References |
|---|---|---|---|---|
| Cerebral Cortex | ||||
| Frog | (Rana temporaria) | (0.1) | 0.25 | Friede, 1954 |
| Pygmy white-toothed shrew | Suncus etruscus | 0.1 | 0.15 | Stolzenburg et al., 1989 |
| Hoy’s pygmy shrew | Microsorex hoyi | 0.1 | 0.30 | Stolzenburg et al., 1989 |
| Mouse | (0.4) | 0.29–0.42 | Friede, 1954 | |
| European mole | Talpa europaea | 1.0 | 0.62 | Stolzenburg et al., 1989 |
| European mole | Talpa europaeus | 1.4 | 0.84 | Haug, 1987 |
| Rat (Wistar) | Rattus norvegicus | 2.0 | 0.51 | Davanlou & Smith, 2004 |
| Chicken | (3.0) | 0.46 | Friede, 1954 | |
| Hedgehog | Erinaceus europaeus | 3.7 | 1.89 | Haug, 1987 |
| Giant otter shrew | Potamogale velox | 3.9 | 1.2 | Stolzenburg et al., 1989 |
| Checkered elephant shrew | Rhynchocyon cirnei | 5.7 | 0.75 | Stolzenburg et al., 1989 |
| Opossum | Didelphis virginiana | 7.8 | 1.88 | Haug, 1987 |
| Marmoset | Callithrix jacchus | 9.4 | 2.67 | Haug, 1987 |
| Rabbit | (Oryctolagus cuniculus) | (12) | 0.32–0.49 | Friede, 1954 |
| Cat | Felis domestica | 28.7 | 0.80 | Haug, 1987 |
| Talapoin | Cercopithecus talapoin | 36 | 0.58 | Haug, 1987 |
| Rhesus macaque | Macaca mulatta | 96.1 | 0.82 | Lidow & Song, 2001 |
| Rhesus macaque | Macaca mulatta | 86–96 | 0.56 | Christensen et al., 2007 |
| Moore macaque | Macaca maura | (90–97) | 0.7–1.3 | Sherwood et al., 2006 |
| Harbor porpoise | Phocoena phocoena | 219–248 | 2.34 | Walloe et al., 2010 |
| Chimpanzee | Pan troglodytes | (384–420) | 0.9–1.5 | Sherwood et al., 2006 |
| Chimpanzee | Pan troglodytes | 433 | 0.72 | Haug, 1987 |
| Common porpoise | Phocaena phocaena | 483 | 5.67 | Haug, 1987 |
| Harp seal | Pagophilus groenlandicus | 542 | 2.87 | Walloe et al., 2010 |
| Common dolphin | Delphinus delphinus | 715 | 3.55 | Haug, 1987 |
| Bottlenosed dolphin | Tursiops truncatus | 1345 | 2.88 | Haug, 1987 |
| Human | Homo sapiens | (1300–1400) | 1.66 | Sherwood et al., 2006 |
| Human | Homo sapiens | 1400 | 1–2 | von Bartheld et al., 2016 |
| Minke whale | Balaenoptera acutorostrata | (2700) | 7.67 | Eriksen & Pakkenberg, 2007 |
| Pilot whale | Globicephala melas | 3062–4618 | 3.41 | Mortensen et al., 2014 |
| Elephant | Loxodonta africana | 4148 | 6.86 | Haug, 1987 |
| Minke whale | Balaenoptera physales L. | 6500–7150 | 4.54 | Hawkins & Olszewski, 1957 |
|
| ||||
| Cerebellum | ||||
| Rat | Rattus norvegicus | (2) | 0.30 | Giuffrida et al., 1979 |
| Rat | Rattus norvegicus | (2) | 0.06 | Korbo et al., 1993 |
| Human | Homo sapiens | (1220) | 0.03 | Andersen et al., 1992 |
| Human | Homo sapiens | 1409 | (0.035) | Andersen et al., 2003 |
| Human | Homo sapiens | 1220 | (0.057) | Andersen et al., 2012 |
|
| ||||
| Spinal Cord | ||||
| Northern leopard frog | Rana pipiens | (0.1) | 0.78 | Chvatal et al., 2001 |
| Albino mouse | Mus musculus | (0.4) | 2.28 | Bjugn, 1993 |
| Red-eared turtle | Trachemys scripta elegans | (0.5) | 2.61 | Walloe et al., 2011 |
| Rat (Wistar, female) | Rattus norvegicus | (2) | 2.72 | Bjugn & Gundersen, 1993 |
| Monkey | Macaca fascicularis | (75) | 2.1–4.9 | Current Study |
| Human | Homo sapiens | (1300) | 6.1–6.9 | Current Study |
(), estimated numerical values or most likely species names (when not disclosed in the original publication).
Table 4.
Non-neuron to neuron ratios (nNNRs) of different CNS parts among vertebrate species
| Species | Latin name | Brain mass | Cerebral cortex | Cerebellum | Rest of brain | Spinal cord | References |
|---|---|---|---|---|---|---|---|
| Smoky shrew | Sorex fumeus | 0.2 | 1.01 | 0.25 | 1.48 | Sarko et al., 2009 | |
| Short tailed shrew | Blarina brevicauda | 0.4 | 1.00 | 1.96 | Sarko et al., 2009 | ||
| Mouse | Mus musculus | 0.4 | 0.88 | 0.17 | 1.25 | Herculano-Houzel et al., 2006 | |
| Mouse | Mus musculus | 0.5 | 3.4 | 0.23 | 3.7–3.9 | 4.05 | Fu et al., 2013 |
| Golden mole | Amblysomus h. | 0.8 | 0.98 | 0.24 | 1.84 | Neves et al., 2014 | |
| Hairy-tailed mole | Parascalops breweri | 0.8 | 2.81 | 0.07 | 4.42 | Sarko et al., 2009 | |
| Star-nosed mole | Condylura cristata | 0.8 | 1.93 | 0.18 | 3.85 | Sarko et al., 2009 | |
| Hamster | Mesocrycetus | 1.0 | 2.41 | 0.12 | 2.31 | Herculano-Houzel et al., 2006 | |
| Elephant shrew | Elephantulus myurus | 1.0 | 1.10 | 0.26 | 2.05 | Neves et al., 2014 | |
| Eastern mole | Scalopus aquaticus | 1.1 | 1.30 | 0.11 | 2.75 | Sarko et al., 2009 | |
| Mouse lemur | Microcebus murinus | 1.8 | 3.17 | 0.08 | 4.63 | Gabi et al. 2010 | |
| Mouse lemur | Microcebus murinus | 1.8 | 12.66 | Burish et al., 2010 | |||
| Rat (Wistar) | Rattus norvegicus | 1.8 | 1.47 | 0.21 | 1.90 | Herculano-Houzel et al., 2006 | |
| Rat (Wistar) | Rattus norvegicus | 2.0 | 1.47 | 0.21 | 2.53 | Herculano-Houzel & Lent, 2005 | |
| Rat (Wistar) | Rattus norvegicus | (2) | ~2.0 | ~2.5 | Bandeira et al., 2009 | ||
| Rat (Wistar) female | Rattus norvegicus | (2) | 3.55 | Bjugn & Gundersen, 1993 | |||
| Four-toed elephant shrew | Petrodomus tetrad. | 2.4 | 1.21 | 0.30 | 2.30 | Neves et al., 2014 | |
| Tree shrew | Tupaia glis | 2.8 | 1.42 | 0.11 | 3.87 | Herculano-Houzel et al., 2007 | |
| Tree shrew | Tupaia glis | 2.8 | 15.60 | Burish et al., 2010 | |||
| Guinea pig | Cavia porcellus | 3.8 | 2.50 | 0.21 | 3.30 | Herculano-Houzel et al., 2006 | |
| Marmoset | Callithrix jacchus | 7.8 | 1.62 | 0.14 | 4.91 | Herculano-Houzel et al., 2007 | |
| Marmoset | Callithrix jacchus | 7.8 | 12.21 | Burish et al., 2010 | |||
| Galago | Otolemur garnetti | 10.2 | 1.78 | 0.14 | 7.09 | Herculano-Houzel et al., 2007 | |
| Galago | Otolemur garnetti | 10.2 | 15.44 | Burish et al., 2010 | |||
| Western tree hyrax | Dendrohyrax dorsalis | 12.8 | 1.84 | 0.22 | 3.41 | Neves et al., 2014 | |
| Goeldi’s marmoset | Callimico goeldii | (13) | 2.00 | 3.61 | Gabi et al., 2010 | ||
| Owl monkey | Aotus trivirgatus | 15.7 | 1.57 | 0.14 | 6.36 | Herculano-Houzel et al., 2007 | |
| Owl monkey | Aotus trivirgatus | 15.7 | 15.64 | Burish et al., 2010 | |||
| Rock hyrax | Provacia capensis | 16.9 | 1.90 | 0.18 | 2.35 | Neves et al., 2014 | |
| Agouti | Dasyprocta primnolopha | 18.4 | 3.76 | 0.22 | 4.23 | Herculano-Houzel et al., 2006 | |
| Squirrel monkey | Saimiri sciureus | 30.2 | 1.20 | 0.07 | 4.62 | Herculano-Houzel et al., 2007 | |
| Squirrel monkey | Saimiri sciureus | 30.2 | 19.45 | Burish et al., 2010 | |||
| Crab-eating macaque | Macaca fascicularis | 46.2 | 3.45 | 0.05 | 3.97 | Gabi et al., 2010 | |
| Macaca fascicularis | 46.2 | 31.69 | Burish et al., 2010 | ||||
| Macaca fascicularis | (75) | 3.2–5.6 | Current study | ||||
| Capuchin monkey | Cebus paella | 52.2 | 2.24 | 0.10 | 8.18 | Herculano-Houzel et al., 2007 | |
| Bonnet macaque | Macaca radiata | 61.5 | 2.30 | 0.22 | 10.04 | Gabi et al., 2010 | |
| Bonnet macaque | Macaca radiata | 61.5 | 37.08 | Burish et al., 2010 | |||
| Capybara | Hydrochoerus | 76 | 6.04 | 0.49 | 6.19 | Herculano-Houzel et al., 2006 | |
| Rhesus macaque | Macaca mulatta | 87.3 | 3.08 | 0.20 | 7.93 | Herculano-Houzel et al., 2007 | |
| Rhesus macaque | Macaca mulatta | 87.3 | 37.97 | Burish et al., 2010 | |||
| Yellow baboon | Papio cynocephalus | 151.2 | 2.63 | 0.07 | 3.88 | Gabi et al., 2010 | |
| Human | Homo sapiens | 1291 | 4.32 | 0.29 | 11.10 | Andrade-Moraes et al., 2013 | |
| Human | Homo sapiens | (1300) | 6.1–6.9 | Current study | |||
| Human | Homo sapiens | 1509 | 3.76 | 0.23 | 11.35 | Azevedo et al., 2009 | |
| Elephant | Loxodonta africana | 4619 | 26.8 | 0.15 | 36.9 | Herculano-Houzel et al., 2014 |
(), estimated values for brain mass
Cerebral cortex values are for gray and white matter combined
Fig. 4A–F.
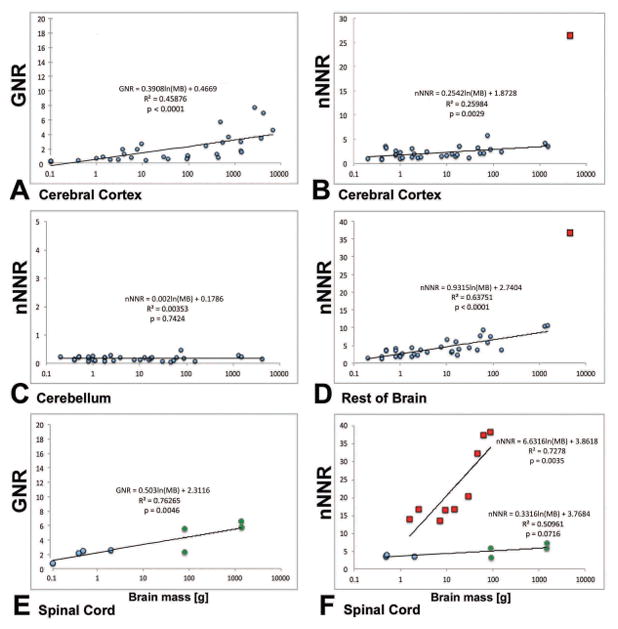
Comparison of trends of glia-neuron ratios (GNRs) and non-neuronal to neuron ratios (nNNRs) for different CNS structures in vertebrate species, plotted as a function of mass of brain (MB) on a logarithmic scale. A, GNR for Cerebral Cortex; B, nNNR for Cerebral Cortex; C, nNNR for Cerebellum; D, nNNR for Rest of Brain; E, GNR for Spinal Cord; F, nNNR for Spinal Cord. Note that for cerebral cortex and rest of brain, as well as spinal cord, there is an obvious increase in the GNR and nNNR from smaller to larger brains with slopes of +0.25 to +0.93, but not for cerebellum where the ratio is not correlated with brain size: MB, mass of brain. Note that the y-axis shows different ranges of GNRs and nNNRs between panels. Slopes for GNRs and nNNRs are generally similar, except for the outliers (indicated by red squares) in panels B and D (both for African Elephant), and the non-human primate data from the study by Burish et al., 2010 in panel F. The data obtained in the current study are indicated by green circles in panels E and F. Two data points are shown for each of the two primate species we examined, reflecting the two methods used. When slopes were calculated with one combined (average) data point for each species, the slopes were virtually identical to the ones shown. For sources of other data points, see Tables 3 and 4.
Fig. 5.
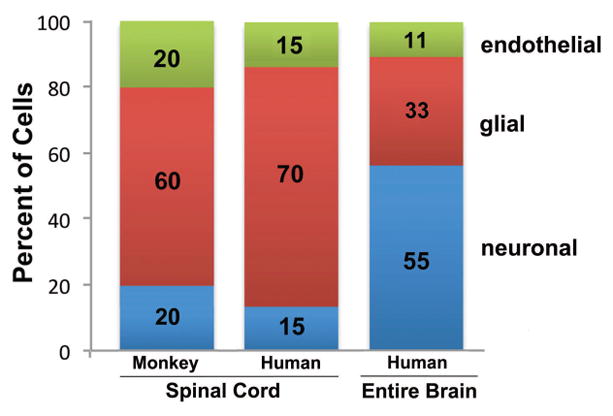
Cellular composition of the spinal cord in cynomolgus monkey and human compared with the composition in an entire human brain, showing the relative percentage of neurons (blue), glial cells (red) and endothelial cells (green), based on the data obtained in the current study. Approximate percentages are indicated on the columns. The bar for the entire human brain adds to 99%, not 100%, due to rounding. The cellular composition in the spinal cord differed considerably from that in the entire brain, and was most similar to the composition found in the brainstem (“rest of brain”) (compare Fig. 5 with Fig. 2).
DISCUSSION
Our study is the first that directly counted and estimated, by using systematic random sampling, the number of cells and neurons in the human spinal cord. Ours is also the first study that applied two different cell counting techniques, stereology and the isotropic fractionator, to estimate the number of neurons and non-neuronal cells in the spinal cord of a human and a non-human primate, and the first that systematically compared GNRs with nNNRs for large datasets. Previous work indicated a surprisingly high GNR in the primate spinal cord, mainly due to a very low number of neurons (Herculano-Houzel et al., 2016). We compare our data with those from previous studies in spinal cords of primates and other vertebrate species, and we identify evolutionary trends of glia-neuron ratios in the spinal cord and other, cranial, CNS regions (cerebral cortex, cerebellum, and rest of brain).
Methodological considerations
Previous work on the numerical composition of the spinal cord has utilized either stereology or the IF, but not both. The two approaches each have advantages and disadvantages (Herculano-Houzel et al., 2015). The stereology approach to estimate neuron and glia numbers in spinal cords is limited by the problem of not being able to distinguish all small neurons from glial cells (Bjugn, 1993; Bjugn and Gundersen, 1993; von Bartheld et al., 2016). Indeed, when we compared data obtained by the IF with the data obtained from stereology for the percentage of neurons, we found that as many as 11.7% of presumed glial cells may actually be neuronal. This problem is particularly relevant in the spinal cord, because most dorsal horn neurons – the large majority of neurons in the spinal cord – are small, contain very little rough endoplasmic reticulum (Nathaniel and Nathaniel, 1966), and therefore remain pale with Nissl stains. Motoneurons are easily distinguished from glia (Bjugn and Gundersen, 1993; Hatton and von Bartheld, 1999), but they constitute a minute fraction of only about 1–2% of all spinal cord neurons (as documented for the sacral segment of the rat spinal cord, Chung et al., 1984), while the dorsal horns contain the majority (more than 70%) of neurons in the gray matter in the rodent spinal cord (Bjugn, 1993). Therefore, until unambiguous markers – that can be shown to work in human tissue – are available to distinguish glia from neurons, histological methods such as stereology are less than optimal to obtain numerical estimates, especially in human tissues (Lyck et al., 2008, 2009). This likely constitutes the largest potential error in our stereology method and may be calculated to maximally involve up to 11.7% of all cells surveyed, as mentioned in the Results.
The IF was developed as an alternative counting method to stereology. Results obtained with the IF were initially met with skepticism, because the method had not been formally validated. This has recently been accomplished for brain tissues (Bahney and von Bartheld, 2014; Miller et al., 2014; Herculano-Houzel et al., 2015), and numerical estimates have been shown to be equivalent to those obtained by stereology. Since processing of human CNS tissues always is suboptimal due to ethical constraints and limitations of access/control, and because humans have a particularly broad biological variation of cell composition in the CNS (Haug, 1987; Pakkenberg and Gundersen, 1997; Peters et al., 1998; von Bartheld et al., 2016), the study of human spinal cord tissues presents with added complications that may affect the validity of numerical estimates. Accordingly, it is prudent to use two complementary counting methods to verify cell numbers in these tissues.
Previous studies on a possible age-related decline of neuron numbers in human spinal cord have been conflicting. Tomlinson and Irving (1977) found no evidence for a decline until after the age of 60 years, while Terao et al. (1996) reported a steady decline of 10–20% of small motoneurons throughout adulthood, whereas Kawamura et al. (1977) and Cruz-Sanchez et al. (1998) reported a similar decline, but only for medium to larger-sized motoneurons. Since all of these studies determined densities rather than absolute numbers, they may be affected by the same shrinkage artifact that Haug et al. (1984) revealed for human cortex. Even if there is a 10% decline of neurons by age 70, the GNR for the human spinal cord would increase only marginally, from 6.5 to 7.2.
Comparison of numerical estimates with previous primate studies
Early estimates of the cellular composition of the spinal cord of primates, none of which were derived from experimental studies, ranged from 13 million to 1 billion neurons (Gelfan, 1963; Kalat, 1998; also cited in Chudler, 2016). More recently, studies employing the IF provided first direct evidence for cell numbers and composition in the spinal cord of several different species of nonhuman primates (Burish et al., 2010). At 1.7–11.4 million, their neuron numbers (Burish et al., 2010) were considerably lower than the ones in our study. For Macaca fascicularis, they were 11.4 million, which is three-to-six fold lower than our estimates (27–69 million neurons) for the same species. Possible reasons for the differences in absolute numbers as well as ratios include excessive post-fixation periods that are not recommended for primate tissues (Lyck et al., 2008; Azevedo et al., 2009), because extensive fixation may interfere with the neuron-specific antibody’s ability to penetrate or recognize the antigen, and therefore could lead to an underestimate of neuron numbers: “Fixation for less than 48 hours was critical to allow for antibody recognition of NeuN, while still being enough to guarantee that the nuclei remained intact throughout the homogenization procedure” (Azevedo et al., 2009). Alternatively, or in addition, the nNNRs and GNRs may be more discrepant if endothelial cells scale differently than neurons or glial cells. To our knowledge, this has not been explored, and furthermore may be specific to CNS parts or may depend on CNS tissue size. This could potentially explain why very large brains have considerably larger nNNRs than GNRs, as appears to be the case with elephants (Fig. 4B, D), although additional data on nNNRs from large brains (e.g., whale and dolphin) are needed to support this interpretation. Optimal tissue processing conditions for spinal cords have yet to be systematically evaluated, so there may be tissue-specific methodological factors.
The total number of cells in the single Macaca fascicularis spinal cord was considerably higher in the Burish et al., 2010, study (360 million) than in our three specimens (mean of 206–275 million cells). This difference could relate to gender and age. Our M. fascicularis specimens were small, relatively young (3-year old) females with a body weight of about 1.5 kg, and a weight of the spinal cord of about 3.8 g, whereas the single M. fascicularis species in the Burish et al. (2010) study may have been a larger male, as suggested by the spinal cord weight of 7.5 g. However, the effect of age and gender on cell numbers in the primate spinal cord is not clear (Burish et al., 2010). It is surprising that the nNNR of this species in the Burish et al., 2010 study was 31.7, while ours were 3.2 to maximally 5.6 (see Results), with a GNR of 2.1 to maximally 4.9 (see Results) (Fig. 4E, F; Tables 3, 4). As mentioned above, a likely reason for the difference in nNNRs appears to be an underestimate of neuron numbers in the 2010 study, possibly due to excessive duration of aldehyde fixation. As illustrated in Figure 2, the difference between the GNR and the nNNR would be expected – theoretically – to be relatively small, and this aspect alone can account for only a minor fraction of the observed difference between studies and techniques.
GNRs and nNNRs of the spinal cord and other CNS parts: comparison among species
The spinal cords of smaller mammals and non-mammals have GNRs of 0.7–2.7 (Bjugn, 1993; Bjugn and Gundersen, 1993; Chvatal et al., 2001; Fig. 4E), so the reported nNNR of over 30 for M. fascicularis and other non-human primates (Burish et al., 2010; Fig. 4F) is an order of magnitude higher. Figure 4A–F (and Tables 3 and 4) compile the GNRs and nNNRs for different species and CNS regions from published studies. As can be seen in Figure 4, GNRs consistently increase for all species in evolution with increasing brain mass, as shown for three CNS regions, with slopes between +0.25 and +0.93 for GNRs and nNNRs. The only exception to this rule is the cerebellum, where there is no correlation between brain mass and nNNR. Accordingly, an abrupt rise in the GNR or nNNR for the spinal cord of more than 10-fold from smaller mammals such as rodents to larger ones such as primates is unusual. It has been debated whether fine motor control may be reflected by or correlated with differences in neuron numbers in the spinal cord vs. cortical regions (Herculano-Houzel et al., 2016). When we examined the presence of segmental differences in the GNR in spinal cords of humans and non-human primates, none of them were significant (Tables 1 and 2). Furthermore, it has been concluded that the neuronal control of fine motor movements is largely accomplished in centers above the spinal cord (Burish et al., 2010; Herculano-Houzel et al., 2016), so it is unlikely that segmental differences due to increased demands of upper extremity fine motor control could explain the claimed large difference in spinal GNRs between species. It is more likely that the neuron-specific antibody failed to recognize all neurons in the tissue due to prolonged fixation periods, as mentioned above. The IF yielded only 2.4–2.6 million neurons in mouse spinal cords (Fu et al., 2013, 2015), whereas stereology yielded at least 4 million neurons (even though stereology could not identify with certainty about one million cells, with an unknown fraction of neurons, Bjugn, 1993). Likewise, studies of elephant cortex suggested an nNNR of 37, and with less than 5.6 billion neurons (Herculano-Houzel et al., 2014, Table 4), whereas stereology indicated a GNR of less than 7, and about 8.8 billion neurons (Haug, 1987, Table 3). Accordingly, both methods have the potential to underestimate neuron numbers – either because of insufficient antibody labeling or because of misclassification of small neurons. Further information on GNRs and nNNRs of larger mammals is needed to determine whether the primate and elephant data points are outliers (Fig. 4B, D), or whether nNNRs of very large brains truly have an exponential increase in their nNNRs, possibly due to greatly increased numbers of endothelial cells. Scaling of the vascular system in brains does not support this idea (Karbowski, 2011).
GNR – linked with intelligence?
We show that glial cells make up a larger fraction of total cells in the primate spinal cord (higher GNR) than glial cells in the primate cerebral cortex, and we show that the GNR in the spinal cord increases from species with smaller brains to species with larger brains in a similar fashion as for cerebral cortex and rest of brain, but not cerebellum. Previous work has emphasized the correlation of increasing GNRs in animals with more complex behavior, larger brains and “higher intelligence” (Friede, 1954; Jerison, 1973; Diamond et al., 1985; Witelson et al., 1995; Araque et al., 2001; Fields, 2009; Verkhratsky and Butt, 2013). This was interpreted to indicate that larger numbers of glial cells in brains are required for higher forms of cognition such as intelligence. When compared with non-primate vertebrates, the GNR in the spinal cord – which is not believed to process cognitive information or to perform intelligence-related functions – increases from smaller vertebrates to larger vertebrates in a similar fashion as the GNR does for cerebral cortex or whole brain. This provides further evidence that increasing GNRs are due to increased brain mass with increased neuronal sizes and reduced neuronal densities (Jehee and Murre, 2008; Herculano-Houzel, 2011; Dicke and Roth, 2016), rather than the interpretation that increasing glia numbers in cerebral cortex bestow humans with superior intellectual abilities.
Acknowledgments
We thank the staff and leadership of the Charles River Labs, Reno, for kindly donating monkey tissues, and we acknowledge the Anatomical Donation Program (University of Nevada, Reno School of Medicine) and Pat Elders and Carl Sievert for help with human cadaver tissues. We also thank Andrea Agarwal, Chengyuan Feng and Wei Yang (all at the University of Nevada, Reno) for technical support, statistical advice, and helpful comments. Our work was supported by NIH grants NS079884, GM104944, and COBRE grant GM103554.
List of Abbreviations
- E
endothelial cell
- G
glial cell
- GNR
glia-neuron ratio
- IF
isotropic fractionator
- MB
mass of brain
- N
neuron
- nNNR
non-neuronal to neuron ratio
LITERATURE CITED
- Andersen BB, Korbo L, Pakkenberg B. A quantitative study of the human cerebellum with unbiased stereological techniques. J Comp Neurol. 1992;326:549–560. doi: 10.1002/cne.903260405. [DOI] [PubMed] [Google Scholar]
- Andersen BB, Pakkenberg B. Stereological quantitation in cerebella from people with schizophrenia. Br J Psychiatry. 2003;182:354–361. doi: 10.1192/bjp.182.4.354. [DOI] [PubMed] [Google Scholar]
- Andersen K, Andersen BB, Pakkenberg B. Stereological quantification of the cerebellum in patients with Alzheimer’s disease. Neurobiol Aging. 2012;33:197, e11–20. doi: 10.1016/j.neurobiolaging.2010.06.013. [DOI] [PubMed] [Google Scholar]
- Azevedo FA, Carvalho LR, Grinberg LT, Farfel JM, Ferretti RE, Leite RE, Jacob Filho W, Lent R, Herculano-Houzel S. Equal numbers of neuronal and nonneuronal cells make the human brain an isometrically scaled-up primate brain. J Comp Neurol. 2009;513:532–541. doi: 10.1002/cne.21974. [DOI] [PubMed] [Google Scholar]
- Araque A, Carmignoto G, Haydon PG. Dynamic signaling between astrocytes and neurons. Annu Rev Physiol. 2001;63:795–813. doi: 10.1146/annurev.physiol.63.1.795. [DOI] [PubMed] [Google Scholar]
- Bahney J, von Bartheld CS. Validation of the isotropic fractionator: Comparison with unbiased stereology and DNA extraction for quantification of glial cells. J Neurosci Methods. 2014;222:165–174. doi: 10.1016/j.jneumeth.2013.11.002. [DOI] [PMC free article] [PubMed] [Google Scholar]
- Bandeira F, Lent R, Herculano-Houzel S. Changing numbers of neuronal and non-neuronal cells underlie postnatal brain growth in the rat. Proc Natl Acad Sci USA. 2009;106:14108–14113. doi: 10.1073/pnas.0804650106. [DOI] [PMC free article] [PubMed] [Google Scholar]
- Baryshnikova LM, von Bohlen und Halbach O, Kaplan S, von Bartheld CS. Two distinct events, section compression and loss of particles (“lost caps”), contribute to z-axis distortion and bias in optical disector counting. Microsc Res Tech. 2006;69:738–756. doi: 10.1002/jemt.20345. [DOI] [PubMed] [Google Scholar]
- Bjugn R. The use of the optical disector to estimate the number of neurons, glial and endothelial cells in the spinal cord of the mouse - with a comparative note on the rat spinal cord. Brain Res. 1993;627:25–33. doi: 10.1016/0006-8993(93)90744-8. [DOI] [PubMed] [Google Scholar]
- Bjugn R, Gundersen HJ. Estimate of the total number of neurons and glial and endothelial cells in the rat spinal cord by means of the optical disector. J Comp Neurol. 1993;328:406–414. doi: 10.1002/cne.903280307. [DOI] [PubMed] [Google Scholar]
- Blinkov SM, Glezer . A Quantitative Handbook. New York: Plenum Press; 1968. The Human Brain in Figures and Tables; p. 482. [Google Scholar]
- Brasileiro-Filho G, Guimaraes RC, Pittella JE. Quantitation and karyometry of cerebral neuroglia and endothelial cells in liver cirrhosis and in the hepatosplenic schistosomiasis mansoni. Acta Neuropathol. 1989;77:582–590. doi: 10.1007/BF00687885. [DOI] [PubMed] [Google Scholar]
- Burish MJ, Peebles JK, Baldwin MK, Tavares L, Kaas JH, Herculano-Houzel S. Cellular scaling rules for primate spinal cords. Brain Behav Evol. 2010;76:45–59. doi: 10.1159/000319019. [DOI] [PMC free article] [PubMed] [Google Scholar]
- Christensen JR, Larsen KB, Lisanby SH, Scalia J, Arango V, Dwork AJ, Pakkenberg B. Neocortical and hippocampal neuron and glial cell numbers in the rhesus monkey. Anat Rec (Hoboken) 2007;290:330–340. doi: 10.1002/ar.20504. [DOI] [PubMed] [Google Scholar]
- Chudler EH. [Accessed 12 06 2016];Brain Facts and Figures. 2016 http://faculty.washington.edu/chudler/facts.html.
- Chung K, Kevetter GA, Willis WD, Coggeshall RE. An estimate of the ratio of propriospinal to long tract neurons in the sacral spinal cord of the rat. Neurosci Lett. 1984;44:173–177. doi: 10.1016/0304-3940(84)90077-6. [DOI] [PubMed] [Google Scholar]
- Chvátal A, Andĕrová M, Ziak D, Orkand RK, Syková E. Membrane currents and morphological properties of neurons and glial cells in the spinal cord and filum terminale of the frog. Neurosci Res. 2001;40:23–35. doi: 10.1016/s0168-0102(01)00211-5. [DOI] [PubMed] [Google Scholar]
- Cruz-Sánchez FF, Moral A, Tolosa E, de Belleroche J, Rossi ML. Evaluation of neuronal loss, astrocytosis and abnormalities of cytoskeletal components of large motor neurons in the human anterior horn in aging. J Neural Transm (Vienna) 1998;105:689–701. doi: 10.1007/s007020050088. [DOI] [PubMed] [Google Scholar]
- Davanlou M, Smith DF. Stereological estimation of different cell types in rat cerebral cortex. Image Anal Stereol. 2004;23:1–11. [Google Scholar]
- Diamond MC, Scheibel AB, Murphy GM, Jr, Harvey T. On the brain of a scientist: Albert Einstein. Exp Neurol. 1985;88:198–204. doi: 10.1016/0014-4886(85)90123-2. [DOI] [PubMed] [Google Scholar]
- Dicke U, Roth G. Neuronal factors determining high intelligence. Philos Trans R Soc Lond B Biol Sci. 2016;371:20150180. doi: 10.1098/rstb.2015.0180. [DOI] [PMC free article] [PubMed] [Google Scholar]
- Eriksen N, Pakkenberg B. Total neocortical cell number in the mysticete brain. Anat Rec (Hoboken) 2007;290:83–95. doi: 10.1002/ar.20404. [DOI] [PubMed] [Google Scholar]
- Farel PB, St Wecker PG, Wray SE. Neuron addition in the postmetamorphic frog. Exp Gerontol. 1992;27:111–124. doi: 10.1016/0531-5565(92)90033-v. [DOI] [PubMed] [Google Scholar]
- Fields RD. The Other Brain. New York: Simon & Schuster; 2009. p. 371. [Google Scholar]
- Friede R. Der quantitative Anteil der Glia and der Cortexentwicklung. Acta Anat. 1954;20:290–296. [PubMed] [Google Scholar]
- Fu Y, Rusznák Z, Herculano-Houzel S, Watson C, Paxinos G. Cellular composition characterizing postnatal development and maturation of the mouse brain and spinal cord. Brain Struct Funct. 2013;218:1337–1354. doi: 10.1007/s00429-012-0462-x. [DOI] [PubMed] [Google Scholar]
- Fu Y, Yu Y, Paxinos G, Watson C, Rusznák Z. Aging-dependent changes in the cellular composition of the mouse brain and spinal cord. Neuroscience. 2015;290:406–420. doi: 10.1016/j.neuroscience.2015.01.039. [DOI] [PubMed] [Google Scholar]
- Gabi M, Collins CE, Wong P, Torres LB, Kaas JH, Herculano-Houzel S. Cellular scaling rules for the brains of an extended number of primate species. Brain Behav Evol. 2010;76:32–44. doi: 10.1159/000319872. [DOI] [PMC free article] [PubMed] [Google Scholar]
- García-Amado M, Prensa L. Stereological analysis of neuron, glial and endothelial cell numbers in the human amygdaloid complex. PLoS One. 2012;7:e38692. doi: 10.1371/journal.pone.0038692. [DOI] [PMC free article] [PubMed] [Google Scholar]
- Gardella D, Hatton WJ, Rind HB, Rosen GD, von Bartheld CS. Differential tissue shrinkage and compression in the z-axis: implications for optical disector counting in vibratome-, plastic- and cryosections. J Neurosci Methods. 2003;124:45–59. doi: 10.1016/s0165-0270(02)00363-1. [DOI] [PubMed] [Google Scholar]
- Gelfan S. Neurone and synapse populations in the spinal cord: indication of role in total integration. Nature. 1963;198:162–163. doi: 10.1038/198162a0. [DOI] [PubMed] [Google Scholar]
- Giuffrida AM, Gadaleta MN, Serra I, Renis M, Geremia E, Del Prete G, Saccone C. Mitochondrial DNA, RNA, and protein synthesis in different regions of developing rat brain. Neurochem Res. 1979;4:37–52. doi: 10.1007/BF00963830. [DOI] [PubMed] [Google Scholar]
- Hatton WJ, von Bartheld CS. Analysis of cell death in the trochlear nucleus of the chick embryo: calibration of the optical disector counting method reveals systematic bias. J Comp Neurol. 1999;409:169–186. [PubMed] [Google Scholar]
- Haug H, Kühl S, Mecke E, Sass NL, Wasner K. The significance of morphometric procedures in the investigation of age changes in cytoarchitectonic structures of human brain. J Hirnforsch. 1984;25:353–374. [PubMed] [Google Scholar]
- Haug H. Brain sizes, surfaces, and neuronal sizes of the cortex cerebri: a stereological investigation of man and his variability and a comparison with some mammals (primates, whales, marsupials, insectivores, and one elephant) Am J Anat. 1987;180:126–142. doi: 10.1002/aja.1001800203. [DOI] [PubMed] [Google Scholar]
- Hawkins A, Olszewski J. Glia/nerve cell index for cortex of the whale. Science. 1957;126:76–77. doi: 10.1126/science.126.3263.76. [DOI] [PubMed] [Google Scholar]
- Herculano-Houzel S, Lent R. Isotropic fractionator: a simple, rapid method for the quantification of total cell and neuron numbers in the brain. J Neurosci. 2005;25:2518–2521. doi: 10.1523/JNEUROSCI.4526-04.2005. [DOI] [PMC free article] [PubMed] [Google Scholar]
- Herculano-Houzel S. Not all brains are made the same: new views on brain scaling in evolution. Brain Behav Evol. 2011;78:22–36. doi: 10.1159/000327318. [DOI] [PubMed] [Google Scholar]
- Herculano-Houzel S. The glia/neuron ratio: How it varies uniformly across brain structures and species and what that means for brain physiology and evolution. Glia. 2014;62:1377–1391. doi: 10.1002/glia.22683. [DOI] [PubMed] [Google Scholar]
- Herculano-Houzel S. Numbers of neurons as biological correlates of cognitive capability. Curr Opin Behav Sci. 2017;16:1–7. [Google Scholar]
- Herculano-Houzel S, Mota B, Lent R. Cellular scaling rules for rodent brains. Proc Natl Acad Sci USA. 2006;103:12138–12143. doi: 10.1073/pnas.0604911103. [DOI] [PMC free article] [PubMed] [Google Scholar]
- Herculano-Houzel S, Collins CE, Wong P, Kaas JH. Cellular scaling rules for primate brains. Proc Natl Acad Sci USA. 2007;104:3562–3567. doi: 10.1073/pnas.0611396104. [DOI] [PMC free article] [PubMed] [Google Scholar]
- Herculano-Houzel S, Avelino-de-Souza K, Neves K, Porfírio J, Messeder D, Mattos Feijó L, Maldonado J, Manger PR. The elephant brain in numbers. Front Neuroanat. 2014;8:46. doi: 10.3389/fnana.2014.00046. [DOI] [PMC free article] [PubMed] [Google Scholar]
- Herculano-Houzel S, von Bartheld CS, Miller DJ, Kaas JH. How to count cells: the advantages and disadvantages of the isotropic fractionator compared with stereology. Cell Tissue Res. 2015;360:29–42. doi: 10.1007/s00441-015-2127-6. [DOI] [PMC free article] [PubMed] [Google Scholar]
- Herculano-Houzel S, Kaas JH, de Oliveira-Souza R. Corticalization of motor control in humans is a consequence of brain scaling in primate evolution. J Comp Neurol. 2016;524:448–455. doi: 10.1002/cne.23792. [DOI] [PubMed] [Google Scholar]
- Jehee JF, Murre JM. The scalable mammalian brain: emergent distributions of glia and neurons. Biol Cybern. 2008;98:439–445. doi: 10.1007/s00422-008-0228-y. [DOI] [PMC free article] [PubMed] [Google Scholar]
- Jerison H. Evolution of the brain and intelligence. New York: Academic Press; 1973. [Google Scholar]
- Kalat JW. Biological Psychology. 6. Belmont, CA: Brooks/Cole Publishing Company; 1998. [Google Scholar]
- Karbowski J. Scaling of brain metabolism and blood flow in relation to capillary and neural scaling. PLoS One. 2011;6:e26709. doi: 10.1371/journal.pone.0026709. [DOI] [PMC free article] [PubMed] [Google Scholar]
- Kawamura Y, O’Brien P, Okazaki H, Dyck PJ. Lumbar motoneurons of man II: the number and diameter distribution of large- and intermediate-diameter cytons in “motoneuron columns” of spinal cord of man. J Neuropathol Exp Neurol. 1977;36:861–870. doi: 10.1097/00005072-197709000-00010. [DOI] [PubMed] [Google Scholar]
- Korbo L, Andersen BB, Ladefoged O, Møller A. Total numbers of various cell types in rat cerebellar cortex estimated using an unbiased stereological method. Brain Res. 1993;609:262–268. doi: 10.1016/0006-8993(93)90881-m. [DOI] [PubMed] [Google Scholar]
- Lidow MS, Song ZM. Primates exposed to cocaine in utero display reduced density and number of cerebral cortical neurons. J Comp Neurol. 2001;435:263–275. doi: 10.1002/cne.1028. [DOI] [PubMed] [Google Scholar]
- Lyck L, Dalmau I, Chemnitz J, Finsen B, Schrøder HD. Immunohistochemical markers for quantitative studies of neurons and glia in human neocortex. J Histochem Cytochem. 2008;56:201–221. doi: 10.1369/jhc.7A7187.2007. [DOI] [PMC free article] [PubMed] [Google Scholar]
- Lyck L, Santamaria ID, Pakkenberg B, Chemnitz J, Schrøder HD, Finsen B, Gundersen HJ. An empirical analysis of the precision of estimating the numbers of neurons and glia in human neocortex using a fractionator-design with sub-sampling. J Neurosci Methods. 2009;182:143–156. doi: 10.1016/j.jneumeth.2009.06.003. [DOI] [PubMed] [Google Scholar]
- Marino L. Absolute brain size: did we throw the baby out with the bathwater? Proc Natl Acad Sci USA. 2006;103:13563–13564. doi: 10.1073/pnas.0606337103. [DOI] [PMC free article] [PubMed] [Google Scholar]
- Miller DJ, Balaram P, Young NA, Kaas JH. Three counting methods agree on cell and neuron numbers in chimpanzee primary visual cortex. Front Neuroanat. 2014;8:36. doi: 10.3389/fnana.2014.00036. [DOI] [PMC free article] [PubMed] [Google Scholar]
- Mortensen HS, Pakkenberg B, Dam M, Dietz R, Sonne C, Mikkelsen B, Eriksen N. Quantitative relationships in delphinid neocortex. Front Neuroanat. 2014;8:132. doi: 10.3389/fnana.2014.00132. [DOI] [PMC free article] [PubMed] [Google Scholar]
- Nathaniel EJH, Nathaniel DR. Fine structure of the neurons of the posterior horn in the rat spinal cord. Anat Rec. 1966;155:629–641. [Google Scholar]
- Nedergaard M, Ransom B, Goldman SA. New roles for astrocytes: redefining the functional architecture of the brain. Trends Neurosci. 2003;26:523–530. doi: 10.1016/j.tins.2003.08.008. [DOI] [PubMed] [Google Scholar]
- Neves K, Ferreira FM, Tovar-Moll F, Gravett N, Bennett NC, Kaswera C, Gilissen E, Manger PR, Herculano-Houzel S. Cellular scaling rules for the brain of afrotherians. Front Neuroanat. 2014;8:5. doi: 10.3389/fnana.2014.00005. [DOI] [PMC free article] [PubMed] [Google Scholar]
- Pakkenberg B, Gundersen HJ. Neocortical neuron number in humans: effect of sex and age. J Comp Neurol. 1997;384:312–320. [PubMed] [Google Scholar]
- Peters A, Morrison JH, Rosene DL, Hyman BT. Feature article: are neurons lost from the primate cerebral cortex during normal aging? Cereb Cortex. 1998;8:295–300. doi: 10.1093/cercor/8.4.295. [DOI] [PubMed] [Google Scholar]
- Sarko DK, Catania KC, Leitch DB, Kaas JH, Herculano-Houzel S. Cellular scaling rules of insectivore brains. Front Neuroanat. 2009;3:8. doi: 10.3389/neuro.05.008.2009. [DOI] [PMC free article] [PubMed] [Google Scholar]
- Schmitz C, Hof PR. Design-based stereology in neuroscience. Neuroscience. 2005;130:813–831. doi: 10.1016/j.neuroscience.2004.08.050. [DOI] [PubMed] [Google Scholar]
- Sherwood CC, Stimpson CD, Raghanti MA, Wildman DE, Uddin M, Grossman LI, Goodman M, Redmond JC, Bonar CJ, Erwin JM, Hof PR. Evolution of increased glia-neuron ratios in the human frontal cortex. Proc Natl Acad Sci USA. 2006;103:13606–13611. doi: 10.1073/pnas.0605843103. [DOI] [PMC free article] [PubMed] [Google Scholar]
- Stolzenburg JU, Reichenbach A, Neumann M. Size and density of glial and neuronal cells within the cerebral neocortex of various insectivorian species. Glia. 1989;2:78–84. doi: 10.1002/glia.440020203. [DOI] [PubMed] [Google Scholar]
- Terao S, Sobue G, Hashizume Y, Li M, Inagaki T, Mitsuma T. Age-related changes in human spinal ventral horn cells with special reference to the loss of small neurons in the intermediate zone: a quantitative analysis. Acta Neuropathol. 1996;92:109–114. doi: 10.1007/s004010050497. [DOI] [PubMed] [Google Scholar]
- Tomlinson BE, Irving D. The numbers of limb motor neurons in the human lumbosacral cord throughout life. J Neurol Sci. 1977;34:213–219. doi: 10.1016/0022-510x(77)90069-7. [DOI] [PubMed] [Google Scholar]
- Verkhratsky A, Butt A. Chapter 3: Neuroglia: Definition, Classification, Evolution, Numbers, Development. New York: John Wiley; 2013. Glial Physiology and Pathophysiology; pp. 73–104. [Google Scholar]
- von Bartheld CS. Distribution of particles in the z-axis of tissue sections: Relevance for counting methods. Neuroquantology. 2012;10:66–75. [PMC free article] [PubMed] [Google Scholar]
- von Bartheld CS, Bahney J, Herculano-Houzel S. The search for true numbers of neurons and glial cells in the human brain: a review of 150 years of cell counting. J Comp Neurol. 2016;524:3865–3895. doi: 10.1002/cne.24040. [DOI] [PMC free article] [PubMed] [Google Scholar]
- Walløe S, Eriksen N, Dabelsteen T, Pakkenberg B. A neurological comparative study of the harp seal (Pagophilus groenlandicus) and harbor porpoise (Phocoena phocoena) brain. Anat Rec (Hoboken) 2010;293:2129–2135. doi: 10.1002/ar.21295. [DOI] [PubMed] [Google Scholar]
- Walløe S, Nissen UV, Berg RW, Hounsgaard J, Pakkenberg B. Stereological estimate of the total number of neurons in spinal segment D9 of the red-eared turtle. J Neurosci. 2011;31:2431–2435. doi: 10.1523/JNEUROSCI.3938-10.2011. [DOI] [PMC free article] [PubMed] [Google Scholar]
- Williams RW, Rakic P. Three-dimensional counting: an accurate and direct method to estimate numbers of cells in sectioned material. J Comp Neurol. 1988;278:344–352. doi: 10.1002/cne.902780305. Erratum in: J Comp Neurol (1989) 281:335. [DOI] [PubMed] [Google Scholar]