
Fig. 4.
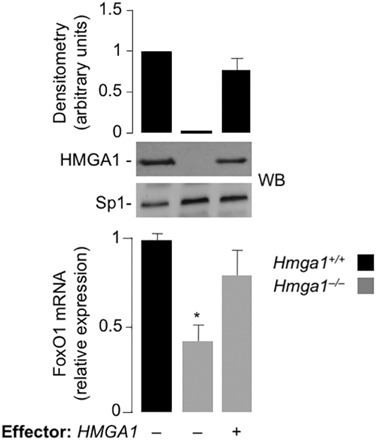
FoxO1 gene expression in primary culture cells. FoxO1 mRNA abundance was measured in primary cultured hepatocytes from both Hmga1 +/+ (black bar) and Hmga1 –/– (gray bar) mice, before and after transfection of the cells with the pcDNA3-HMGA1 expression vector. Results are means ± S.E.M. of five independent experiments. *P < 0.05 vs. Hmga1 +/+ hepatocytes. Representative WBs are shown in each condition. Bar graph above the gel panel is derived from densitometric scanning of anti-HMGA1 WB, using the ImageJ software program. Sp1, control of nuclear protein loading