Abstract
Deferoxamine (DFO) to treat iron overload (IO) has been limited by toxicity issues and short circulation times and it would be desirable to prolong circulation to improve non-transferrin bound iron (NTBI) chelation. In addition, DFO is currently unable to efficiently target the large pool of iron in the liver and spleen. Nanogel-Deferoxamine conjugates (NG-DFO) can prove useful as a model to investigate the pharmacokinetic (PK) properties and biodistribution (BD) behavior of iron-chelating macromolecules and their overall effect on serum ferritin levels. NG-DFO reduced the cytotoxicity of DFO and significantly reduced cellular ferritin levels in IO macrophages in vitro. PK/BD studies in normal rats revealed that NG-DFO displayed prolonged circulation and preferential accumulation into the liver and spleen. IO mice treated with NG1-DFO presented significantly lower levels of serum ferritin compared to DFO. Total renal and fecal elimination data point to the need to balance prolonged circulation with controlled degradation to accelerate clearance of iron-chelating macromolecules.
Keywords: Deferoxamine, macromolecule, pharmacokinetics, biodistribution, iron chelation
Graphical Abstract
Introduction
IO (i.e. hemochromatosis) can result from either hereditary conditions or from acquired hemochromatosis due to repeated blood transfusions in the management of hematological-related disorders such as Thalassemia or Sickle Cell Disease.(Andrews, 1999, 2008; Hamilton and Kizhakkedathu, 2015) Since humans cannot efficiently excrete excess iron, administration of chelation therapy is necessary to reduce overall iron burden levels. In the early stages of hemochromatosis, the body can usually handle excess iron by storing it in ferritin since it is the main iron storage protein of the body. Ferritin is particularly overabundant in macrophages of the liver and spleen due to the role these organs play in iron homeostasis and recycling under normal conditions. Unfortunately, with continued IO beyond the body’s capacity to handle the excess, transferrin molecules in circulation that are responsible for transporting iron to cells throughout the body also begin to saturate and this phenomenon typically leads to the increasing presence of non-transferrin bound iron (NTBI) in circulation. NTBI is especially dangerous due to its ability to generate free radicals via the Fenton reaction in cells and tissues of critical organs such as the heart and is the leading cause of fatality in severely IO patients.(Ladis et al., 2005)
For treating IO, there are currently three FDA-approved small molecule drugs, of which Deferoxamine (DFO) is the oldest and best characterized. Unfortunately, use of DFO has been limited by neurotoxicity issues in the eye and ear at high doses and short circulation times in the blood, resulting in long intramuscular or intravenous infusion regimens (8–12 h, 5–7 days/week) that often result in poor patient compliance.(Lee et al., 1993; Levine et al., 1997; Porter et al., 1998) To avoid having to infuse the drug into patients, it would be desirable to prolong the circulation of the drug by conjugating it to a macromolecule since the longer circulation time could improve NTBI chelation and thus minimize potential uptake by critical organs. In addition, DFO is currently unable to efficiently target the large pool of iron in the liver and spleen where a vast majority of excess iron is stored in the macrophages, and little work has been reported on chelation therapies specifically targeting this particular iron pool. To investigate some of these questions, macromolecular iron chelation systems such as nanogels can prove a useful model for improving the pharmacokinetic properties of DFO as well as ensuring localization of the carrier to major iron-storage organs such as liver and spleen.
Based on size and surface properties alone, it has been reported that negative or neutral spherical-looking nanoparticles with diameters in the 20–150 nm range can accumulate to organs such as liver and spleen.(Blanco et al., 2015) Since a vast majority of iron is stored in the body in the form of ferritin in macrophages of the liver and spleen, we postulate that nanogel-Dereroxamine conjugates (NG-DFO) of appropriate size and surface properties should significantly prolong circulation time of the drug and localize more efficiently to macrophages of the liver and spleen for improved iron chelation. This is because the majority of iron release from ferritin in macrophages occurs in conjunction with lysosomal proteolysis,(Kidane et al., 2006; Theil, 2009) therefore the preferential trafficking of macromolecules into lysosomes could be advantageous for mobilizing large amounts of iron away from ferritin. Specifically, we report on the preparation of NG-DFO within the optimal 20–150 nm range for targeting liver and spleen and investigate PK/BD behavior in normal rats. Finally, the efficacy and elimination properties of NG-DFO was assessed in an IO mouse model where it was found that NG-DFO could indeed significantly reduce serum ferritin levels compared to free DFO.
Materials and Methods
Materials
Dioctyl sulfosuccinate (AOT), Brij30, hexane, acrylamide (AAm), glycidyl methacrylate (GMA), poly(ethylene glycol) diacrylate (PEG-DA, average Mn = 700), ammonium persulfate (APS), N,N,N’,N’-tetramethylethylenediamine (TEMED), sodium periodate (NaIO4), sodium cyanoborohydride (NaCNBH3), glycine, sodium hydroxide (NaOH), ferric chloride hexahydrate (FeCl3·6H2O), protease inhibitor cocktail, and resazurin sodium salt were purchased from Sigma-Aldrich (St. Louis, MO). Ferric ammonium citrate (FAC) was purchased from VWR (Radnor, PA). The EGM-2 BulletKit medium was purchased from Lonza (Allendale, NJ). Deferoxamine mesylate (DFO) was purchased from the University of Wisconsin Hospital Pharmacy Services (Hospira). Dulbecco’s modified eagle medium (DMEM), heat-inactivated fetal bovine serum (FBS), penicillin/streptomycin solution (100×) and Pierce BCA protein assay kit were purchased from Thermo Fisher Scientific (Waltham, MA). Mouse ferritin ELISA kit was purchased from Immunology Consultants Laboratory (Portland, OR). Iron-59 radionuclide (Fe-59) was purchased from Perkin Elmer as 1 mCi Ferric Chloride in 0.5 M HCl (Waltham, MA,). Dextran/Fe for iron-overloading mice was purchased from Anem-X 100 (Aspen Veterinary Resources, Ltd).
Preparation of NG-DFO
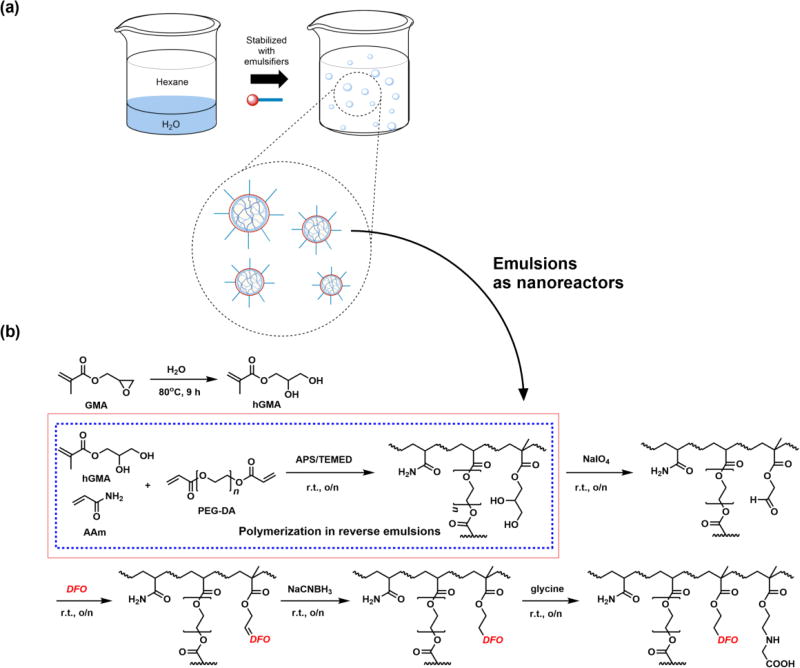
As summarized in Scheme 1, spherical particles in the 20–150 nm desired size range were prepared via reverse emulsion polymerization of the monomers AAm, hGMA (for preparation and NMR, see Fig. S1), and PEG-DA (Mn 700).(Daubresse et al., 1994; Liu et al., 2016b) The molar ratio of monomers AAm:hGMA:PEG-DA was kept constant at 100:50:25 whereas the weight ratio of AOT to Brij30 surfactants used to stabilize emulsions was 5:10 (w/w) for nanogel 1 (NG1) scaffold and 10:5 for nanogel 2 (NG2) scaffold prior to conjugation to DFO. As a specific example, to prepare NG1 averaging 36 nm in diameter, 1 g AOT and 2 g Brij30 (5:10 w/w) were weighed into a 100 ml round bottom flask and dissolved with 24.4 ml hexane (16 g) while stirring with a magnetic stir bar at 1500 rpm. Next, 50 mg AAm, 56 mg hGMA, and 123 mg PEG-DA (100:50:25) were dissolved in 771 µl ddH2O to obtain 1 g aqueous solution. This solution containing the monomers was slowly added to the hexane solution while stirring to form water-in-oil emulsions (80:5 w/w hexane to water). The stirred mixture was purged with nitrogen gas (bubbling through a needle) for 20 minutes to remove dissolved oxygen. Finally, 100 µl TEMED and 100 µl 15% (w/w) APS solution in ddH2O were added sequentially to the mixture to initiate polymerization and stirred overnight at RT. At the end of polymerization, hexane was removed on a rotary evaporator and the surfactants were washed off the resulting NG1 scaffold by precipitation and centrifugation with 50 ml ethanol.
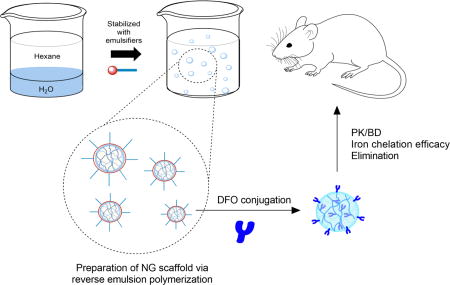
Scheme 1.
Reverse emulsions stabilized via anionic AOT and nonionic Brij30 surfactants were prepared and served as nanoreactors containing monomers for polymerization of the nanogel scaffold (a). Polymerization of monomers AAm, hGMA, and PEG-DA was initiated by addition of APS/TEMED followed by DFO conjugation to the NG scaffold via Schiff base chemistry (b).
The conjugation of DFO to both NG scaffolds was accomplished via Schiff base chemistry.(Hallaway et al., 1989; Imran ul-haq et al., 2013) Briefly, NG was dissolved in 10 ml ddH2O and 100 mg NaIO4 was added to convert the vicinal diols of hGMA to aldehydes and the solution was dialyzed (MWCO 10,000) against ddH2O for 24h. Next, 275 mg DFO (about 1.2:1 molar ratio to aldehyde groups assuming 100% oxidation of diols to aldehyde) was added to the NG suspension and stirred overnight before reducing the resulting C=N bond with 100 mg NaCNBH3 and capping any remaining unconjugated aldehyde groups with excess glycine. The NG-DFO solution was dialyzed (MWCO 10,000) against ddH2O several times for 72h to afford the final product.
Physical Characterizations
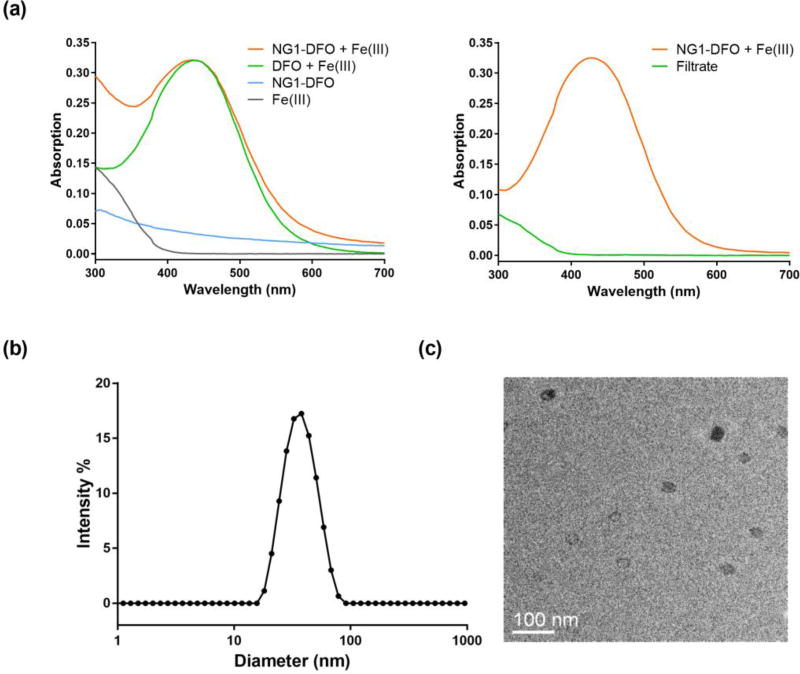
To verify that DFO was conjugated and not simply adsorbed onto NG scaffolds, NG-DFO prepared was mixed with a surplus concentration of Fe(III) to generate the DFO:Fe(III) or Ferrioxamine, FeA, complex (NG-FeA) since DFO chelates Fe(III) at a 1:1 mole ratio with a binding constant on the order of 1031 M−1 (Neilands, 1981). Samples were then repeatedly washed with the aid of a centrifugal filter unit (MWCO 10,000) to remove unconjugated DFO and excess iron. FeA absorbs at 430 nm (Goodwin and Whitten, 1965) therefore comparable absorbances in the concentrate after several washes would support the conclusion that DFO was conjugated to the scaffold (Fig. 1a).
Fig. 1.
UV-Vis absorption of NG1-DFO complexed to Fe(III) (NG1-FeA) reveals strong absorbance at 430 nm; after sample was washed via centrifugal filtration, only the top concentrate containing NG-FeA still absorbed strongly at 430 nm in comparison to the filtrate and supports successful conjugation of DFO to the NG1 scaffold (a). Apparent size distribution of NG1-DFO by DLS revealed particles averaging 36 ± 3 nm (b) and TEM image confirmed spherical morphology (c).
To assess apparent size and surface properties of NG-DFO, Dynamic Light Scattering (DLS) and zeta-potential measurements were conducted with a Zetasizer Nano ZS (Malvern Instruments, UK). For DLS, NG-DFO were suspended in PBS buffer at about 2 mg/ml; the cumulant analysis was used to calculate the z-average diameter and polydispersity index (PDI). For zeta-potential measurements, ca. 2 mg/ml NG-DFO in the absence of iron, - Fe(III), and in the presence of iron, + Fe(III), were dissolved in 10 mM Tris–HCl buffer (pH 7.0) and 0.8 ml of this solution was added to a disposable capillary cell. The zeta-potential was determined from the measurement of electrophoretic mobility and conversion by the Henry equation. Measurements were conducted on three batches of samples and results are reported as mean ± standard deviation (SD). To assess NG-DFO morphology, transmission electron microscopy (TEM) images were taken on a Tecnai TF-12 instrument at an acceleration voltage of 120 kV; the sample was prepared by air-drying a drop of 0.01 mg/ml NG-DFO suspension on copper grid.
To determine the level of DFO conjugation to NG, UV-Vis and atomic absorption spectroscopy (AAS) were independently utilized. In the first method, a series of solutions containing a fixed concentration of NG-DFO and increasing Fe(III) were mixed and the absorption at 430 nm was measured. With increasing Fe(III) in solution chelating to DFO, eventually an absorbance plateau (Amax) was reached (Fig. S2). Based on this UV method, the DFO content in NG was calculated from the following equation derived from the Beer-Lambert law:
where Amax is the maximum absorption, A0 is the absorption of NG-DFO, MW is the molecular weight of DFO (560 g/mol), ε is the molar absorptivity constant for FeA at 430 nm (2300 M−1cm−1 was used (Hallaway et al., 1989)), L is the cell path length, and WNG-DFO is the concentration of NG-DFO (mg/ml). In the AAS method, an excess amount of FeCl3 was added to 2 mg/ml NG-DFO solution and incubated overnight. Next, the mixture was dialyzed (MWCO 10,000) against ddH2O to remove excess Fe(III) ions and the final volume of solution in the dialysis bag was measured to account for the dilution effect. The iron concentration in the dialyzed sample was measured by AAS with a GBC 932AA instrument. The DFO content was then calculated from the following equation:
where c is the concentration of Fe(III) as determined by AAS (in units of mol/L and is assumed to equal the concentration of DFO), MW is the molecular weight of DFO (560 g/mol), Vf is the final volume after dialysis, Vi is the initial volume of the solution before dialysis, and WNG-DFO is the concentration of NG-DFO (mg/ml). Finally, the number of DFO molecules per NG particle (N) was calculated by using the average of the two DFO concentrations (w/w) (DFO conc) obtained from UV-Vis and AAS:
where Mn is the apparent number-average molecular weight of NG based on GPC branched dextran standards, and MW is the molecular weight of DFO (560 g/mol). The apparent Mn of NG-DFO was determined by Gel Permeation Chromatography (GPC) and data acquisition was conducted on a Shimadzu UFLC system equipped with Shodex OHpak SB-806M HQ column (8.0 × 300 mm), eluting with 0.1 M NaNO3 at flow rate of 0.5 ml/min, and detecting with a Shimadzu refractive index detector (RID). GPC data, including dextran standards for calibration and molecular weight calculations, was analyzed with Shimadzu LCsolution GPC postrun software.
In Vitro Cytotoxicity and Ferritin Reduction Assays
Cytotoxicity was evaluated on both Human Umbilical Vein Endothelial Cells (HUVEC) and J774A.1 mouse macrophage/monocyte cells. HUVECs were obtained from Lonza and cultured at 37°C, 5% CO2 with EGM-2 complete medium (only cells with passage number <10 were used for the cytotoxicity study) and the J774A.1 cells were purchased from ATCC, cultured at 37°C and 5% CO2 in DMEM medium supplemented with 10% (v/v) heat-inactivated FBS, 100 IU/ml penicillin and 100 µg/ml streptomycin. In general, cells were seeded in 96-well plates at a density of 3,000 cells/well and allowed to settle for 24 h before treatment with DFO, NG, and NG-DFO at various equivalent concentrations up to 1 mM DFO for 48 h before measuring viability with the metabolism-based resazurin assay.(O'Brien et al., 2000) Readings from wells without cells were used as Eblank, and readings from control cells without treatment (Econtrol) were used to represent 100% cell viability. The viability of cells was calculated by the following equation:
For the in vitro ferritin reduction assay, J774A.1 mouse macrophage cells were seeded in 6-well plates at a density of 30,000 cells/well and allowed to settle for 24 h. IO in cells was induced by treating them with 100 µM FAC for 24h before treating with DFO or NG-DFO at 10 µM or 50 µM equivalent concentrations for 48 h. Next, cells were washed and lysed with cell lysis buffer (150 mM NaCl, 10 mM Tris, 1% Triton X-100 and protease inhibitor cocktail, pH 7.4), total protein concentration was measured with the BCA protein assay kit, and cellular ferritin concentration was measured with a mouse ferritin ELISA kit. Final results are reported as the ratio of ferritin/total protein (ng/µg).
Pharmacokinetics and Biodistribution Studies in Rats
All animal experiments were performed in accordance with the guidelines and protocol approved by the University of Wisconsin-Madison’s IACUC. Normal female Sprague Dawley rats (176–200 g, 65–74 day-old young adults) were obtained from Charles River Laboratories (Wilmington, MA) and given food and water ad libitum for at least 5 days before use. Rats were housed in temperature-controlled rooms with 12h light/dark cycles.
The PK of DFO, NG1-DFO and NG2-DFO chelated to radioactive Fe-59 to form FeA*, NG1-FeA*, and NG2-FeA* was investigated. Specifically, 27 rats were divided into 3 groups with 9 animals per group appropriately distributed to target desired time points (n=3 rats per time point) throughout the 7 day PK study, and also such that 3 animals could be sacrificed for BD studies at 4 h, 48 h, and 168 h. In general, rats were put under isoflurane anesthesia and intravenously administered a single bolus injection of each test sample via tail-vein, not to exceed 7 µCi activity per 1 ml volume injected. At time points of 0.083 h, 0.5 h, 1 h, 2 h, 4 h, 8 h, 12 h, 24 h, 48 h, 72 h, and 168 h, 25–50 µL whole blood samples were drawn from anesthetized rats via the tail vein and collected into a pre-weighed disposable capillary tube for storage. Note that since the blood drawn was so low, eleven data points were possible and less than ca. 10% blood volume was drawn from each animal.
For the BD study, rats were euthanized by CO2 inhalation followed by cervical dislocation to ensure death at 4 h, 48 h, and 168 h. The tissues collected consisted of blood, brain, heart, kidneys, liver, lungs, small piece of right thigh muscle, and spleen. Capillary tubes containing blood and the various organs collected for the BD study were put into 10 mL plastic tubes for counting by a 2480 WIZARD2 Automatic Gamma Counter at the end of each day. Results for the PK profile are plotted as a percentage of injected dose per gram of blood (%ID/g) and results for the BD study are reported as both %ID/g of tissue and also as percentage of injected dose for the whole organ (%ID/organ).
Pharmacokinetic Analysis
PK variables were calculated with PKSolver, a Microsoft Excel add-in application;(Zhang et al., 2010) similar parameters were also obtained using Phoenix® WinNonLin®. The mean and standard deviation (mean ± SD) was calculated for each time point (n=3 rats). For PK parameters, activity was converted to mass unit based on initial activity per mg Fe-59 reported by the manufacturer. The elimination rate constant (Ke) was estimated by linear regression of the blood in the log-linear terminal phase. In order to estimate the immediate initial serum concentration (C0) following injection of the formulations, the software fit the concentration versus time data to a two compartment model. The estimated C0 and raw measured activity (converted to mass units) were then utilized to determine the area under the concentration-time curve (AUC). The total AUC0-∞ was calculated by means of the combined log-linear trapezoidal rule from time of dosing to the last measured concentration, including the remainder area under the curve, of the last measured concentration divided by Ke. Next, non-compartmental PK methods were used by the software to calculate the circulation half-life (t1/2), mean residence time (MRT = AUMC0-∞/AUC0-∞), total clearance (CLtot = Dose/AUC0-∞) and volume of distribution (Vd = CLtot/Ke).
In Vivo Efficacy and Elimination Studies in IO Mice
The serum ferritin efficacy study for NG1-DFO was conducted in accordance with University of Wisconsin-Madison’s AICUC guidelines and the NIH Guide for the Care and Use of Laboratory Animals. Female Balb/C mice, 6–8 weeks old, were housed in Innovive static microisolator cages in a room maintained at 20 ± 1 °C and with 12h light/dark cycles. Feed and water were available ad libitum. Iron overload was achieved by single tail vein injection of dextran/Fe (150 mg/kg Fe, 10 µl/g body weight in normal saline) on Day 1. It was previously shown that this amount of dextran/Fe was sufficient to produce iron overload in mice after a week.(Imran ul-haq et al., 2013; Liu et al., 2016a) Three groups of mice (n=3 per metabolic chamber) were started on iron-deficient powder diet (Teklad TD.80396.PWD) ad libitum on Day 6. On Days 8, 10, and 12, the following formulations were administered via single tail vein injections to mice: Group 1 received normal saline injections, Group 2 received DFO, and Group 3 received NG1-DFO at an equivalent dose of 150 mg/kg DFO (final administration volumes were all adjusted to 10 µl/g body weight in normal saline). On Day 19, mice were euthanized by CO2 overdose and blood was collected directly from cardiac puncture and put into anticoagulating tubes (Terumo CapiJect). Blood samples were added to microcentrifuge tubes to collect serum and ferritin measurement by ELISA was conducted according to the manufacturer’s instructions (Immunology Consultants Laboratory, Inc.).
To monitor elimination, feces and urine from metabolic cages were collected daily and weighed from Day 6 onward till Day 19. Urine and feces were pooled and total iron eliminated at the end of the study was measured by standard AAS (GBC Scientific Equipment model 932AA). Urine was diluted 1:1 with distilled water and cleared by centrifugation (2000 g’s for 10 min at 4C) prior to AAS measurements. Fecal material was homogenized in distilled water, iron was extracted by adding 5% trichloroacetic acid in 1.5N HCl to samples and heating to 70°C for 90 min before clarifying by centrifugation prior to AAS measurements.
Statistical Analysis
Statistical analysis was performed with GraphPad Prism 5.0 software. Statistical significance of the difference between two groups was tested with Student’s t-test. Two-tailed p<0.05 was considered statistically significant.
Results and Discussion
Physical Characterizations
Water-in-hexane emulsions stabilized via anionic AOT and nonionic Brij30 surfactants were used as nanoreactor templates for polymerizing NG1 and NG2 scaffolds in the presence of starting monomers AAm, hGMA, and PED-DA. By using a 5:10 (w/w) AOT to Brij30 ratio, NG1-DFO particles measuring 36 ± 3 nm with a PDI of 0.08 ± 0.0.03 were generated; conversely when the surfactant ratio was switched to 10:5, NG2-DFO particles generated measured 101 ± 13 nm with a PDI of 0.17 ± 0.0.03. A representative DLS size distribution plot and corresponding TEM image for NG1-DFO shows excellent correlation between apparent size and morphology (Fig. 1b–c).
Both NG1-DFO and NG2-DFO generated were within the 20–150 nm ideal size range for targeting liver and spleen.(Blanco et al., 2015) The zeta potential for NG1-DFO before and after chelation to Fe(III) did not significantly change, with NG1-DFO measuring −4.3 ± 0.3 mV and NG1-FeA measuring +1.2 ± 0.3 mV; similarly, the zeta potential for NG2-DFO was −8.8 ± 0.3 mV and NG2-FeA measured −8.2 ± 0.2 mV. Since most nanoparticles with zeta potentials between −10 mV and +10 mV are considered neutral,(Clogston and Patri, 2011) both nanogels prepared remained neutral regardless of complexation state. Finally, the apparent Mn for NG1-DFO was found to be 74 kDa and 167 kDa for NG2-DFO based on GPC calibration standards. In general there was excellent correlation between both UV-Vis and AAS methodologies for calculating DFO concentrations in each scaffold, with AAS measurements being consistently slightly higher than those measured by the UV-Vis method at 17.3% vs. 16.4% for NG1-DFO and 16.8% vs. 16.0% for NG2-DFO respectively. By using the apparent Mn obtained and the average DFO concentration, the apparent number of DFO conjugated was estimated to be 22 for NG1-DFO and 49 for NG2-DFO. Physical characterizations for each NG scaffold are summarized in Table 1.
Table 1.
Preparation and characterization of NG-DFO. To prepare emulsion templates, the weight ratio of hexane to the aqueous phase was kept at 80:5 and only the AOT to Brij30 ratio as indicated was varied. Note that the weight ratio of AAm to hGMA to PEG-DA was kept at 100:50:25.
| NG | AOT:Brij30 | Diameter, nm |
PDI | Zeta, mV − Fe(III) |
Zeta, mV + Fe(III) |
Mn* (kDa) |
#DFO/NG |
|---|---|---|---|---|---|---|---|
| NG1-DFO | 5:10 | 36 ± 3 | 0.08 ± 0.03 | − 4.3 ± 0.3 | + 1.2 ± 0.3 | 74 | 22 |
| NG2-DFO | 10:5 | 101 ± 13 | 0.17 ± 0.03 | − 8.8 ± 0.3 | − 8.2 ± 0.2 | 167 | 49 |
Apparent number-average molecular weight (Mn) was determined by GPC based on dextran standards
In Vitro Cytotoxicity and Ferritin Reduction Studies
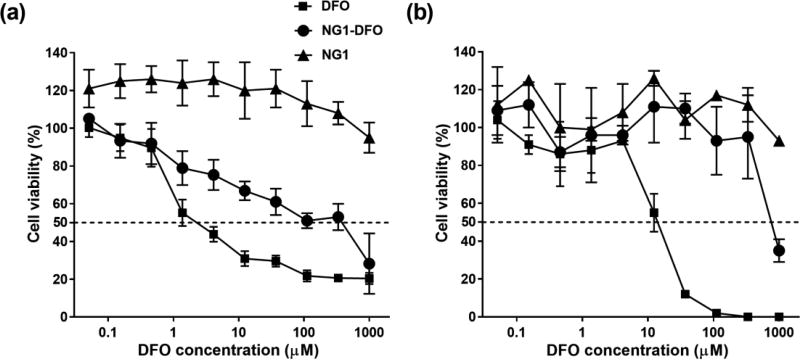
The cytotoxicity of NG-DFO was tested on HUVEC and J774A.1 mouse monocyte/macrophage cells. HUVEC are primary cells and therefore much more sensitive to the inhibitory effects of toxic drugs and provide a good benchmark for comparison. DFO inhibited 50% cell viability at concentrations as low as ca. 3 µM in HUVEC, which is within the range reported by others (Imran ul-haq et al., 2013; Rossi et al., 2009), compared to NG1-DFO which displayed ca. 100-fold less cytotoxicity to HUVEC. Furthermore, the NG1 scaffold itself was not toxic to HUVEC up to 3 mg/ml tested which corresponded to 1 mM equivalent DFO (Fig. 2a). Similar data was obtained in J774A.1 mouse macrophages where DFO inhibited 50% cell viability at ca. 15 µM and NG1-DFO inhibited 50% cell viability at ca. 800 µM (Fig. 2b).
Fig. 2.
Cytotoxicity of DFO, NG1-DFO and NG1 on HUVEC cells (a) and mouse J774A.1 macrophage cells (b) after 48 h incubation.
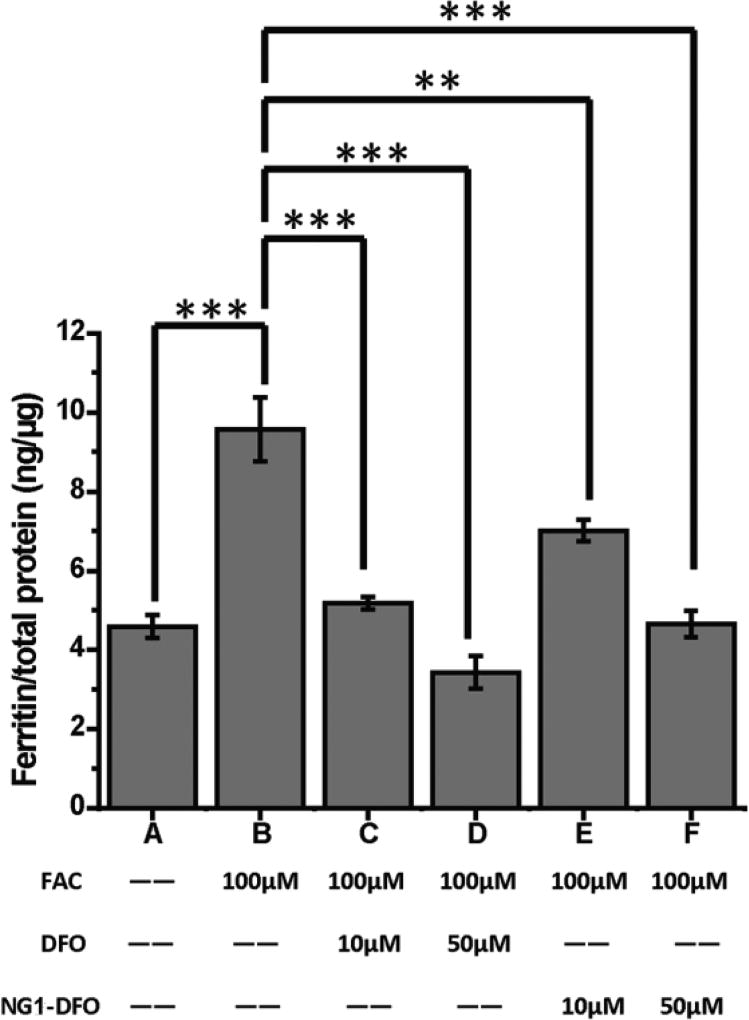
Since degree of IO can be assessed based on the indirect overexpression of ferritin in macrophages, IO was induced in J774A.1 macrophage cells by incubating the cells for 24 h with media supplemented with 100 µM FAC. As shown in Fig. 3, 100 µM FAC treatment increased cellular ferritin expression from baseline levels of 4.59 ng/µg total protein (bar A) to 9.58 ng/µg (bar B). Cells were then treated with either DFO or NG1-DFO for 48 h at 10 µM or 50 µM equivalent DFO concentrations. At 10 µM, DFO reduced the cellular ferritin level from 9.58 ng/µg to 5.18 ng/µg (p < 0.001) (bar C) and at 50 µM DFO reduced the ferritin level from 9.58 ng/µg to 3.43 ng/µg (p < 0.001) (bar D).
Fig. 3.
J774A.1 cells were iron-overloaded by incubation with 100 µM FAC for 24 h prior to addition of treatments; cells were treated with DFO or NG1-DFO at equivalent concentrations of 10 µM or 50 µM DFO for 48h and cellular ferritin was measured by mouse ferritin ELISA assay; results are normalized to total protein (ng/µg) and presented as mean ± SD (n = 3) where **p< 0.01 and ***p< 0.001.
At 10 µM equivalent DFO concentration, NG1-DFO decreased the ferritin level from 9.58 ng/µg to 7.00 ng/µg (p < 0.01) (bar E) and at 50 µM the cellular ferritin level decreased from 9.58 ng/µg to 4.66 ng/µg (p < 0.001) (bar F). The data essentially confirms NG1-DFO’s ability to reduce ferritin concentration in IO macrophage cells and is particularly relevant since the majority of iron release from ferritin in cells occurs in conjunction with lysosomal proteolysis,(Kidane et al., 2006; Theil, 2009) and it has also been directly demonstrated via confocal microscopy that iron-chelating macromolecules do in fact localize to lysosomes of IO macrophages.(Liu et al., 2017)
Pharmacokinetics and Biodistribution Studies in Rats
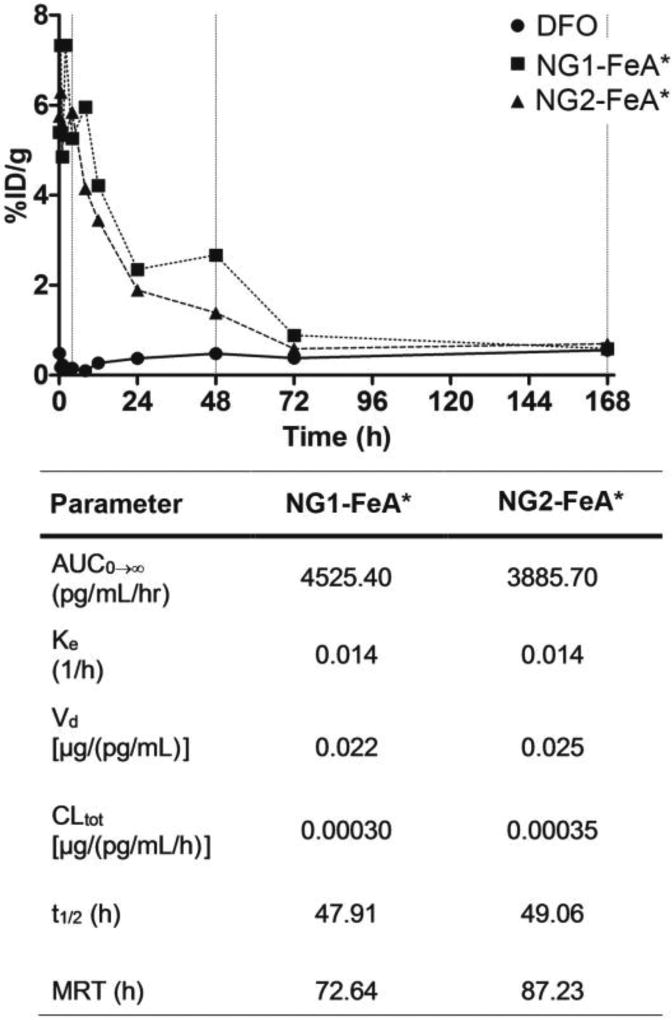
The PK/BD of NG-DFO conjugates were evaluated in the normal rat. The concentration-time profile for radiolabeled DFO:Fe(III)* (FeA*) exhibited such a rapid distribution and elimination phase after the single bolus tail-vein injection into the rat that PK parameters for this metabolite could not be extracted, however the t1/2 of DFO in the rat has been reported to be 0.2 h (ca. 12 min) for a daily infused dose of DFO administered at 195 mg/kg.(Merali et al., 1995) Although PK properties of DFO and its metabolite FeA in humans have been reported to be slightly different in healthy patients versus those with hemochromatosis,(Allain et al., 1987) it is not clear how relevant this difference may be in rodents therefore the t1/2=0.2 h for DFO may a reasonable approximation for FeA* in the rat. It was nevertheless quite apparent that NG1-FeA* and NG2-FeA* dramatically increased the AUC0-∞ of FeA* to similar levels of 4525 and 3886 pg/ml/hr respectively compared to FeA*. Overall, all the PK parameters between the two NG-FeA* preparations were fairly comparable since their size and surface properties were not different enough to vastly affect PK properties. Based on non-compartmental analysis (NCA), NG1-FeA* circulated for a long time in the plasma and was characterized by a single t1/2 =48 h and an MRT=73 h, and NG2-FeA* was characterized by a single t1/2 =49 h and an MRT=87 h (Fig.4). A meaningful discussion comparing the apparent volume of distribution (Vd) and total clearance (CLtot) between FeA* versus NG-FeA* are unfortunately also limited due to the lack of data for FeA* in the rat, but it is reasonable to postulate that CLtot of NG-FeA* would likely be highly affected by the rate of ester hydrolysis of the NG scaffolds in vivo.
Fig 4.
Pharmacokinetic profiles (only the mean is shown) for FeA*, NG1-FeA* (ca. 36 nm) and NG2-FeA* (ca. 101 nm), and accompanying PK parameters. Note that biodistribution and clearance of FeA* from the rat was too rapid to generate meaningful PK variables. Key: AUC=area under the curve; Ke=elimination rate constant; Vd=volume of distribution; CLtot=total clearance; t1/2 = half-life; MRT=mean residence time.
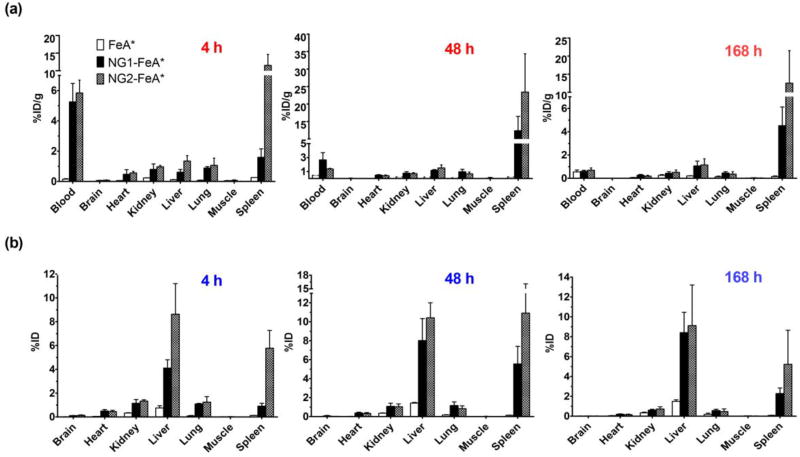
For the BD study, rats were sacrificed at three different time points of 4, 48, and 168 h post-injection of test samples. In general, Fig. 5 shows the concentration of NG-FeA* present in the blood at 4 h decreasing over time as it distributed first into highly vascularized tissues such as the spleen and liver. The %ID/g trend for the larger NG2-FeA* is very high in spleen at 4 h compared to the smaller NG1-FeA*, increases even further by 48 h near the half-life and decreases again by 168 h, suggestive of eventual clearance from the organ. For the smaller NG1-FeA*, less of the %ID/g localize to the spleen compared to NG2-FeA*, but the trend is still similar and reveals increasing accumulation between 4 to 48 h followed by a decrease by 168 h, again suggestive of elimination. In general, larger particles appeared to accumulate faster into the liver and spleen in the earlier stages of distribution but by 168 h these differences due to size were not as pronounced. Overall it was evident from the BD data that based on neutral surface properties and size alone, both NG-FeA* were able to accumulate into liver and spleen.
Fig. 5.
Biodistribution trends for NG1-FeA* and NG2-FeA* at 4 h, 48 h, and 168 h are reported as %ID/g (a) and %ID for the whole organ (b).
In Vivo Efficacy and Elimination Studies in IO Mice
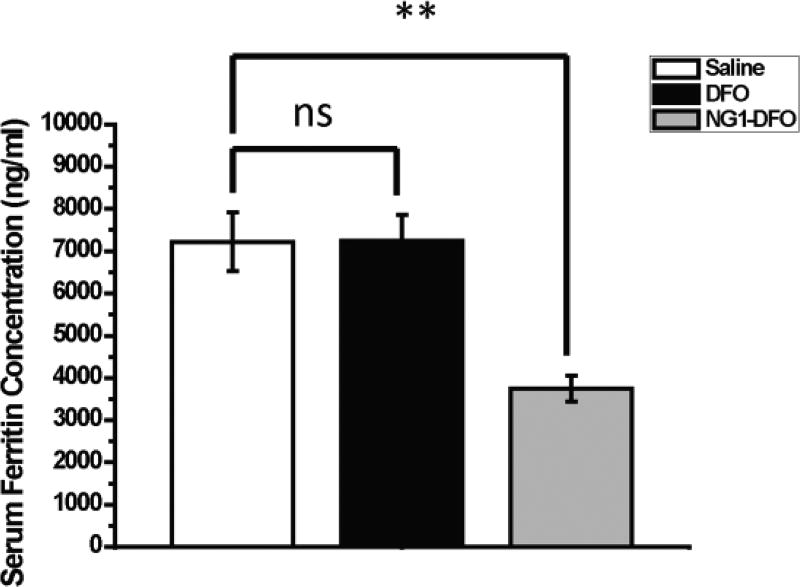
Normal female Balb/C mice (6 weeks old) were intravenously IO by a single tail vein injection of 150 mg/kg dextran/Fe. After a week of monitoring animals to ensure IO as assessed by serum ferritin measurements, mice were treated with 3 separate doses of either saline, DFO, or NG1-DFO at an equivalent dose of 150 mg/kg DFO every 2 days followed by a week of rest prior to sacrifice. Compared to saline-treated rodents, it was found that the serum ferritin levels in IO mice decreased significantly only in mice that had been treated with NG1-DFO (p< 0.01) but not DFO (ns) (Fig. 6). This data suggests that the prolonged circulation of NG1-DFO coupled with preferential localization to liver and spleen may have contributed to more effective serum ferritin reduction levels in IO mice.
Fig. 6.
Serum ferritin levels of IO mice after treatment with three doses of saline, 150 mg/kg free DFO, or 150 mg/kg equivalent NG1-DFO. **p< 0.01 and ns = not statistically significant.
Total renal and fecal elimination was determined by AAS and the results are shown in Fig. 7. There was a significant increase in total iron exclusion through urine and feces for DFO and NG1-DFO compared to saline-treated mice (both p<0.01), although elimination for NG1-DFO was inefficient. This likely results from the stability of NG1-DFO in vivo since degradation and exclusion of the nanogel scaffold into fragments small enough for renal and fecal clearance were not controlled (e.g. could have been too large for renal elimination) and would furthermore be expected to be a comparatively slow process on the timescale of weeks via ester hydrolysis as was previously shown in vitro.(Rossi et al., 2009) The controlled degradation of nanogels into appropriate fragment sizes below that of the renal threshold may help eliminate potential patient safety concerns associated with possible organ retention of the iron-bound materials, and is especially relevant for iron chelation therapy since a vast majority of nanoparticles for drug delivery applications have indeed been reported to sequester in spleen and liver for months.(Zhang et al., 2016) Ultimately, the data points to the need to balance the improved PK properties of iron-chelating macromolecules with their rapid controlled degradation into products small enough for renal and fecal elimination.
Fig. 7.
Total iron excreted in urine (a) and feces (b) over the course of the treatment period for IO mice treated with three doses of saline, DFO, or NG1-DFO. **p<0.01.
Conclusions
NG-DFO reduced the cytotoxicity of DFO in J774A.1 macrophage and HUVEC cells and significantly reduced cellular ferritin levels in vitro in IO macrophages. PK/BD studies in normal rats revealed that NG1-FeA* (ca. 36 nm) was characterized by t1/2=48 h and an MRT=73 h and NG2-FeA* (ca. 101 nm) was characterized by t1/2 =49 h and an MRT=87 h; results from the BD study points to the preferential accumulation of both NG-FeA* into the liver and spleen of rodents. IO mice treated with NG1-DFO presented significantly lower levels of serum ferritin in contrast to DFO. There was a significant increase in total iron exclusion for NG1-DFO and DFO compared to saline-treated mice, but elimination for NG1-DFO was inefficient due to comparatively slow ester hydrolysis in vivo. A balance between circulation (improving PK properties) coupled with controlled degradation products below the renal threshold (improving elimination) need to be considered when designing macromolecules for iron chelation therapy.
Supplementary Material
Acknowledgments
This project was supported by NIH grant R01DK099596.
Footnotes
Publisher's Disclaimer: This is a PDF file of an unedited manuscript that has been accepted for publication. As a service to our customers we are providing this early version of the manuscript. The manuscript will undergo copyediting, typesetting, and review of the resulting proof before it is published in its final citable form. Please note that during the production process errors may be discovered which could affect the content, and all legal disclaimers that apply to the journal pertain.
References
- Allain P, Mauras Y, Chaleil D, Simon P, Ang KS, Cam G, Le Mignon L, Simon M. Pharmacokinetics and renal elimination of desferrioxamine and ferrioxamine in healthy subjects and patients with haemochromatosis. Br J Clin Pharmacol. 1987;24:207–212. doi: 10.1111/j.1365-2125.1987.tb03163.x. [DOI] [PMC free article] [PubMed] [Google Scholar]
- Andrews NC. Disorders of iron metabolism. N Engl J Med. 1999;341:1986–1995. doi: 10.1056/NEJM199912233412607. [DOI] [PubMed] [Google Scholar]
- Andrews NC. Forging a field: the golden age of iron biology. Blood. 2008;112:219–230. doi: 10.1182/blood-2007-12-077388. [DOI] [PMC free article] [PubMed] [Google Scholar]
- Blanco E, Shen H, Ferrari M. Principles of nanoparticle design for overcoming biological barriers to drug delivery. Nat Biotechnol. 2015;33:941–951. doi: 10.1038/nbt.3330. [DOI] [PMC free article] [PubMed] [Google Scholar]
- Clogston JD, Patri AK. Zeta potential measurement. Methods in molecular biology. 2011;697:63–70. doi: 10.1007/978-1-60327-198-1_6. [DOI] [PubMed] [Google Scholar]
- Daubresse C, Grandfils C, Jerome R, Teyssie P. Enzyme immobilization in nanoparticles produced by inverse microemulsion polymerization. Journal of colloid and interface science. 1994;168:222–229. [Google Scholar]
- Goodwin JF, Whitten CF. Chelation of Ferrous Sulphate Solutions by Desferrioxamine B. Nature. 1965;205:281–283. doi: 10.1038/205281b0. [DOI] [PubMed] [Google Scholar]
- Hallaway PE, Eaton JW, Panter SS, Hedlund BE. Modulation of deferoxamine toxicity and clearance by covalent attachment to biocompatible polymers. Proceedings of the National Academy of Sciences. 1989;86:10108–10112. doi: 10.1073/pnas.86.24.10108. [DOI] [PMC free article] [PubMed] [Google Scholar]
- Hamilton JL, Kizhakkedathu JN. Polymeric nanocarriers for the treatment of systemic iron overload. Molecular and Cellular Therapies. 2015;3:3. doi: 10.1186/s40591-015-0039-1. [DOI] [PMC free article] [PubMed] [Google Scholar]
- Imran ul-haq M, Hamilton JL, Lai BF, Shenoi RA, Horte S, Constantinescu I, Leitch HA, Kizhakkedathu JN. Design of long circulating nontoxic dendritic polymers for the removal of iron in vivo. ACS Nano. 2013;7:10704–10716. doi: 10.1021/nn4035074. [DOI] [PubMed] [Google Scholar]
- Kidane TZ, Sauble E, Linder MC. Release of iron from ferritin requires lysosomal activity. Am J Physiol Cell Physiol. 2006;291:C445–455. doi: 10.1152/ajpcell.00505.2005. [DOI] [PubMed] [Google Scholar]
- Ladis V, Chouliaras G, Berdousi H, Kanavakis E, Kattamis C. Longitudinal study of survival and causes of death in patients with thalassemia major in Greece. Ann N Y Acad Sci. 2005;1054:445–450. doi: 10.1196/annals.1345.067. [DOI] [PubMed] [Google Scholar]
- Lee P, Mohammed N, Marshall L, Abeysinghe RD, Hider RC, Porter JB, Singh S. Intravenous infusion pharmacokinetics of desferrioxamine in thalassaemic patients. Drug metabolism and disposition. 1993;21:640–644. [PubMed] [Google Scholar]
- Levine JE, Cohen A, MacQueen M, Martin M, Giardina PJ. Sensorimotor neurotoxicity associated with high-dose deferoxamine treatment. J Pediatr Hematol Oncol. 1997;19:139–141. doi: 10.1097/00043426-199703000-00008. [DOI] [PubMed] [Google Scholar]
- Liu Z, Lin TM, Purro M, Xiong MP. Enzymatically Biodegradable Polyrotaxane-Deferoxamine Conjugates for Iron Chelation. ACS Appl Mater Interfaces. 2016a;8:25788–25797. doi: 10.1021/acsami.6b09077. [DOI] [PMC free article] [PubMed] [Google Scholar]
- Liu Z, Purro M, Qiao J, Xiong MP. Multifunctional Polymeric Micelles for Combining Chelation and Detection of Iron in Living Cells. Adv Healthc Mater. 2017;6 doi: 10.1002/adhm.201700162. [DOI] [PMC free article] [PubMed] [Google Scholar]
- Liu Z, Wang Y, Purro M, Xiong MP. Oxidation-Induced Degradable Nanogels for Iron Chelation. Sci Rep. 2016b;6:20923. doi: 10.1038/srep20923. [DOI] [PMC free article] [PubMed] [Google Scholar]
- Merali S, Chin K, Del Angel L, Grady RW, Armstrong M, Clarkson AB., Jr Clinically achievable plasma deferoxamine concentrations are therapeutic in a rat model of Pneumocystis carinii pneumonia. Antimicrob Agents Chemother. 1995;39:2023–2026. doi: 10.1128/aac.39.9.2023. [DOI] [PMC free article] [PubMed] [Google Scholar]
- Neilands JB. Microbial iron compounds. Annu Rev Biochem. 1981;50:715–731. doi: 10.1146/annurev.bi.50.070181.003435. [DOI] [PubMed] [Google Scholar]
- O'Brien J, Wilson I, Orton T, Pognan F. Investigation of the Alamar Blue (resazurin) fluorescent dye for the assessment of mammalian cell cytotoxicity. European journal of biochemistry / FEBS. 2000;267:5421–5426. doi: 10.1046/j.1432-1327.2000.01606.x. [DOI] [PubMed] [Google Scholar]
- Porter JB, Faherty A, Stallibrass L, Brookman L, Hassan I, Howes C. A Trial to Investigate the Relationship between DFO Pharmacokinetics and Metabolism and DFO-Related Toxicity. Annals of the New York Academy of Sciences. 1998;850:483–487. doi: 10.1111/j.1749-6632.1998.tb10528.x. [DOI] [PubMed] [Google Scholar]
- Rossi NA, Mustafa I, Jackson JK, Burt HM, Horte SA, Scott MD, Kizhakkedathu JN. In vitro chelating, cytotoxicity, and blood compatibility of degradable poly(ethylene glycol)-based macromolecular iron chelators. Biomaterials. 2009;30:638–648. doi: 10.1016/j.biomaterials.2008.09.057. [DOI] [PubMed] [Google Scholar]
- Theil EC. Mining ferritin iron: 2 pathways. Blood. 2009;114:4325–4326. doi: 10.1182/blood-2009-08-239913. [DOI] [PubMed] [Google Scholar]
- Zhang Y, Huo M, Zhou J, Xie S. PKSolver: An add-in program for pharmacokinetic and pharmacodynamic data analysis in Microsoft Excel. Comput Methods Programs Biomed. 2010;99:306–314. doi: 10.1016/j.cmpb.2010.01.007. [DOI] [PubMed] [Google Scholar]
- Zhang YN, Poon W, Tavares AJ, McGilvray ID, Chan WC. Nanoparticle-liver interactions: Cellular uptake and hepatobiliary elimination. J Control Release. 2016 doi: 10.1016/j.jconrel.2016.01.020. [DOI] [PubMed] [Google Scholar]
Associated Data
This section collects any data citations, data availability statements, or supplementary materials included in this article.


