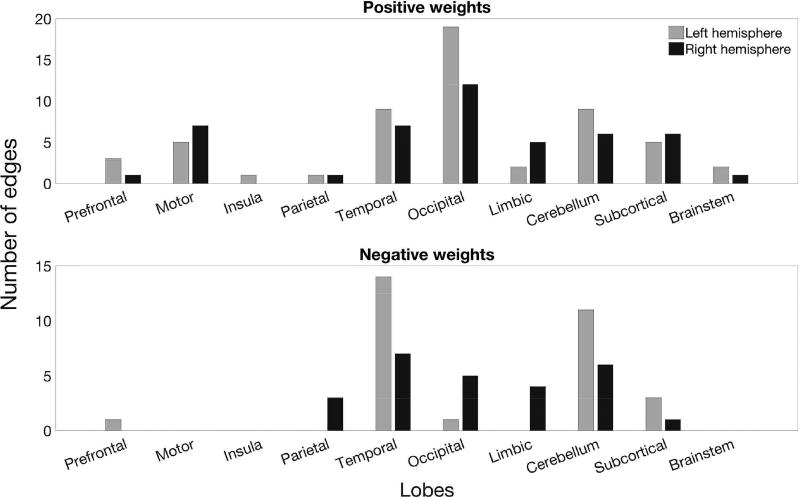
Figure 5. Edges with significant weights in the model using PLS regression to predict attention from Pearson’s correlation coefficients.
Bar plots show the number of edges with at least one node in each lobe. Occipital, temporal, and cerebellar regions had the highest number of edges with significant positive weights. Temporal and cerebellar regions also had the highest number of edges with significant negative weights. Every edge is represented twice in this figure – for example, a prefrontal-temporal connection is counted in both the prefrontal and temporal bars.

