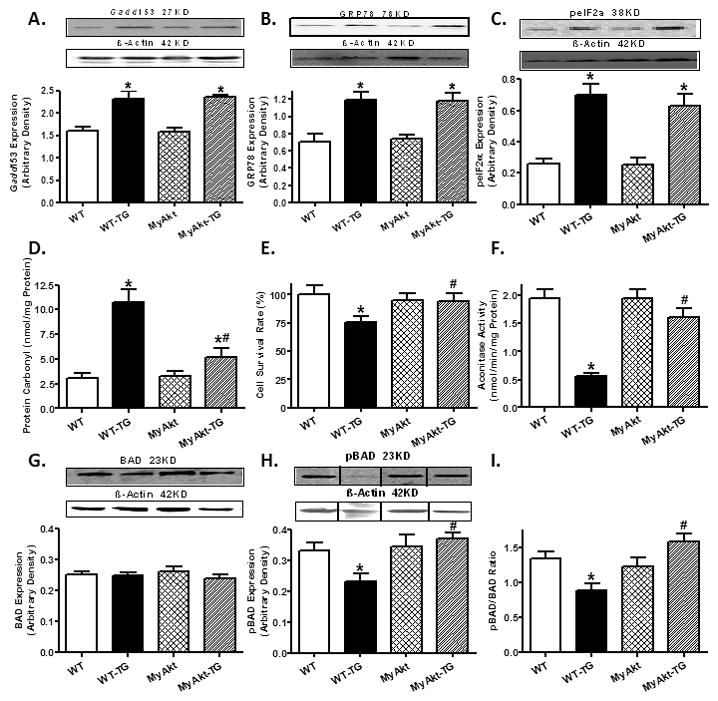
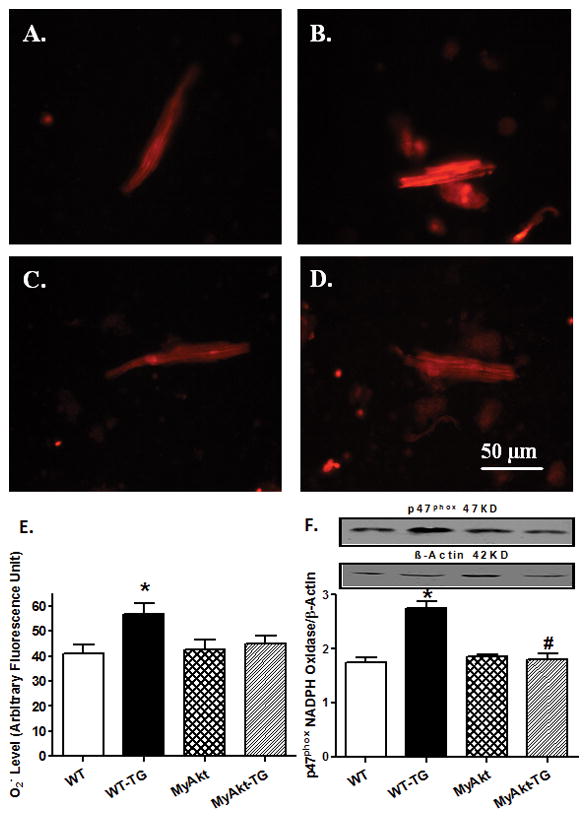
The authors regret to report errors in Fig. 3 and Fig. 5 as reported. During the assembly of representative gel bands in Fig. 3, non-continuous gel bands were used without proper acknowledgement of the non-continuous nature. In Fig. 5, representative DHE images were wrongly copied and pasted in 3 panels. All Western blotting and DHE staining data were re-analysed for accuracy and the summary graphs presented were minimally changed in values which did not affect the original conclusion for these figures. The authors would like to apologise for any inconvenience caused.
DOI of original article: < DOI: 10.1016/j.freeradbiomed.2011.09.005>
Fig. 3. Effect of ER stress on ER protein markers, protein/mitochondrial damage, level of pro-apoptotic protein and cell survival.

ER stress was induced with in vivo thapsigargin (3 mg/kg, i.p. for 48 hrs) prior to assessment of ER stress, protein carbonyl formation, cell survival, mitochondrial aconitase activity and the pro-apoptotic protein BAD in WT and MyAkt mouse hearts. A: Gadd153 expression; B: GRP78 expression; C: phosphor-eIF2α (peIF2α) expression; D: Protein carbonyl levels; E: Cell survival using MTT assay; F: Aconitase activity. G: BAD expression; H: pBAD expression; and I: pBAD-to-BAD ratio. Insets: Representative gel blots depicting Gadd153, GRP78, peIF2α, BAD and pBAD using specific antibodies (β-actin was used as the loading control); Mean ± SEM, n = 5–7 hearts per group, * p < 0.05 vs. WT group, # p < 0.05 vs. WT-Thapsigargin (TG) group.
Fig. 5. Effect of ER stress on superoxide (O2−) production and NADPH oxidase.

ER stress was induced with in vivo thapsigargin challenge (3 mg/kg, i.p., 48 hrs) before O2− production and p47phox subunit of NADPH oxidase were evaluated by DHE fluorescence and western blot, respectively, in myocardium from adult WT and MyAkt mice. A–D: DHE fluorescence images depicting O2− fluorescence intensity from WT (A), WT-TG (B), MyAkt (C) and MyAkt-TG (D) groups; E: Quantified data displaying O2− fluorescent intensity from 9–11 fields; and F: p47phox expression; Inset: Representative gel blots depicting p47phox and β-actin (loading control) using specific antibodies; Mean ± SEM, n = 5–7 mice per group, * p < 0.05 vs. WT group; # p < 0.05 vs. WT-Thapsigargin (TG) group.
Contributor Information
Yingmei Zhang, Department of Cardiology, Xijing Hospital, Fourth Military Medical University, Xi’an 710032, China.
Jun Ren, Center for Cardiovascular Research and Alternative Medicine, University of Wyoming, Laramie, WY 82071, USA.


