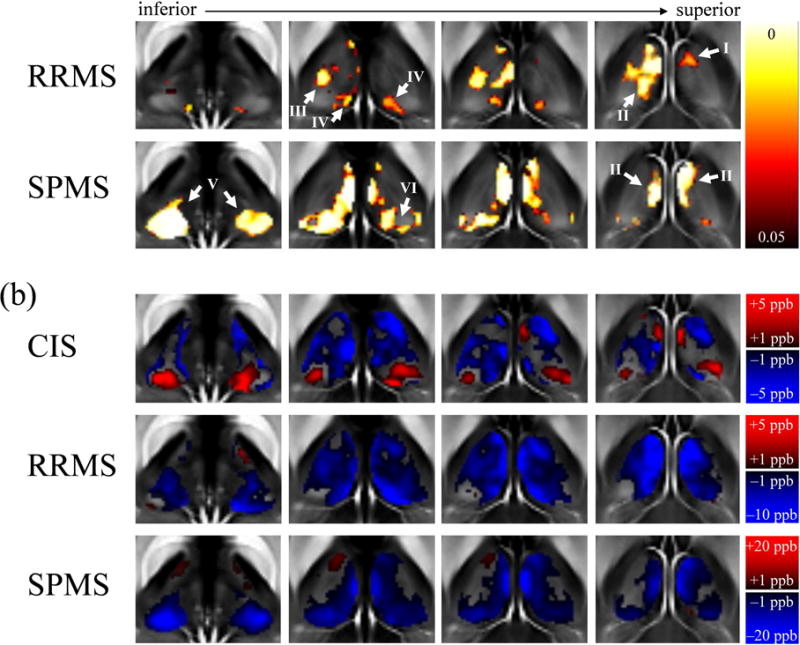
Figure 2.

Results of the voxel-based analysis. (a) Regions in which differences between patients and controls reached statistical significance. Shown are voxels with a p-value below 0.05 (color-coding) after TFCE in selected slices (white circles in Fig. 1). The corresponding overview of the results in the whole thalamus is shown in Fig. S.3 in the Supplementary Material. (b) Voxel-based group-average differences of magnetic susceptibility between the patient and their corresponding NC groups (top to bottom) in selected slices, illustrating the magnitude and direction of the group differences in every voxel. Note the differences in contrast between the groups (color bars). The corresponding overview of the results in the whole thalamus is shown in Fig. S.4 along with the Z-scores
