Abstract
The most frequently used oral anti-coagulant warfarin has been implicated in inducing calcification of aortic valve interstitial cells (AVICs), whereas the mechanism is not fully understood. The low-level activation of p53 is found to be involved in osteogenic transdifferentiation and calcification of AVICs. Whether p53 participates in warfarin-induced AVIC calcification remains unknown. In this study, we investigated the role of low-level p53 overexpression in warfarin-induced porcine AVIC (pAVIC) calcification. Immunostaining, quantitative PCR, and Western blotting revealed that p53 was expressed in human and pAVICs and that p53 expression was slightly increased in calcific human aortic valves compared with non-calcific valves. Terminal deoxynucleotidyltransferase-mediated dUTP nick end labeling staining indicated that apoptosis slightly increased in calcific aortic valves than in non-calcific valves. Warfarin treatment led to a low-level increase of p53 mRNA and protein in both pAVICs and mouse aortic valves. Low-level overexpression of p53 in pAVICs via an adenovirus vector did not affect pAVIC apoptosis but promoted warfarin-induced calcium deposition and expression of osteogenic markers. shRNA-mediated p53 knockdown attenuated the pAVIC calcium deposition and osteogenic marker expression. Moreover, ChIP and luciferase assays showed that p53 was recruited to the slug promoter and activated slug expression in calcific pAVICs. Of note, overexpression of Slug increased osteogenic marker Runx2 expression, but not pAVIC calcium deposition, and Slug knockdown attenuated pAVIC calcification and p53-mediated pAVIC calcium deposition and expression of osteogenic markers. In conclusion, we found that p53 plays an important role in warfarin induced pAVIC calcification, and increased slug transcription by p53 is required for p53-mediated pAVIC calcification.
Keywords: apoptosis, calcification, cardiovascular disease, p53, transcription regulation, aortic valve interstitial cell, warfarin
Introduction
The tumor suppressor p53 plays important roles in cell cycle regulation, apoptosis, and DNA damage (1), as well as in osteoblastic differentiation and bone development. Deletion of the p53 inhibitor MDM2 in osteoblast lineage cells leads to increased p53 production and suppression of bone organogenesis and homeostasis, whereas deletion of p53 accelerates osteoblast cell differentiation and bone formation (2, 3). In addition, using p53 knockout mice with chronic kidney disease, Li et al. (4) showed that p53 negatively regulates osteogenic differentiation of vascular smooth muscle cells and aortic calcification, suggesting that the p53 is involved in pathological tissue calcification.
The vitamin K antagonist, warfarin, is the most frequently used oral anti-coagulant to treat thromboprophylaxis in the presence of atrial fibrillation or a mechanical prosthetic heart valve. Recently, human and animal studies have implicated warfarin use with vascular and valvular calcification. Long-term warfarin treatment impairs vitamin K-dependent modification of many proteins, including MGP (matrix Gla protein), inhibits the BMP2 (bone morphogenetic protein 2) and BMP4 (bone morphogenetic protein 4) pathway (5, 6), and increases vascular and aortic valve calcification (7, 8). In hemodialysis patients, warfarin is associated with severe aortic valve calcification and is considered to be a prognostic factor for early-stage calcific aortic valve disease (9). Understanding the molecular mechanism of warfarin-induced aortic valve calcification is important to develop preventives or therapeutics. It has recently been shown that the long non-coding RNA H19 in aortic valve interstitial cells (AVICs)5 regulates Notch1 by preventing recruitment of p53 to the Notch1 promoter and thereby promotes calcification (10), indicating that p53 functions a transcription factor during AVIC calcification. Calcification of vascular smooth muscle cells can be induced with a 10 μm therapeutic level of warfarin (11, 12). However, whether this therapeutic level of warfarin leads to AVIC calcification and the details of the role that p53 plays in warfarin-induced AVIC calcification remains unknown.
In this study, we examined the effects of low-level overexpression and down-regulation of p53 on warfarin-induced porcine AVIC (pAVIC) calcification. In contrast to the effects of p53 activation and down-regulation seen in osteoblastic progenitor cells, we found that low-level overexpression of p53 increased warfarin-induced pAVIC calcification and that down-regulation of p53 attenuated warfarin-induced pAVIC calcification. Mechanistically, p53 increased expression of Slug, a downstream target gene, which promotes pAVIC osteogenic transdifferentiation but does not increase calcium deposition. Our data demonstrate that p53 is an important regulator of pAVIC calcification.
Results
p53 expression in human calcific and non-calcific aortic valves
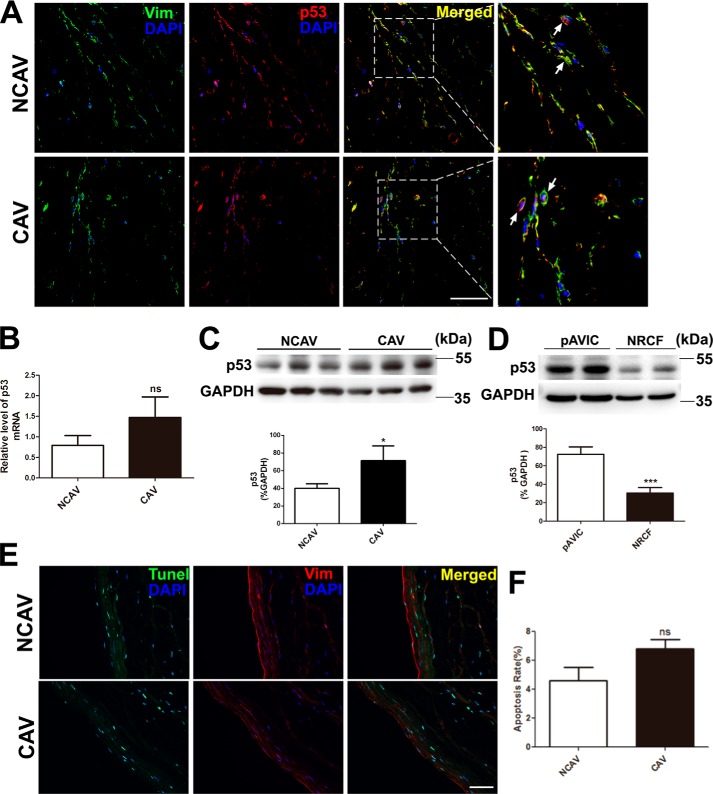
We analyzed p53 expression in human aortic valve leaflets. Immunostaining showed that p53 was expressed in calcific aortic valves from patients with rheumatic cardiac valvular disease who received long-term warfarin therapy and in non-calcific control aortic valves (Fig. 1A). Quantitative PCR showed that p53 expression was higher in calcific aortic valves than in non-calcific aortic valves, but the difference was not statistically significant (Fig. 1B). Western blotting showed that the protein level of p53 was significantly higher in calcific aortic valves than in non-calcific aortic valves (Fig. 1C). To determine whether p53 is expressed in normal AVICs, we compared p53 expression in cultured pAVICs and rat cardiofibroblast cells. We found that p53 expression was higher in pAVICs than in rat cardiofibroblast cells (Fig. 1D). In addition, we performed TUNEL staining to analyze apoptosis in calcific aortic valves and found that many of the apoptotic cells did not co-stain with the AVIC marker vimentine. Further, the number of TUNEL-positive cells was slightly higher in calcific aortic valves than in non-calcific aortic valves (Fig. 1, E and F).
Figure 1.
p53 expression and the TUNEL assay in human aortic valves and pAVICs. Human calcific and non-calcific aortic valve tissues were harvested for immunostaining and qPCR. A, representative images of immunofluorescent staining of human aortic valves with the indicated antibodies. B, p53 expression levels in calcific and non-calcific human aortic valves were assessed by qPCR (n = 6 for each group). C, protein levels of p53 in calcific and non-calcific human aortic valves were assessed by Western blotting (n = 6 for each group). D, p53 protein levels in porcine AVICs and in rat cardiofibroblast cells were assessed by Western blotting. Relative protein levels were normalized to GAPDH. E, representative images of co-immunofluorescent staining of human aortic valves with the indicated antibodies and TUNEL. F, statistical analysis of apoptotic cells from stained valve sections (n = 6 for each group). Scale bar, 50 μm. Arrows indicate AVICs. Vim, vimentine; NCAV, non-calcific aortic valve; CAV, calcific rheumatic aortic valve; NRCF, cardiofibroblasts from newborn rats. The data are shown as the means ± S.E. of triplicates and are representative of three independent experiments. *, p < 0.05; **, p < 0.01; ***, p < 0.001; ns, not significant.
Low-level increase of p53 promotes warfarin-induced pAVIC calcification
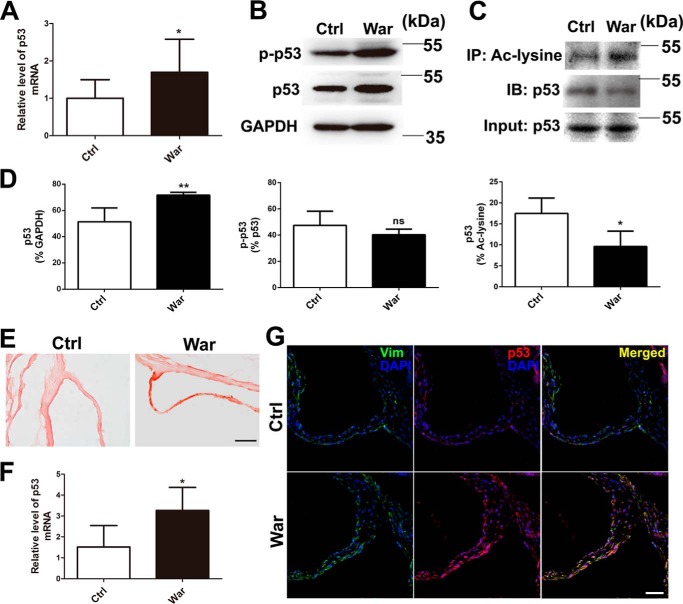
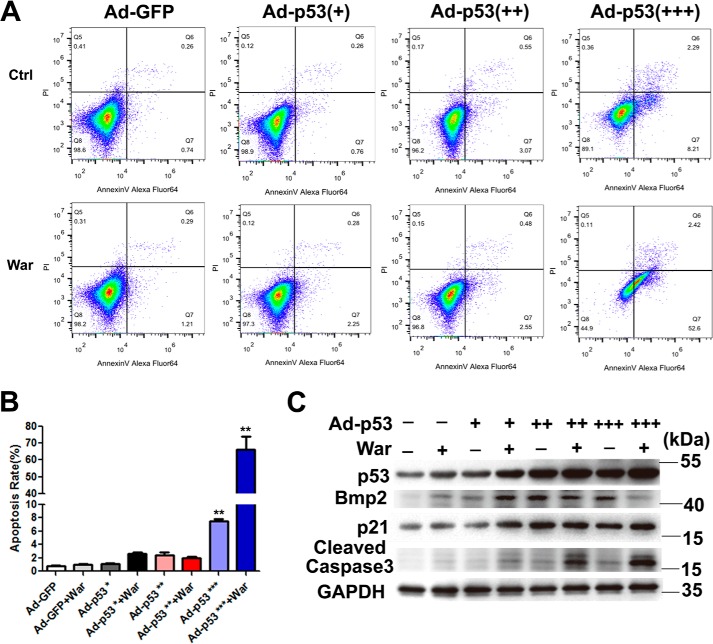
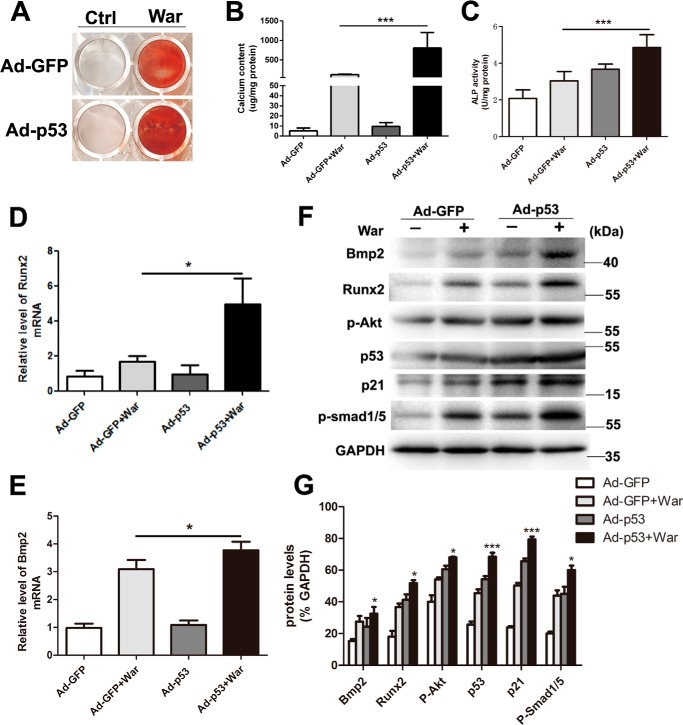
In addition to the well-known proapoptotic effect of robust p53 activation, p53 has also been shown to be a transcription factor involved in many biological processes (13–15), including osteogenic differentiation (2). In this study, we first examined the p53 expression and activation in pAVICs after warfarin treatment; we found that warfarin treatment slightly increased the mRNA and protein levels of p53 (Fig. 2 A, B, and D), and did not enhance the phosphorylation of p53 (Fig. 2, B and D), whereas warfarin reduced the acetylation of p53 (Fig. 2, C and D). To confirm whether warfarin-induced p53 elevation in AVICs existed in in vivo settings, we generated a warfarin-induced aortic valve calcification model using a slightly modified protocol as previously reported (16). Alizarin Red staining showed significant aortic valve calcification after warfarin treatment (Fig. 2E). The mRNA and protein levels of p53 were increased in warfarin group compared with control group (Fig. 2, F and G). Then we determined whether p53 is a non-apoptotic transcription factor involved in pAVIC calcification. We examined the effects of varying levels of p53 activity on pAVIC apoptosis and downstream targets. We found that a slight increase in the level of functional p53 activated expression of downstream target genes but did not promote apoptosis after warfarin treatment (Fig. 3, A–C). In addition, low-level overexpression of p53 enhanced warfarin-induced pAVIC calcification performed as increased Alizarin Red staining, ALP activity, and the cellular calcium content in pAVICs when compared with the control group (Fig. 4, A–C). Quantitative PCR also showed that p53 increased RNA expression of the osteogenic genes Bmp2 and Runx2 (Fig. 4, D and E). Western blotting analysis showed that p53 increased the protein levels of the downstream target p21 and calcification-associated proteins, including phosphorylated Akt (p-Akt), Bmp2, Runx2, and phosphorylated Smad1/5 (p-Smad1/5) (Fig. 4, F and G).
Figure 2.
The effects of warfarin on p53 expression. A, p53 mRNA levels with and without warfarin treatment were assessed by qPCR. B, protein levels of p53 and phosphorylation of p53 were assessed by Western blotting. C, acetylated p53 were immunoprecipitated by Ac-lysine antibody and blotted with p53 antibody. D, relative protein levels of p53, p-p53, and Ac-p53 were normalized to GAPDH, p53, and Ac-lysine. E, representative images of Alizarin Red staining of mouse aortic valve. F, p53 expression levels in calcific and control mouse aortic valves were assessed by qPCR (n = 5 for each group). G, representative images of immunofluorescent staining of mouse aortic valves with the indicated antibodies. Scale bar, 50 μm. *, p < 0.05; Ctrl, control; War, warfarin; IP, immunoprecipitation; IB, immunoblot; Vim, vimentine.
Figure 3.
The effects of different levels of p53 overexpression on the pAVIC apoptosis. A, apoptosis of pAVICs transfected with different concentrations of Ad-p53 vectors was assessed by flow cytometry using annexin V and PI antibody. Early apoptotic cell rates were located in the lower right quadrant. B, apoptotic cell rates were graphed from the percentage of early apoptotic cells (annexin-FITC–positive and PI–negative) over total cells by flowcytometry. C, protein levels of p53 and its downstream targets were assessed by Western blotting. The data are shown as the means ± S.E. of triplicates and are representative of three independent experiments performed. Ctrl, control; War, warfarin. +, 0.5 × 10⁷ pfu/ml of Ad-p53; ++, 1.0 × 10⁷ pfu/ml of Ad-p53; +++, 2.0 × 10⁷ pfu/ml of Ad-p53. *, p < 0.05; **, p < 0.01; ***, p < 0.001.
Figure 4.
Low-level overexpression of p53 promotes warfarin-induced pAVIC calcification. A and B, calcium deposition was assessed by Alizarin Red staining and measured with the QuantiChromTM calcium assay kit. C, ALP activity was measured to assess the degree of osteoblastic differentiation and calcification. D–G, expression of Runx2 and Bmp2 were assessed by qPCR and Western blotting. Expression of p53, p21, p-Akt, and p-Smad1/5 were assessed by Western blotting. The relative protein levels were normalized to GAPDH. The data are shown as the means ± S.E. of triplicates and are representative of three independent experiments performed. Ctrl, control; War, warfarin. *, p < 0.05; **, p < 0.01; ***, p < 0.001.
Knockdown of p53 attenuates warfarin-induced pAVIC calcification
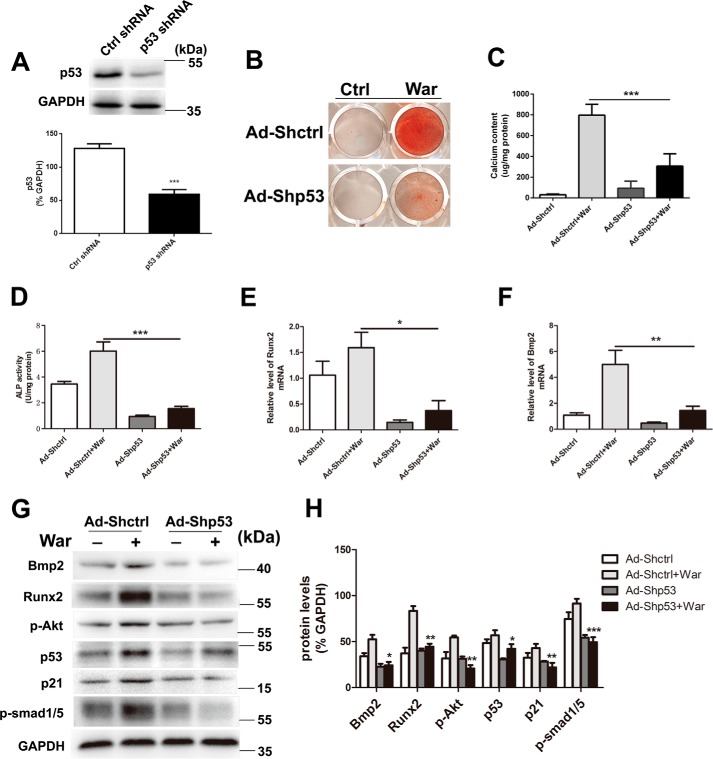
To confirm the role of p53 during warfarin-induced pAVIC calcification, we down-regulated p53 expression by RNA interference. After transfection with p53 shRNA (Fig. 5A), we found that this knockdown of p53 significantly attenuated warfarin-induced calcium deposition and ALP activity (Fig. 5, B–D). Knockdown of p53 also reduced mRNA expression of the osteogenic genes Bmp2 and Runx2 (Fig. 5, E and F). Western blotting showed that knockdown of p53 reduced protein expression of Bmp2, Runx2, p-Akt, p-Smad1/5, and p21 (Fig. 5, G and H).
Figure 5.
Knockdown of p53 attenuates warfarin-induced pAVIC calcification. A, the efficacy of shRNA for knockdown of p53 was assessed by Western blotting. The relative protein levels were normalized to GAPDH. B and C, calcium deposition was assessed by Alizarin Red staining and measured with the QuantiChromTM calcium assay kit. D, ALP activity was measured to assess the degree of osteoblastic differentiation and calcification. E–H, expression of Runx2 and Bmp2 were assessed by qPCR and Western blotting. Expression of p53, p21, p-Akt, and p-Smad1/5 were assessed by Western blotting. Relative protein levels were normalized to GAPDH. The data are shown as the means ± S.E. of triplicates and are representative of three independent experiments performed. Ctrl, control; War, warfarin. *, p < 0.05; **, p < 0.01; ***, p < 0.001.
p53 promotes pAVIC calcification by increasing slug transcription
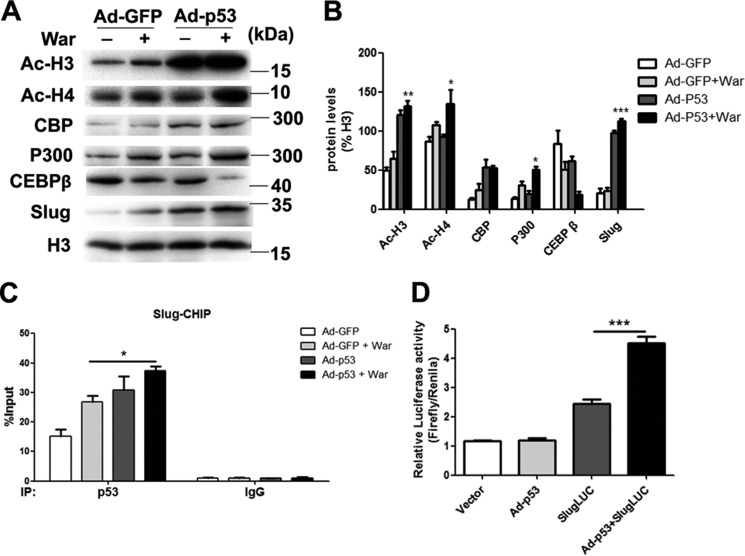
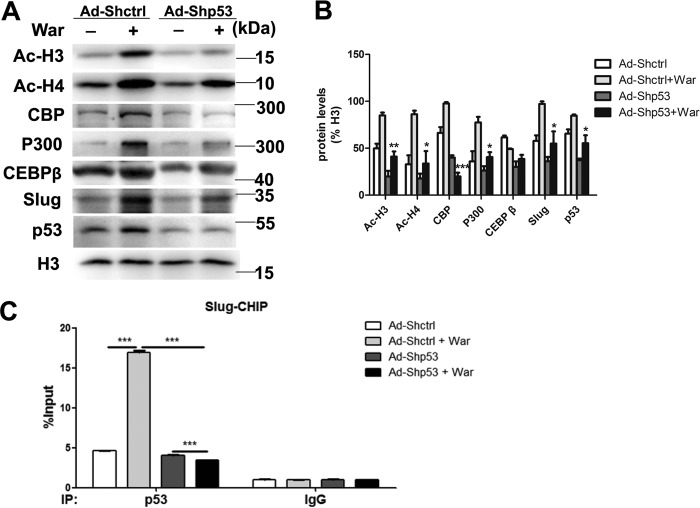
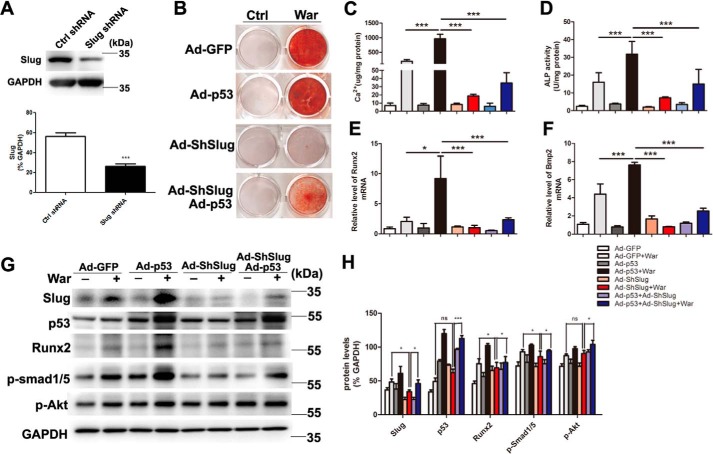
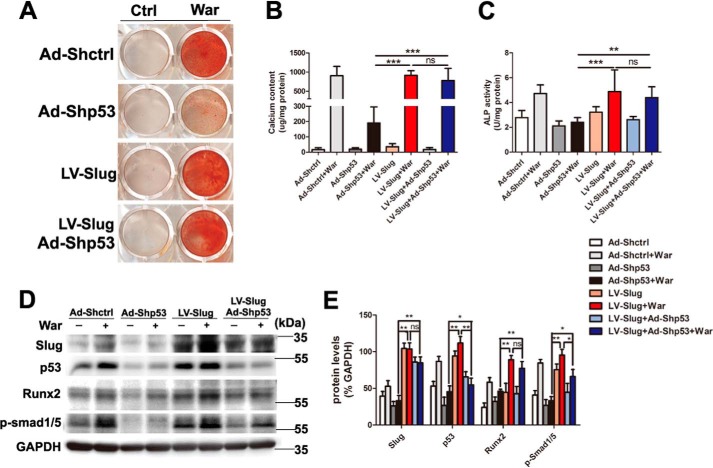
Because epigenetic changes of histone acetylation and associated histone acetyltransferase p300 and CREB-binding protein (CBP) have been reported promoting osteoblastic maturation and AVIC calcification (17–19), to dissect the mechanism of p53-regulated pAVIC calcification, we analyzed the epigenetic changes induced by p53. Low-level activation of p53 led to a significant increase in the levels of the p53-associated epigenetic co-activators histone acetyltransferase p300 and CBP, which resulted in increased levels of acetylated histone H3 (AcH3) and acetylated histone H4 (AcH4) (Fig. 6, A and B). As expected, knockdown of p53 reduced the levels of p300, CBP, AcH3, and AcH4 (Fig. 7, A and B). Because slug, which is also called snai2, is a known target gene of p53 in blood cells and because Slug is involved in osteoblast maturation, we hypothesized that slug may be the primary target of p53 in pAVICs during warfarin-induced calcification. Western blotting analysis showed that slight up-regulation of p53 increased the nuclear protein level of Slug in warfarin-induced calcific pAVICs (Fig. 6, A and B). Both ChIP and luciferase assays showed that p53 was recruited to the slug promoter and activated slug transcription (Fig. 6, C and D). Down-regulation of p53 reduced recruitment of p53 to the slug promoter (Fig. 7C). To determine whether Slug is the main protein mediating warfarin-induced pAVIC calcification, we further down-regulated Slug expression by shRNA (Fig. 8A). Knockdown of Slug significantly inhibited warfarin-induced calcium deposition and osteogenic gene expression in pAVICs (Fig. 8, B–H). Further, co-transfection of Ad-p53 and Slug shRNA partially reversed the protective effect of the Slug knockdown in calcium deposition and osteogenic gene expression (Fig. 8, B–H). These data suggest that p53 promotes pAVIC calcification by regulating slug expression. Unlike the Ad-p53 promoting warfarin-induced pAVIC calcification, overexpression of Slug by a lentivirus vector did not enhanced the calcium deposition and ALP activity (Fig. 9, A–C). Further, co-transfection of Lv-slug and p53 shRNA reversed the protective effect of the p53 knockdown in calcium deposition (Fig. 9, A–C). Western blotting showed that overexpression of Slug along increased the protein level of its target gene Runx2, but not p-Smad1/5, and Slug overexpression reversed Runx2 and p-Smad1/5 inhibited by p53 knockdown (Fig. 9, D and E). These data suggest that Slug is essential but not sufficient to p53 mediated calcification in warfarin-treated pAVICs.
Figure 6.
Low-level overexpression of p53 promotes warfarin-induced epigenetic changes and Slug expression. A, nuclear protein levels of AcH3, AcH4, p300, CBP, CEBP-β, and Slug were assessed by Western blotting. B, relative protein levels were normalized to histone 3. C, recruitment of p53 to the slug promoter was assessed by ChIP assay with the indicated antibodies. D, transcriptional activation of slug by p53 was assessed with the luciferase assay. The data are shown as the means ± S.E. of triplicates and are representative of three independent experiments performed. *, p < 0.05; **, p < 0.01; ***, p < 0.001.
Figure 7.
Knockdown of p53 attenuates warfarin-induced epigenetic changes and Slug expression. A, nuclear protein levels of AcH3, AcH4, p300, CBP, CEBP-β, and Slug were assessed by Western blotting. B, relative protein levels were normalized to histone 3. C, recruitment of p53 to the slug promoter was assessed by ChIP assay with the indicated antibodies. The data are shown as the means ± S.E. of triplicates and are representative of three independent experiments performed. War, warfarin. *, p < 0.05; **, p < 0.01; ***, p < 0.001.
Figure 8.
Knockdown of Slug attenuates warfarin-induced pAVIC calcification and rescue by p53. A, the efficacy of shRNA for knockdown of Slug was assessed by Western blotting. Relative protein levels were normalized to GAPDH. B and C, calcium deposition was assessed by Alizarin Red staining and measured with the QuantiChromTM calcium assay kit. D, ALP activity was performed to assess the amount of osteoblastic differentiation and calcification. E–H, expression of Runx2 and Bmp2 were assessed by qPCR. Expression of Slug, p53, Runx2, p-Smad1/5, and p-Akt were assessed by Western blotting. Relative protein levels were normalized to GAPDH. The data are shown as the means ± S.E. of triplicates and are representative of three independent experiments performed. Ctrl, control; War, warfarin. *, p < 0.05; **, p < 0.01; ***, p < 0.001.
Figure 9.
Overexpression of Slug rescues calcification inhibited by p53 knockdown. A and B, calcium deposition was assessed by Alizarin Red staining and measured with the QuantiChromTM calcium assay kit. C, ALP activity was measured to assess the degree of osteoblastic differentiation and calcification. D and E, expression of Slug, p53, Runx2, and p-Smad1/5 were assessed by Western blotting. The relative protein levels were normalized to GAPDH. The data are shown as the means ± S.E. of triplicates and are representative of three independent experiments performed. Ctrl, control; War, warfarin. *, p < 0.05; **, p < 0.01; ***, p < 0.001.
Discussion
The major findings of this study are 1) p53 is expressed in human and porcine AVICs and is involved in the formation of human calcific aortic valves; 2) a slight increase in p53 expression promotes warfarin-induced pAVIC calcification, and a p53 knockdown attenuates warfarin-induced pAVIC calcification; and 3) p53 regulates pAVIC calcification by regulating slug transcription. Our study showed that p53/Slug signaling plays a novel role in AVIC calcification.
Our data showed that p53 is expressed in AVICs from non-diseased and diseased aortic valves. Our data also suggest that AVICs may be inert cells and that non-apoptotic p53 may stabilize AVICs but may also be involved in the pathogenesis of aortic valve calcification. It has been shown that robust p53 activation leads to cell cycle arrest and apoptosis. In addition to acute stresses, which induce robust p53 activation, organisms are often exposed to low-level stresses, including oxidative stress, endoplasmic reticulum stress, inflammation, and other constitutive stresses (20), which may result in induction of varied levels of p53 activity. The responses of AVICs to low levels of p53 activity had not yet been understood. We found that a slight increase in p53 promoted significant epigenetic changes and its downstream target gene p21 and promoted slug expression in pAVICs. Although our study suggests that p53 plays a role as a non-apoptotic transcriptional regulator during physiological and pathological processes, more investigations are required to confirm this role of p53.
In contrast to previous studies on the role of p53 in osteoblasts or vascular smooth muscle cells (2–4), our data showed that a slight increase of p53 promotes warfarin-induced AVIC calcification and expression of the osteogenic transcription factor Runx2 in pAVICs. A previous comparative study showed that p53 inhibits osteogenic, adipogenic, and smooth muscle differentiation of multiple mesenchymal cell types but is essential for skeletal muscle differentiation and osteogenic reprogramming of skeletal muscle-committed cells, which suggests that p53 exerts positive or negative effects depending on the cell type and the specific differentiation program (21). We found that p53 is expressed in both unstressed and stressed AVICs and can lead to a pro-calcification effect during calcific stress, which is distinct from the inhibitory role that p53 plays in osteogenic differentiation in other cell types. Runx2 is a key factor in osteoblast differentiation and ectopic calcification of vascular smooth muscle and AVICs (22–24). In this study, we found that p53 expression is positively associated with expression of Runx2 in pAVICs, which is distinct from the association of p53 and Runx2 in osteoblasts (25). Because p53 was not directly recruited by the Runx2 promoter (25), p53 must up-regulate Runx2 expression in AVICs during calcification via other mediator proteins or transcription factors.
Slug, also called Snail2, is a member of a super family of zinc-finger transcription factors that play a central role in the patterning of vertebrate embryos (26, 27). Slug has also been shown to have important roles in other processes, including protection of cells from p53-mediated apoptosis (28), regulation of osteoblast differentiation and maturation (29, 30), and neural crest development (31). In human osteoblasts and mesenchymal stem cells, Slug is recruited to the Runx2 promoter and up-regulates Runx2. Silencing of Slug has been shown to promote expression of the chondrogenic marker Sox9 (29, 32), which protects AVICs from calcification (33). We found that slug is transcriptionally regulated by p53 in pAVICs concomitant with increased Runx2 expression. We also found that a Slug knockdown reduced Runx2 expression and significantly inhibited p53-mediated osteogenic transdifferentiation and calcium deposition of pAVICs. Our data suggest that Slug is the main target gene of p53 transcriptional regulation and that increased p53/Slug signaling may play a vital role during warfarin-induced osteogenic transdifferentiation and calcification of pAVICs. Interestingly, we observed that overexpression of Slug rescued the reduction of calcification and Runx2 expression by p53 knockdown but not enhanced AVIC calcification. Overexpression of Slug alone did not increase AVIC calcification as well, because Runx2 is the key transcription factor during early osteoblastic differentiation stage and the degree of calcium deposition at the late stage is not determined by Runx2 (34, 35), which elucidates the knockdown of Slug and inhibits warfarin-induced pAVIC calcification and overexpression of Slug failed to increase pAVIC calcification. In the current study, we found that p53 not only promoted Slug transcription but also increased the levels of histone acetyltransferases p300 and CBP and resulted in increased histone H3 and H4 acetylation. These epigenetic changes have been reported to regulate the terminal differentiation of osteoblastic progenitor cells and calcification of pAVICs (17–19, 36). We suggest that p53 induced Slug expression initiates osteoblastic transdifferentiation at the early stage, and the epigenetic changes may contribute to the calcium deposition at the late stage of pAVIC calcification.
Interfering with gene function is a widely used strategy to decipher the role of a gene. However, different strategies, specifically knockdown via antisense and knockout via gene inactivation, often lead to different phenotypes (37), for example, different strategies for loss of p53 function has led to phenotypes that appear unrelated to silencing of the target gene (38). Activation of a compensatory p53 family member, p63, buffers against deleterious mutations in p53, which has not been observed after translational or transcriptional knockdown (39). Thus, researchers should be careful when selecting the interference approach used to study the effects of the transcription factor p53 during pathological processes. Genetically deleterious mutations in p53 may not reflect the true role of p53 during the pathological process of AVIC calcification.
Experimental procedures
Human aortic valve tissue samples
Calcific aortic valves were obtained from patients with rheumatic heart valve disease and chronic atrial fibrillation who received warfarin therapy before surgical valve replacement. Control aortic valves were obtained from patients who received heart transplants, and the valve leaflets were examined by gross examinations and by microscopic examinations of hematoxylin and eosin-stained cryosections to confirm the absence of calcification. This study was approved by the Ethics Committee of the First Affiliated Hospital of Nanjing Medical University.
Cell isolation and culture
pAVICs were isolated by collagenase digestion as described previously (40) and cultured in DMEM (Gibco) supplemented with 10% FBS (ScienCell), 1% penicillin-streptomycin, and 2 mm l-glutamine. Normal cells from passages 3–5 were used in further experiments. Cardiofibroblasts were isolated from newborn rats and cultured in DMEM (Gibco) supplemented with 10% FBS (ScienCell), 1% penicillin-streptomycin, and 2 mm l-glutamine. To exclude endothelial cell pollution, the purity of pAVICs was identified by immunostaining and flow cytometry analysis with anti-vimentine and anti-CD31 antibodies (Fig. S1).
Warfarin treatment in vitro
To induce calcification in vitro, cells were cultured in DMEM supplemented with 1% FBS, 1% penicillin-streptomycin, 1.6 mm Pi, and 10 μm warfarin (Sigma–Aldrich) as previously described (12).
Warfarin-induced mouse model
To establish a warfarin induced aortic valve calcification model, C57/Bl6 mice (male, 8 weeks old) were administered with subcutaneous injection of warfarin and vitamin K1. 2.5 mg of warfarin/10 g of body weight and 0.15 mg of vitamin K1/10 g was administered at 8 a.m. The second identical dose of vitamin K1 was administered at 8 p.m. with no accompanying warfarin. The control mice accepted the same administration with saline. This routine was maintained every day for 4 weeks. The animals were sacrificed by isoflurane, and selected tissues were removed and fixed in 4% paraformaldehyde or frozen at −80 °C for later studies. All protocols were approved by the intramural Committee on Ethic Conduct of Animal Studies.
Flow cytometry
pAVICs were seeded in 6-well culture plates at a density of 20,000 cells/well. Two days after seeding, the cells were transfected with adenoviral human p53 (Ad-p53) or adenoviral GFP (Ad-GFP). Forty-eight hours after transfection, the cells were treated with warfarin for 5 days and then centrifuged at 450 × g for 5 min at 4 °C. After washing cells with PBS twice, the cell pellet was resuspended in 100 μl of annexin V binding buffer. Then the cells were incubated with 5 μl of annexin V-FITC and 5 μl of propidium iodide (PI) for 15 min at room temperature in the dark before the addition of 400 μl of annexin V binding buffer. The cells were analyzed using a novocyte flow cytometer (ACEA Biosciences Inc.). Early apoptotic cells (annexin-FITC–positive and PI–negative) were located in the lower right quadrant, and late apoptotic or necrotic cells (Annexin-FITC–positive and PI-positive) were located in the upper right quadrant. Healthy cells (Annexin-FITC–negative and PI-negative) were located in the lower left quadrant. The data are presented as percentages of positively stained cells/total cells.
TUNEL assay
Frozen aortic valve sections were stained with a fluorescent TUNEL assay kit (Promega), then immunostained with vimentin antibody, and counterstaining for DAPI. Briefly, sections were fixed with 4% paraformaldehyde in PBS, washed with PBS, and incubated with the TUNEL reaction mixture. After TUNEL reaction, the sections were washed with PBS and then immunostained with vimentin antibody. After immunostaining with vimentin antibody and secondary antibody, the nuclei were then counterstained with DAPI. TUNEL–positive cells had a pyknotic nucleus with green fluorescent staining, which is indicative of apoptosis. Images were taken using a fluorescence microscope (Zeiss). The TUNEL–positive apoptotic cells and DAPI–positive cells were counted in a blinded manner (five different fields were counted in each case at 400 magnification). The rate of apoptotic cells was calculated as the percentage of apoptotic nuclei over total number of nuclei.
Immunofluorescence
Immunofluorescent staining was performed with frozen tissue sections. Prior to immunostaining, tissue sections were fixed with 4% paraformaldehyde for 10 min, washed with PBS, permeabilized for 10 min with 0.05% Triton X-100, and washed with PBS. Tissue sections were incubated with blocking solution (3% bovine serum albumin, 10% horse serum, and 0.2% Triton X-100) for 1 h at 22 °C, incubated at 4 °C overnight with primary antibodies, and then incubated with secondary antibodies conjugated to Alexa 488 or CyTM3 (Jackson) for 45 min. DAPI was used to counterstain the nuclei. The samples were covered with mounting medium (Invitrogen), overlaid with cover slips, and examined by confocal laser scanning microscopy (Zeiss).
Real-time PCR
RNA of pAVICs and human aortic valves was extracted with an RNeasy RNA isolation kit (Qiagen). Reverse transcriptase reactions were performed using a PrimeScriptTM RT reagent kit (Takara). For mouse aortic valve RNA extraction, the aortic valve leaflets were dissected from warfarin-treated and control mice under microscope and then were processed for RNA extraction and reverse transcription within 1 h using a SMARTer ultra low RNA kit (Clontech). cDNA was amplified using an Advantage 2 PCR kit (Clontech) according to the manufacturer's protocol. After cDNA amplification, the samples were used for PCR experiments. Real-time PCRs were performed on an ABI Prism 7900 system. TaqMan probes to detect p53, BMP2, and Runx2 were purchased from Roche. Each sample was analyzed in triplicate, and target genes were normalized to the reference housekeeping gene GAPDH. Fold differences were then calculated for each treatment group using normalized CT values.
Alizarin Red staining
Cultured cells were washed with Ca2+-free PBS three times, fixed in 95% ethanol for 30 min, and stained in 2% Alizarin Red solution (pH 4.2) for 1 min to visualize matrix calcium deposition. The remaining dye was removed with several washes of distilled water, and the stained cells were photographed. The valve sections are stained with the same approach.
Calcium quantitation
Cultured pAVICs were extracted with 0.6 m HCL overnight at 4 °C, and the calcium contents of these extracts were determined colorimetrically using the o-cresolphthalein complex one method and the QuantiChromTM calcium assay kit (BioAssay System). Briefly, 5-μl samples were transferred to a 96-well plate. Working reagent (200 μl) was added to each sample, and the absorbance at 570 nm was measured using a SynergyTM2 microplate reader from BioTek (Winooski). After decalcification, the cells were washed three times with PBS and solubilized with 0.1 m NaOH, 0.1% SDS. The protein content was measured with a BCA protein assay kit (Thermo Scientific Pierce). The calcium content was then normalized to the protein content.
Alkaline phosphatase activity assay
We used LabAssayTM ALP (Wako Chemicals) according to the manufacturer's recommendations to measure alkaline phosphatase (ALP) activity based on the quantity of p-nitrophenylphosphate released from the substrate. Cell layers were lysed with 200 μl of ice-cold 0.05% Triton X-100 in PBS, frozen, and thawed twice, and then the cell lysates were collected. Samples (20 μl) were combined with 100 μl of ALP reagent and incubated for 15 min at 37 °C, and then the absorbance at 405 nm was determined immediately. The amount of p-nitrophenylphosphate was calculated using a standard curve. ALP activity (U indicates μmol of p-nitrophenylphosphate released/min) was normalized to the protein content.
Adenovirus and lentivirus transfection
pAVICs were cultured in complete medium (DMEM supplemented with 10% fetal bovine serum and penicillin/streptomycin) at 37 °C in a 5% CO2 incubator. For adenovirus transfection, the cells were cultured to 60–70% confluency and then infected with recombinant adenovirus expressing human p53 or shRNAs targeting human p53 or Slug (Genechem, Shanghai, China) according to the manufacturer's instructions. Three concentrations of adenovirus p53 vector, 0.5 × 10⁷, 1 × 10⁷, and 2 × 10⁷ pfu/ml were used to induce low-level p53 overexpression. For lentivirus transfection, the cells were cultured to 60–70% confluency and then infected with recombinant lentivirus expressing human Slug (Genechem) according to manufacturer's instructions, and the infectious viral titer was 1 × 10⁸ transduction units/ml.
Transient plasmid transfection and luciferase activity assays
Our human snail family transcriptional repressor 2 promoter-luciferase reporter (SlugLUC) was purchased from Genechem. For plasmid transfection, HEK293T cells were seeded at 5,000 cells/well in 96-well culture plates. Transient transfections were performed with Lipofectamine® 3000 transfection reagent (Invitrogen). Luciferase activity was measured 24–48 h after transfection using a Bioteksynergy2 plate reader (Winooski). Firefly luciferase activity was normalized to the Renilla luciferase activity (firefly luciferase/Renilla luciferase) and presented as relative luciferase activity. The assays were performed in triplicate and repeated three independent times.
Western blotting
The proteins were extracted with M-PER or NE-PER nuclear and cytoplasmic Extraction reagents (Thermo) according to the manufacturer's protocol. Then cell lysates were separated by 10–15% SDS-PAGE and transferred onto a polyvinylidene difluoride membrane (Millipore). After blocking with a 5% fat-free milk solution, the protein of interest was detected with primary antibody and an HRP-linked secondary antibody (1:5000). The primary antibodies used were anti-pAktS308 (1:1000; Cell Signaling catalog no. 13038), anti-cleaved caspase-3 (1:1000; Cell Signaling catalog no. 2876), anti-p53 (1:1000; Cell Signaling catalog no. 2524), anti-Slug (1:1000; Cell Signaling catalog no. 9585), anti-P-Smad1/5 (1:1000; Cell Signaling catalog no. 9516), anti-Histone H3 (1:1000; Cell Signaling catalog no. 9717), anti-GAPDH (1:1000; Cell Signaling catalog no. 5174), anti-Bmp2 (1:1000; Abcam ab14933), anti-Runx2 (1:1000; Cell Signaling catalog no. 12556), anti-p21 (1:200; Santa Cruz catalog no. sc-6246), anti-CBP (1:200; Santa Cruz catalog no. sc-369), anti-p300 (1:200; Santa Cruz catalog no. sc-585), anti-C/EBPβ (1:200; Santa Cruz catalog no. sc-150); anti-acetyl histone H3 (1:1000; Millipore catalog no. 17–615), and anti-acetyl histone H4 (1:1000; Millipore catalog no. 06–598). The blots were developed with enhanced chemiluminescence reagent (Thermo) and scanned on a ChemiDoc MP imager (Bio-Rad). Image LabTM software was used to quantify band density.
Immunoprecipitation
pAVICs were washed in PBS twice and then lysed in 400 μl of buffer A (50 mm Tris-HCl, pH 7.4, 150 mm NaCl, 1 mm EDTA-Na, 1% Nonidet P-40, 0.02% sodium azide, 0.1% SDS, 0.5% sodium deoxycholate, 1% PMSF, 1‰ aprotinin, 1‰ leupeptin, and 0.5‰ pepstatin A). The lysates were centrifuged at 12,000 × g for 15 min at 4 °C. The supernatants were preincubated for 1 h at 4 °C with 0.025 ml of protein G-Sepharose beads (Sigma–Aldrich) and then centrifuged to remove proteins that adhered nonspecifically to the beads and obtain the target supernatant for following IP experiment. Protein G-Sepharose beads were incubated with antibodies for 3 h. The antibody-conjugated protein G-Sepharose beads and the target supernatant were added for incubation overnight. Immune complexes were isolated by centrifugation and washed four times with 0.05 m HEPES buffer, pH 7.1, containing 0.15% Triton X-100, 0.15 m NaCl, and 0.1 × 10⁻³ m sodium orthovanadate, and bound proteins were eluted by heating at 100 °C in loading buffer. Proteins were then analyzed by immunoblotting with indicative antibodies.
Chromatin immunoprecipitation
Chromatin was cross-linked with 1% formaldehyde. The cells were incubated in lysis buffer (150 mm NaCl, 25 mm Tris, pH 7.5, 1% Triton X-100, 0.1% SDS, 0.5% deoxycholate) supplemented with protease inhibitors. The DNA was fragmented into ∼500-bp pieces using a Bioruptor PICO sonicator (DIAGENODE). One aliquot of lysate containing 200 μg of protein was used for each immunoprecipitation reaction with anti-p53 (Millipore catalog no. 17-613) or preimmune IgG. Precipitated genomic DNA was amplified by real-time PCR with primers to the slug promoter: 5′-GGAGAACAGCCCATTTTGAA-3′ and 5′-TTTGCAAGAAGGGTCCAATC-3′.
Statistical analysis
All of the data were expressed as the means ± S.E. Treatment group values were compared with control values using GraphPad Prism 5.0 (GraphPad Software). The Student's t test was used to determine statistical differences between two groups. One-way analysis of variance followed by Bonferroni's multiple comparison test was used to compare four groups. Two-way analysis of variance followed by the Bonferroni test was used to compare p53 and Slug shRNA single and double transfection groups. p values < 0.05 were considered statistically significant.
Author contributions
W. S. and Y. S. designed the study and wrote the paper. L. G., Y. J., M. Q., and Y. W. performed and analyzed the experiments shown in Figs. 1–9. Y. S. performed and analyzed the experiments of quantitative PCR. Y. J. and Y. L. designed, performed, and analyzed the experiments of ChIP and luciferase assays. X. K. and Y. S. provided human samples and technical assistance and contributed to the preparation of the figures. All authors analyzed the results and approved the final version of the manuscript.
Supplementary Material
This work was supported by National Natural Science Foundation of China Grants 81570247, 81627802, and 81401121; Natural Science Foundation of Jiangsu Province for Youth Grant BK20141024; Jiangsu Province Six Talent Peaks Project Grant 2015-WSN-29; and funds from the Priority Academic Program Development of Jiangsu Higher Education Institutions. The authors declare that they have no conflicts of interest with the contents of this article.
This article contains Fig. S1.
- AVIC
- aortic valve interstitial cell
- pAVIC
- porcine aortic valve interstitial cell
- Ac
- acetylation
- ALP
- alkaline phosphatase
- shRNA
- short hairpin RNA
- AcH3
- acetylated histone H3
- AcH4
- acetylated histone H4
- TUNEL
- terminal deoxynucleotidyl transferase dUTP nick end labeling
- p-
- phosphorylated
- CBP
- CREB-binding protein
- CREB
- cAMP-responsive element-binding protein
- PI
- propidium iodide
- qPCR
- quantitative PCR
- pfu
- plaque-forming unit.
References
- 1. Prives C., and Hall P. A. (1999) The p53 pathway. J. Pathol. 187, 112–126 10.1002/(SICI)1096-9896(199901)187:1%3C112::AID-PATH250%3E3.0.CO%3B2-3 [DOI] [PubMed] [Google Scholar]
- 2. Lengner C. J., Steinman H. A., Gagnon J., Smith T. W., Henderson J. E., Kream B. E., Stein G. S., Lian J. B., and Jones S. N. (2006) Osteoblast differentiation and skeletal development are regulated by Mdm2-p53 signaling. J. Cell Biol. 172, 909–921 10.1083/jcb.200508130 [DOI] [PMC free article] [PubMed] [Google Scholar]
- 3. Wang X., Kua H. Y., Hu Y., Guo K., Zeng Q., Wu Q., Ng H. H., Karsenty G., de Crombrugghe B., Yeh J., and Li B. (2006) p53 functions as a negative regulator of osteoblastogenesis, osteoblast-dependent osteoclastogenesis, and bone remodeling. J. Cell Biol. 172, 115–125 10.1083/jcb.200507106 [DOI] [PMC free article] [PubMed] [Google Scholar]
- 4. Li K. L., Chen J., Li Z. H., Zhao L., and He Y. N. (2012) p53 negatively regulates the osteogenic differentiation of vascular smooth muscle cells in mice with chronic kidney disease. Cardiovasc. J. Afr. 23, e1–e9 10.5830/CVJA-2011-069 [DOI] [PMC free article] [PubMed] [Google Scholar]
- 5. Yao Y., Bennett B. J., Wang X., Rosenfeld M. E., Giachelli C., Lusis A. J., and Boström K. I. (2010) Inhibition of bone morphogenetic proteins protects against atherosclerosis and vascular calcification. Circ. Res. 107, 485–494 10.1161/CIRCRESAHA.110.219071 [DOI] [PMC free article] [PubMed] [Google Scholar]
- 6. Zebboudj A. F., Imura M., and Boström K. (2002) Matrix GLA protein, a regulatory protein for bone morphogenetic protein-2. J. Biol. Chem. 277, 4388–4394 10.1074/jbc.M109683200 [DOI] [PubMed] [Google Scholar]
- 7. Koos R., Mahnken A. H., Mühlenbruch G., Brandenburg V., Pflueger B., Wildberger J. E., and Kühl H. P. (2005) Relation of oral anticoagulation to cardiac valvular and coronary calcium assessed by multislice spiral computed tomography. Am. J. Cardiol. 96, 747–749 10.1016/j.amjcard.2005.05.014 [DOI] [PubMed] [Google Scholar]
- 8. Koos R., Krueger T., Westenfeld R., Kühl H. P., Brandenburg V., Mahnken A. H., Stanzel S., Vermeer C., Cranenburg E. C., Floege J., Kelm M., and Schurgers L. J. (2009) Relation of circulating matrix Gla-protein and anticoagulation status in patients with aortic valve calcification. Thromb. Haemost. 101, 706–713 [PubMed] [Google Scholar]
- 9. Holden R. M., Sanfilippo A. S., Hopman W. M., Zimmerman D., Garland J. S., and Morton A. R. (2007) Warfarin and aortic valve calcification in hemodialysis patients. J. Nephrol. 20, 417–422 [PubMed] [Google Scholar]
- 10. Hadji F., Boulanger M. C., Guay S. P., Gaudreault N., Amellah S., Mkannez G., Bouchareb R., Marchand J. T., Nsaibia M. J., Guauque-Olarte S., Pibarot P., Bouchard L., Bossé Y., and Mathieu P. (2016) Altered DNA methylation of long noncoding RNA H19 in calcific aortic valve disease promotes mineralization by silencing NOTCH1. Circulation 134, 1848–1862 10.1161/CIRCULATIONAHA.116.023116 [DOI] [PubMed] [Google Scholar]
- 11. Beazley K. E., Deasey S., Lima F., and Nurminskaya M. V. (2012) Transglutaminase 2-mediated activation of beta-catenin signaling has a critical role in warfarin-induced vascular calcification. Arterioscler. Thromb. Vasc. Biol. 32, 123–130 10.1161/ATVBAHA.111.237834 [DOI] [PMC free article] [PubMed] [Google Scholar]
- 12. Beazley K. E., Eghtesad S., and Nurminskaya M. V. (2013) Quercetin attenuates warfarin-induced vascular calcification in vitro independently from matrix Gla protein. J. Biol. Chem. 288, 2632–2640 10.1074/jbc.M112.368639 [DOI] [PMC free article] [PubMed] [Google Scholar]
- 13. Vogelstein B., Lane D., and Levine A. J. (2000) Surfing the p53 network. Nature 408, 307–310 10.1038/35042675 [DOI] [PubMed] [Google Scholar]
- 14. Stiewe T. (2007) The p53 family in differentiation and tumorigenesis. Nat. Rev. Cancer 7, 165–168 10.1038/nrc2072 [DOI] [PubMed] [Google Scholar]
- 15. Wang Q., Zou Y., Nowotschin S., Kim S. Y., Li Q. V., Soh C. L., Su J., Zhang C., Shu W., Xi Q., Huangfu D., Hadjantonakis A. K., and Massagué J. (2017) The p53 family coordinates Wnt and nodal inputs in mesendodermal differentiation of embryonic stem cells. Cell Stem Cell 20, 70–86 10.1016/j.stem.2016.10.002 [DOI] [PMC free article] [PubMed] [Google Scholar]
- 16. Price P. A., Faus S. A., and Williamson M. K. (1998) Warfarin causes rapid calcification of the elastic lamellae in rat arteries and heart valves. Arterioscler. Thromb. Vasc. Biol. 18, 1400–1407 10.1161/01.ATV.18.9.1400 [DOI] [PubMed] [Google Scholar]
- 17. Dudakovic A., Evans J. M., Li Y., Middha S., McGee-Lawrence M. E., van Wijnen A. J., and Westendorf J. J. (2013) Histone deacetylase inhibition promotes osteoblast maturation by altering the histone H4 epigenome and reduces Akt phosphorylation. J. Biol. Chem. 288, 28783–28791 10.1074/jbc.M113.489732 [DOI] [PMC free article] [PubMed] [Google Scholar]
- 18. Schroeder T. M., and Westendorf J. J. (2005) Histone deacetylase inhibitors promote osteoblast maturation. J. Bone Miner. Res. 20, 2254–2263 10.1359/JBMR.050813 [DOI] [PubMed] [Google Scholar]
- 19. Li S. J., Kao Y. H., Chung C. C., Chen W. Y., Cheng W. L., and Chen Y. J. (2017) Activated p300 acetyltransferase activity modulates aortic valvular calcification with osteogenic transdifferentiation and downregulation of Klotho. Int. J. Cardiol. 232, 271–279 10.1016/j.ijcard.2017.01.005 [DOI] [PubMed] [Google Scholar]
- 20. Vousden K. H., and Lane D. P. (2007) p53 in health and disease. Nat. Rev. Mol. Cell Biol. 8, 275–283 10.1038/nrm2147 [DOI] [PubMed] [Google Scholar]
- 21. Molchadsky A., Shats I., Goldfinger N., Pevsner-Fischer M., Olson M., Rinon A., Tzahor E., Lozano G., Zipori D., Sarig R., and Rotter V. (2008) p53 plays a role in mesenchymal differentiation programs, in a cell fate dependent manner. PLoS One 3, e3707 10.1371/journal.pone.0003707 [DOI] [PMC free article] [PubMed] [Google Scholar]
- 22. Sun Y., Byon C. H., Yuan K., Chen J., Mao X., Heath J. M., Javed A., Zhang K., Anderson P. G., and Chen Y. (2012) Smooth muscle cell-specific runx2 deficiency inhibits vascular calcification. Circ. Res. 111, 543–552 10.1161/CIRCRESAHA.112.267237 [DOI] [PMC free article] [PubMed] [Google Scholar]
- 23. Yang X., Meng X., Su X., Mauchley D. C., Ao L., Cleveland J. C. Jr, and Fullerton D. A. (2009) Bone morphogenic protein 2 induces Runx2 and osteopontin expression in human aortic valve interstitial cells: role of Smad1 and extracellular signal-regulated kinase 1/2. J. Thorac. Cardiovasc. Surg. 138, 1008–1015 10.1016/j.jtcvs.2009.06.024 [DOI] [PubMed] [Google Scholar]
- 24. Westendorf J. J., Zaidi S. K., Cascino J. E., Kahler R., van Wijnen A. J., Lian J. B., Yoshida M., Stein G. S., and Li X. (2002) Runx2 (Cbfa1, AML-3) interacts with histone deacetylase 6 and represses the p21(CIP1/WAF1) promoter. Mol. Cell Biol. 22, 7982–7992 10.1128/MCB.22.22.7982-7992.2002 [DOI] [PMC free article] [PubMed] [Google Scholar]
- 25. Liu H., and Li B. (2010) p53 control of bone remodeling. J. Cell Biochem. 111, 529–534 10.1002/jcb.22749 [DOI] [PubMed] [Google Scholar]
- 26. Nieto M. A. (2002) The snail superfamily of zinc-finger transcription factors. Nat. Rev. Mol. Cell Biol. 3, 155–166 10.1038/nrm757 [DOI] [PubMed] [Google Scholar]
- 27. De Craene B., van Roy F., and Berx G. (2005) Unraveling signalling cascades for the Snail family of transcription factors. Cell Signal. 17, 535–547 10.1016/j.cellsig.2004.10.011 [DOI] [PubMed] [Google Scholar]
- 28. Wu W. S., Heinrichs S., Xu D., Garrison S. P., Zambetti G. P., Adams J. M., and Look A. T. (2005) Slug antagonizes p53-mediated apoptosis of hematopoietic progenitors by repressing puma. Cell 123, 641–653 10.1016/j.cell.2005.09.029 [DOI] [PubMed] [Google Scholar]
- 29. Lambertini E., Lisignoli G., Torreggiani E., Manferdini C., Gabusi E., Franceschetti T., Penolazzi L., Gambari R., Facchini A., and Piva R. (2009) Slug gene expression supports human osteoblast maturation. Cell Mol. Life Sci. 66, 3641–3653 10.1007/s00018-009-0149-5 [DOI] [PMC free article] [PubMed] [Google Scholar]
- 30. Lambertini E., Franceschetti T., Torreggiani E., Penolazzi L., Pastore A., Pelucchi S., Gambari R., and Piva R. (2010) SLUG: a new target of lymphoid enhancer factor-1 in human osteoblasts. BMC Mol. Biol. 11, 13 10.1186/1471-2199-11-13 [DOI] [PMC free article] [PubMed] [Google Scholar]
- 31. Sakai D., Suzuki T., Osumi N., and Wakamatsu Y. (2006) Cooperative action of Sox9, Snail2 and PKA signaling in early neural crest development. Development 133, 1323–1333 10.1242/dev.02297 [DOI] [PubMed] [Google Scholar]
- 32. Torreggiani E., Lisignoli G., Manferdini C., Lambertini E., Penolazzi L., Vecchiatini R., Gabusi E., Chieco P., Facchini A., Gambari R., and Piva R. (2012) Role of Slug transcription factor in human mesenchymal stem cells. J. Cell Mol. Med. 16, 740–751 10.1111/j.1582-4934.2011.01352.x [DOI] [PMC free article] [PubMed] [Google Scholar]
- 33. Peacock J. D., Levay A. K., Gillaspie D. B., Tao G., and Lincoln J. (2010) Reduced sox9 function promotes heart valve calcification phenotypes in vivo. Circ. Res. 106, 712–719 10.1161/CIRCRESAHA.109.213702 [DOI] [PMC free article] [PubMed] [Google Scholar]
- 34. Komori T. (2003) Requisite roles of Runx2 and Cbfb in skeletal development. J. Bone Miner. Metab. 21, 193–197 [DOI] [PubMed] [Google Scholar]
- 35. Raaz U., Schellinger I. N., Chernogubova E., Warnecke C., Kayama Y., Penov K., Hennigs J. K., Salomons F., Eken S., Emrich F. C., Zheng W. H., Adam M., Jagger A., Nakagami F., Toh R., et al. (2015) Transcription factor Runx2 promotes aortic fibrosis and stiffness in type 2 diabetes mellitus. Circ. Res. 117, 513–524 10.1161/CIRCRESAHA.115.306341 [DOI] [PMC free article] [PubMed] [Google Scholar]
- 36. Azechi T., Kanehira D., Kobayashi T., Sudo R., Nishimura A., Sato F., and Wachi H. (2013) Trichostatin A, an HDAC class I/II inhibitor, promotes Pi-induced vascular calcification via up-regulation of the expression of alkaline phosphatase. J. Atheroscler. Thromb. 20, 538–547 10.5551/jat.15826 [DOI] [PubMed] [Google Scholar]
- 37. Rossi A., Kontarakis Z., Gerri C., Nolte H., Hölper S., Krüger M., and Stainier D. Y. (2015) Genetic compensation induced by deleterious mutations but not gene knockdowns. Nature 524, 230–233 10.1038/nature14580 [DOI] [PubMed] [Google Scholar]
- 38. Robu M. E., Larson J. D., Nasevicius A., Beiraghi S., Brenner C., Farber S. A., and Ekker S. C. (2007) p53 activation by knockdown technologies. PLoS Genet. 3, e78 10.1371/journal.pgen.0030078 [DOI] [PMC free article] [PubMed] [Google Scholar]
- 39. Suliman Y., Opitz O. G., Avadhani A., Burns T. C., El-Deiry W., Wong D. T., and Rustgi A. K. (2001) p63 expression is associated with p53 loss in oral-esophageal epithelia of p53-deficient mice. Cancer Res. 61, 6467–6473 [PubMed] [Google Scholar]
- 40. Taylor P. M., Allen S. P., and Yacoub M. H. (2000) Phenotypic and functional characterization of interstitial cells from human heart valves, pericardium and skin. J. Heart Valve Dis. 9, 150–158 [PubMed] [Google Scholar]
Associated Data
This section collects any data citations, data availability statements, or supplementary materials included in this article.


