

Abstract
Multidrug resistance (MDR) is a major obstacle in cancer treatment due to the ability of tumor cells to efflux chemotherapeutics via drug transporters (e.g. P-glycoprotein (Pgp; ABCB1)). Although the mechanism of Pgp-mediated drug efflux is known at the plasma membrane, the functional role of intracellular Pgp is unclear. Moreover, there has been intense focus on the tumor micro-environment as a target for cancer treatment. This investigation aimed to dissect the effects of tumor micro-environmental stress on subcellular Pgp expression, localization, and its role in MDR. These studies demonstrated that tumor micro-environment stressors (i.e. nutrient starvation, low glucose levels, reactive oxygen species, and hypoxia) induce Pgp-mediated drug resistance. This occurred by two mechanisms, where stressors induced 1) rapid Pgp internalization and redistribution via intracellular trafficking (within 1 h) and 2) hypoxia-inducible factor-1α expression after longer incubations (4–24 h), which up-regulated Pgp and was accompanied by lysosomal biogenesis. These two mechanisms increased lysosomal Pgp and facilitated lysosomal accumulation of the Pgp substrate, doxorubicin, resulting in resistance. This was consistent with lysosomal Pgp being capable of transporting substrates into lysosomes. Hence, tumor micro-environmental stressors result in: 1) Pgp redistribution to lysosomes; 2) increased Pgp expression; 3) lysosomal biogenesis; and 4) potentiation of Pgp substrate transport into lysosomes. In contrast to doxorubicin, when stress stimuli increased lysosomal accumulation of the cytotoxic Pgp substrate, di-2-pyridylketone 4,4-dimethyl-3-thiosemicarbazone (Dp44mT), this resulted in the agent overcoming resistance. Overall, this investigation describes a novel approach to overcoming resistance in the stressful tumor micro-environment.
Keywords: drug delivery, drug resistance, drug transport, lysosome, tumor micro-environment, ABCB1, P-glycoprotein, tumor micro-environmental stress
Introduction
Multidrug resistance (MDR)5 is a major therapeutic challenge in the fight against cancer (1–3). MDR leads to difficulty in treating tumors due to the ability of cancer cells to efflux chemotherapeutic drugs, primarily via overexpression of ATP-binding cassette transporters (ABC transporters) (3, 4). One such transporter is P-glycoprotein (Pgp; ABCB1), which protects cells by effluxing cytotoxic chemotherapeutics, such as doxorubicin (DOX; Fig. 1A (i)) (1–3).
Figure 1.

A and B, line drawings of the structures of DOX and Dp44mT and their different mechanisms of action in terms of their interaction with intracellular Pgp in lysosomes. C, Western blots demonstrating that hypoxia increases Pgp expression in “half-resistant” KBV1 cells. A (i), line drawing of doxorubicin; A (ii), schematic showing that DOX is effluxed out of cells by Pgp but can also be transported into endosomes and lysosomes by Pgp in these organelles (14). Storage of DOX in the lysosome contributes to drug resistance to this agent, as DOX is sequestered away from its molecular targets in the nucleus (i.e. lysosomal “safe house” effect) (14). B (i), line drawing of the structure of Dp44mT. B (ii), schematic demonstrating that Pgp facilitates Dp44mT transport out of cells and into endosomes/lysosomes (15–17, 19). However, Dp44mT overcomes Pgp-mediated drug resistance by forming copper complexes that potently generate ROS (15, 17, 18). Generation of ROS causes LMP and apoptosis that leads to the death of resistant cancer cells and, thus, overcomes resistance (15, 17, 18). C (i), the Pgp level in KBV1 (half-resistant) cells is less than that in KBV1 (fully resistant cells) under normoxia (i.e. 21% O2). C (ii), the Pgp level in KBV1 (half-resistant) cells is similar to that in KBV1 (fully resistant cells) when incubated for 24 h at 37 °C under hypoxia (i.e. 1% O2). Western blots in C (i) and C (ii) are from a typical experiment of three performed. Densitometry is mean ± S.D. (error bars) (n = 3). ***, p < 0.001 relative to half-resistant cells.
Previous studies have shown that Pgp expression is up-regulated in tumor cells through activation of the hypoxia-inducible factor-1α (HIF-1α) pathway (5–7). Moreover, it has been established that tumors typically overexpress HIF-1α (8). Hypoxia is typical of the tumor micro-environment (∼1% oxygen) (9, 10), which is markedly different from the environment of normal tissues, where average oxygen levels are ∼5% (10, 11). Apart from hypoxia, tumor cells are also exposed to stressors, including glucose and nutrient starvation, as well as increased reactive oxygen species (ROS) generation (12). The increased ROS production in the tumor micro-environment (12) is linked to drug resistance via its ability to increase Pgp expression (6, 13). Furthermore, apart from hypoxia, HIF-1α expression can also be increased by stress stimuli in the tumor micro-environment (8). Hence, the stress-inducing conditions of the tumor micro-environment may play a role in inducing drug resistance through up-regulation of Pgp, which could occur via the HIF-1α pathway (5–7).
It has been well established that plasma membrane Pgp is responsible for the efflux of drugs, such as DOX (14) (Fig. 1A (ii)). However, recently, our laboratory has established that Pgp is also endocytosed from the plasma membrane into the cell (14–16). Additionally, Pgp has been identified in the lysosomal membrane, where it is functional in terms of transporting Pgp substrates (e.g. DOX) into the lysosomal lumen (Fig. 1A (ii)) (14–16). In fact, intracellular Pgp was demonstrated by several techniques to associate with the lysosome, but not the mitochondrion or nucleus (14). As part of endocytosis, the Pgp-containing plasma membrane buds inward to form an early endosome, which then “matures” to form a lysosome. This process results in the transport of Pgp substrates, such as DOX, into the lysosome (Fig. 1A (ii)) (14).
During endocytosis, the catalytic active-site and ATP-binding domain of Pgp are still exposed to the cytosol and enable Pgp to “pump” substrates from the cytosol into lysosomes (14). Hence, when a Pgp substrate, such as DOX, enters the cell, the drug is not only effluxed out by Pgp on the plasma membrane, but is also sequestered within acidic lysosomes by lysosomal Pgp (3) (Fig. 1A (ii)). If the Pgp substrate is charged at acidic pH (as occurs with DOX), lysosomal trapping results (14). This effect prevents drugs from reaching their molecular targets (e.g. the nucleus in the case of DOX), leading to increased resistance to the agent (i.e. lysosomal “safe house” effect; Fig. 1A (ii)) (14).
Recently, a new therapeutic strategy has been developed that implements novel di-2-pyridylketone thiosemicarbazone analog (e.g. di-2-pyridylketone 4,4-dimethyl-3-thiosemicarbazone (Dp44mT); Fig. 1B (i)) to overcome drug resistance by directly using intracellular Pgp in lysosomes against tumor cells (Fig. 1B (ii)) (15–17). In fact, like DOX (Fig. 1A (ii)), Dp44mT is a Pgp substrate and is effluxed out of cells but also transported into lysosomes by utilizing Pgp on the lysosomal membrane to increase damage to this organelle (Fig. 1B (ii)) (15–17).
Within lysosomes, Dp44mT becomes trapped due to its protonation at the acidic pH of this vesicle (18). Furthermore, Dp44mT binds intralysosomal copper (probably released from proteins via autophagy) and redox-cycles to produce reactive oxygen species (18). This generation of ROS induces lysosomal membrane permeabilization (LMP) and apoptotic cell death, which effectively overcomes resistance (Fig. 1B (ii)) (15–17, 19). The ability of Dp44mT to “hijack” Pgp and markedly overcome resistance to standard chemotherapies (e.g. DOX) is an important therapeutic advantage, as MDR is a major impediment to successful cancer treatment. Recently, a Dp44mT analog that has the same mechanism of action has entered multicenter clinical trials for advanced and resistant tumors (16, 17, 19–24). Hence, Dp44mT's mechanism of action in terms of overcoming Pgp-mediated resistance is important to elucidate.
The present investigation dissected the effects of stress stimuli in the tumor micro-environment on subcellular Pgp expression and localization and its role in Pgp-mediated drug resistance. Considering this, for the first time, we demonstrate that well-known tumor stress stimuli, namely hypoxia, nutrient starvation, and ROS (12, 25, 26), rapidly (within 1 h) induce Pgp redistribution into lysosomes. This effect results in lysosomal sequestration of chemotherapeutics that are Pgp substrates. Additionally, longer incubations (over 4–24 h) with these stressors resulted in a second mechanism that led to increased Pgp expression via a HIF-1α–dependent process and also lysosomal biogenesis. These two mechanisms lead to Pgp-mediated resistance that can be uniquely targeted by therapeutic exploitation using specially designed thiosemicarbazones, such as Dp44mT, that target lysosomal Pgp.
Results
Micro-environmental tumor stressors play a role in the expression of drug transporter, Pgp
Our studies initially assessed: 1) the effect of micro-environmental stressors on Pgp expression and 2) the effect of these stressors on HIF-1α, a stress-activated transcription factor involved in Pgp expression (5–7). Classical tumor micro-environmental stressors assessed included hypoxia (1% O2), glucose starvation (0 μm; (−) glucose), serum starvation ((−) serum), and H2O2 stress (100 μm; (+) H2O2) (12, 25, 26).
In these investigations, our first experiments assessed parental KB31 cells, which express very low Pgp levels relative to KBV1 (+Pgp) cells that highly express Pgp (6, 14). Notably, for all studies herein, KBV1 (+Pgp) cells were grown in medium supplemented with low levels of vinblastine (VBL; 0.5 μg/ml) for maintenance of a partial MDR phenotype (i.e. “half-resistant” KBV1 (+Pgp) cells) (Fig. 1C (i)). This “half-resistant” cell model was specifically utilized throughout our experiments, instead of the “fully resistant” KBV1 (cells grown in VBL at 1 μg/ml (14, 15, 17)), to enable increased Pgp expression upon exposure to stress stimuli. As shown in Fig. 1C (ii), upon exposure to hypoxia (1% O2) for 24 h at 37 °C, Pgp expression in half-resistant KBV1 cells increased to a level similar to that in cells that were fully resistant. Of note, the two closely migrating Pgp bands observed in the Western blots correspond with the immature (140 kDa) and the mature glycosylated form (170 kDa) of Pgp (27). These two forms were only clearly observed in KBV1 cells and not other cell types.
Studies then examined changes in Pgp and HIF-1α expression by Western blotting after cells were incubated with control medium or with this medium under glucose starvation ((−) glucose), serum starvation ((−) serum), or H2O2 stress (100 μm; (+) H2O2) in the presence of normoxia (Fig. 2A) or hypoxia (Fig. 2B).
Figure 2.

The micro-environmental stressors, glucose starvation, serum starvation, and H2O2 stress, increase Pgp and/or HIF-1α expression in KB31 (very low Pgp) cells or Pgp-expressing KBV1 cells under normoxia or hypoxia. KB31 (very low Pgp) (A, i) and KBV1 (+Pgp) (A, ii) cells were incubated with the conditions of glucose starvation (0 μm), serum starvation (no FCS), or H2O2 stress (100 μm) under normoxia or hypoxia (B) for 0, 4, 8, and 24 h at 37 °C. Total protein was then isolated, and the expression of Pgp and HIF-1α was assessed by Western blot analysis. The Western blots are typical of three independent experiments, with the densitometric analysis representing mean ± S.D. (error bars) (n = 3). *, p < 0.05; **, p < 0.01; ***, p < 0.001, relative to the respective 0-h time point.
As observed previously (6, 14), during normoxia, negligible levels of Pgp were observed in KB31 (very low Pgp) cells (Fig. 2A (i)). Interestingly, Pgp was not increased in response to glucose starvation, serum starvation, or H2O2 stress, despite the slight but significant (p < 0.05) increase in HIF-1α expression over time (4, 8, and 24 h) following exposure to these stressors, compared with their respective 0 h controls (Fig. 2A (i)).
As expected, the expression of Pgp was markedly greater in KBV1 (+Pgp) cells (Fig. 2A (ii)) than parental KB31 (very low Pgp) cells (Fig. 2A (i)), as demonstrated previously (6, 14, 24). Also, in contrast to KB31 (very low Pgp) cells (Fig. 2A (i)), stressors induced a significant (p < 0.001–0.01) increase in Pgp levels under normoxia, which peaked after 8 h, in KBV1 (+Pgp) cells (Fig. 2A (ii)). The HIF-1α expression pattern in KBV1 (+Pgp) cells (Fig. 2A (ii)) was similar to that in KB31 (−Pgp) cells (Fig. 2A (i)), in which HIF-1α expression was slightly, but significantly (p < 0.01–0.05), up-regulated over time with all stressors in KBV1 cells (Fig. 2A (ii)).
To further mimic the tumor micro-environment, the stressors, namely glucose starvation, serum starvation, or H2O2 stress, were imposed on KB31 (very low Pgp) or KBV1 (+Pgp) cells under hypoxia (i.e. 1% O2; Fig. 2B (i) and (ii)) Indeed, hypoxia in tumors can be the result of the abnormally fast metabolism of cancer cells and the poor vascularization of solid tumors (11, 28). In these studies, glucose starvation, serum starvation, or H2O2 stress, in combination with hypoxia, increased or significantly (p < 0.001–0.05) increased Pgp expression in KB31 (Fig. 2B (i)) and KBV1 (+Pgp; Fig. 2B (ii)) cells at 4, 8, and 24 h compared with their 0 h controls. The only exception to this was for KBV1 cells under H2O2 stress, where a significant (p < 0.001–0.01) increase in Pgp expression was observed after 4 and 8 h, but not 24 h (Fig. 2B (ii)).
Examining HIF-1α expression, hypoxia induced a significant (p < 0.001–0.01) time-dependent increase in HIF-1α levels under control conditions in both KB31 (very low Pgp; Fig. 2B (i)) and KBV1 (+Pgp; Fig. 2B (ii)) cells. Moreover, incubation of KB31 (Fig. 2B (i)) or KBV1 (+Pgp; Fig. 2B (ii)) cells with stressors under hypoxia generally potentiated this effect, leading to a significant (p < 0.001–0.01) increase in HIF-1α levels over time. Overall, these results in Fig. 2 demonstrate a positive relationship between tumor stress-induced HIF-1α and Pgp expression.
Micro-environmental stressors up-regulate Pgp and HIF-1α expression in a variety of tumor cell types endogenously expressing Pgp
To further assess the effects of micro-environmental tumor stressors on endogenously Pgp-expressing cells, we tested a variety of cancer cell types, including DMS-53 lung carcinoma, DU-145 prostate carcinoma, MDA-MB-231 breast carcinoma, PANC-1 pancreatic carcinoma, and PC3 prostate carcinoma cell lines (Fig. 3, A and B). Based on the studies above using KB31 and KBV1 cells (Fig. 2), where an 8-h incubation showed a marked response to stressors, this time point was chosen to investigate the effects of stressors on tumor cell types endogenously expressing Pgp under normoxia and hypoxia (Fig. 3, A and B).
Figure 3.

The micro-environmental stressors, glucose starvation, serum starvation, and H2O2 stress, increase Pgp and HIF-1α expression in endogenously Pgp-expressing tumor cells under normoxia and hypoxia. DMS-53, DU-145, MDA-MB-231, PANC-1, and PC3 cells were incubated under control conditions (0 or 8 h at 37 °C) or with glucose starvation (0 μm), serum starvation (no FCS), or H2O2 stress (100 μm) under normoxia (A) or hypoxia (B) for 8 h at 37 °C. Total proteins were then isolated, and the expression of Pgp and HIF-1α was assessed by Western blotting analysis. The Western blots are typical of three independent experiments, with the densitometric analysis representing mean ± S.D. (error bars) (n = 3). *, p < 0.05; **, p < 0.01; ***, p < 0.001, relative to respective 0-h control.
As reported previously (29), DMS-53 cells endogenously express Pgp under normoxic conditions. Further, these cells showed a significant (p < 0.01–0.05) up-regulation of Pgp after 8 h under glucose starvation, serum starvation, or H2O2 stress compared with the 0- and 8-h controls (Fig. 3A). Moreover, HIF-1α expression in DMS-53 cells was also significantly (p < 0.01) up-regulated with all stressors, compared with the 0- and 8-h controls (Fig. 3A). Similarly, DU-145, MDA-MB-231, PANC-1, and PC3 cells also all exhibited a significant (p < 0.001–0.01) up-regulation of Pgp and HIF-1α after an 8-h incubation under these stressors compared with the controls (0 and 8 h; Fig. 3A).
Incubation of DMS-53 cells under hypoxia for 8 h (i.e. 8-h control) led to a marked and significant (p < 0.01–0.05) up-regulation of Pgp and HIF-1α expression compared with the control (0 h; Fig. 3B). Notably, no further increase in Pgp or HIF-1α expression in DMS-53 cells was observed when hypoxia was combined with additional stressors compared with the 8-h control under hypoxia alone (Fig. 3B).
Under hypoxia, DU-145, MDA-MB-231, PANC-1, and PC3 cells all demonstrated a significant (p < 0.001–0.05) up-regulation of Pgp and HIF-1α under control hypoxia at 8 h relative to 0 h (Fig. 3B). The combination of hypoxia with stressors (8 h) resulted in a similar or even greater increase in Pgp or HIF-1α expression compared with hypoxia alone (Fig. 3B). In general, the increase in both Pgp and HIF-1α expression relative to the respective control was greater under all conditions in the presence of hypoxia relative to normoxia (cf. Fig. 3, A and B). In summary, the results in Fig. 3 (A and B) demonstrate that micro-environmental stressors induce Pgp and HIF-1α expression similarly across multiple endogenous Pgp-expressing tumor cell types.
Micro-environmental stressors up-regulate Pgp via the HIF-1α pathway
Our studies above suggested that tumor micro-environmental stressors induced Pgp expression potentially via a HIF-1α–dependent pathway (Figs. 2 and 3). Moreover, the effect was more pronounced under hypoxia. This would agree with previous studies suggesting the role of HIF-1α in Pgp expression (5–7). Considering this, to directly examine the role of HIF-1α in Pgp up-regulation after exposure to micro-environmental stressors, HIF-1α was silenced using siHIF-1α relative to the non-targeting control (siNC) in KBV1 (+Pgp) cells (Fig. 4). Following incubation of cells with siNC or siHIF-1α for 48 h, a range of stressors was implemented under hypoxia for 8 h relative to the 0-h control, as described above (see Fig. 3).
Figure 4.

Micro-environmental stressors up-regulate Pgp via a HIF-1α–mediated pathway. HIF-1α was silenced using siHIF-1α relative to the non-targeting control siNC in KBV1 (+Pgp), and these cells were then further incubated under control conditions (0 or 8 h) or with the micro-environmental stressors, glucose starvation (0 μm), serum starvation (no FCS), and H2O2 stress (100 μm), under hypoxia for 8 h at 37 °C. Total proteins were then isolated, and Pgp and HIF-1α expression was assessed by Western blot analysis. Western blots are typical of three independent experiments, with the densitometric analysis representing mean ± S.D. (error bars) (n = 3). *, p < 0.05; **, p < 0.01; ***, p < 0.001, relative to respective 0 h control. #, p < 0.05; ###, p < 0.001, relative to its respective siNC condition.
Hypoxia led to a marked and significant (p < 0.001–0.05) up-regulation of both Pgp and HIF-1α expression in siNC-treated cells after an 8-h incubation in the presence or absence of stressors relative to the 0-h control (Fig. 4). In contrast to cells incubated with the siNC, HIF-1α was undetectable in siHIF-1α–treated cells for all conditions under hypoxia (Fig. 4). In agreement with the lack of HIF-1α expression in siHIF-1α–treated cells, Pgp expression was markedly down-regulated relative to siNC in the 8-h control and after serum starvation and H2O2 stress (Fig. 4). These data indicate that HIF-1α silencing decreased Pgp expression. Notably, under glucose starvation in siHIF-1α–treated cells, both Pgp and β-actin levels were barely detectable (Fig. 4), despite equivalent protein loads being applied. However, under the combined conditions of hypoxia and glucose starvation in siHIF-1α–treated cells, a high degree of necrotic cell death was observed (data not shown). Given that necrosis is characterized by extensive proteolysis (30, 31), this would explain the low Pgp and β-actin levels under this condition.
Overall, these studies in Fig. 4 indicate that a high degree of stress-mediated Pgp expression was dependent on HIF-1α. Indeed, HIF1-α may transcriptionally induce Pgp expression via the functional hypoxia-responsive element within the promoter region of the PGP gene (5, 32).
Tumor micro-environmental stressors lead to increased Pgp redistribution to lysosomes
Up-regulation of Pgp through the HIF-1α pathway in response to stress has been linked to bolstering the ability of tumor cells to survive chemotherapy (34). Furthermore, stressors in the tumor micro-environment have also been implicated in triggering endocytosis as a cell survival mechanism (35), which occurs through an HIF-1α–associated pathway (36). This endocytic process may allow redistribution of Pgp into endosomes and lysosomes (14, 16).
To investigate how tumor micro-environmental stressors affect Pgp expression as well as subcellular trafficking and localization of Pgp, Western analysis and confocal microscopy were implemented using KBV1 (+Pgp) cells (Fig. 5). These procedures assessed Pgp levels and also its co-localization with a well-characterized lysosome-specific marker, namely lysosome-associated membrane protein 2 (LAMP2) (37), and the nuclear marker, 4′,6-diamidino-2-phenylindole (DAPI) (38). Notably, a short incubation time (1 h) with the different stressors (i.e. (−) glucose), (−) serum, or (+) H2O2) was initially chosen to avoid an increase in Pgp expression. This allowed assessment of subcellular trafficking and redistribution of Pgp, rather than overall Pgp up-regulation. In fact, using these conditions, Western analysis demonstrated no significant (p > 0.05) change in Pgp or LAMP2 expression with all stressors after a 1-h incubation under normoxia (Fig. 5A).
Figure 5.


Short-term micro-environmental stressors increase Pgp distribution to lysosomes under normoxia and hypoxia. KBV1 (+Pgp) cells were incubated under control conditions (0 and 1 h at 37 °C) or for 1 h at 37 °C with the micro-environmental stressors, namely glucose starvation (0 μm), serum starvation (no FCS), or H2O2 stress (100 μm) under normoxia (A–C) or hypoxia (D–F). A and D, Western blot analysis of Pgp and LAMP2 expression in KBV1 (+Pgp) cells after a 0- or 1-h incubation with control medium or the stressors under normoxia or hypoxia. Blots are from typical experiments with densitometry representing mean ± S.D. (error bars) (n = 3). B and E, cells were examined using confocal immunofluorescence microscopy, and Pgp co-localization was observed with well-characterized organelle-specific antibodies, namely anti-LAMP2 for lysosomes. Nuclei were stained with DAPI. These images are typical of three independent experiments with data analysis in C and F presented as arbitrary units (a.u.) and are the mean ± S.D. (n = 3). *, p < 0.05; ***, p < 0.001, relative to respective 0-h control. Scale bar, 10 μm; scale bar (Magnified), 5 μm; scale bar (Close-up), 2.5 μm.
Using confocal microscopy, Pgp expression (green) was observed in control KBV1 (+Pgp) cells under normoxia (Fig. 5B (i)). Under control normoxia, basal levels of LAMP2-stained lysosomes (visible as cytoplasmic red puncta) and Pgp (seen predominantly as green staining on the plasma membrane) were evident (Fig. 5B (i) and (ii)) The co-localization of the red and green signals in the merge (yellow) was similar comparing the 0-h time point (Fig. 5, B (i) and C) and after a 1-h incubation (Fig. 5, B (ii) and C). Analysis of these images using ImageJ resulted in Mander's overlap coefficients (39) of 0.68 and 0.67 at 0 and 1 h, respectively (Fig. 5B (i) and (ii)). Under these conditions, there is a LAMP2-staining pattern in close proximity to the plasma membrane resulting in some co-localization with Pgp. This overlap is expected, as based on our model (Fig. 1, A and B), the process of Pgp internalization via endocytosis occurs continuously with lysosomal co-localization occurring at a steady-state level. Hence, the 0- or 1-h incubation provides a “snapshot” of the basal, steady-state level of Pgp internalization and its co-localization with the LAMP2 lysosomal marker (Fig. 5B (i) and (ii)). However, after incubation of KBV1 cells with each stressor for 1 h (i.e. (−) glucose, (−) serum, or (+) H2O2), a pronounced and significant (p < 0.001) increase in Pgp co-localization with the lysosomal marker, LAMP2, was observed as a yellow punctate lysosomal pattern in the merge (Fig. 5, B ((iii)–(v)) and C) compared with the relevant 1-h control (Fig. 5, B (ii) and C). Analysis of the images in Fig. 5B ((iii)–(v)) using ImageJ resulted in an increase in Mander's overlap coefficients (39) to 0.94, 0.96, and 0.93 for glucose starvation, serum starvation, and H2O2 stress, respectively (Fig. 5B (iii)–(v)). Collectively, these observations indicate that Pgp is redistributed to co-localize intracellularly with LAMP2-containing lysosomes after a short exposure (1 h) to stress stimuli.
The effect of glucose starvation, serum starvation, or H2O2 stress was also investigated in KBV1 (+Pgp) cells under hypoxia (1 h) using Western blotting and confocal microscopy (Fig. 5, D–F). Under hypoxia, Western blotting demonstrated no significant (p > 0.05) increase in Pgp or LAMP2 expression after a 1-h exposure to hypoxia and stressors relative to the 0-h control (Fig. 5D). Confocal microscopy showed that in KBV1 (+Pgp) cells, Pgp was poorly co-localized with LAMP2 (Mander's overlap coefficient = 0.50) at the 0-h control time point, where the cells had not been exposed to hypoxia (Fig. 5, E (i) and F). However, subjecting cells to hypoxia for 1 h (Fig. 5, E (ii) and F) led to a significant (p < 0.05) increase in Pgp co-localization with LAMP2 (forming a yellow punctate lysosomal pattern in the merge) compared with the 0-h control condition (Fig. 5, E (i) and F). Analysis of these images using ImageJ resulted in Mander's overlap coefficients of 0.50 and 0.81 at 0 and 1 h, respectively (Fig. 5E (i) and (ii)). This increase in overlap during hypoxia suggested Pgp redistribution to the lysosomal compartment (Fig. 5E (i) and (ii)).
Similarly, exposing KBV1 (+Pgp) cells to tumor micro-environmental stressors and hypoxia for 1 h produced a more intense pattern of co-localization of LAMP2 and Pgp in the merge (Fig. 5, E ((iii)–(v)) and F). This effect was similar to that observed using the same stressors under normoxia (Fig. 5B (iii)–(v)). Indeed, following the incubation with all stressors for 1 h, there was a pronounced and significant (p < 0.001) increase in Pgp co-localization with the LAMP2 lysosomal marker in the merge (Fig. 5, E ((iii)–(v)) and F) compared with the relevant 1-h control (Fig. 5, E (ii) and F). These results in Fig. 5 (B, C, E, and F) demonstrate that Pgp-expressing cells respond rapidly (within 1 h) to stressors increasing Pgp co-localization with lysosomes under normoxia and hypoxia.
Two mechanisms for increasing intracellular Pgp levels and co-localization with the lysosomal marker, LAMP2
From the studies above, two potential mechanisms of regulating Pgp in cellular resistance can be hypothesized: 1) rapid Pgp redistribution via intracellular trafficking after short incubations with stressors (1 h; Fig. 5) and 2) increased Pgp expression over longer incubation times with stressors (4–24 h; Figs. 2–4). However, it is unknown whether longer incubations with micro-environmental stressors lead to prolonged intracellular redistribution of Pgp into lysosomes or whether this effect represents a transient short-term response, as observed after 1 h (Fig. 5). To assess this, KBV1 (+Pgp) cells were incubated for 0, 4, 8, and 24 h in the presence of normoxia, and the effect on the expression and co-localization of Pgp and LAMP2 was assessed using Western analysis (Fig. 6A) and confocal microscopy (Fig. 6, B and C), respectively.
Figure 6.


Long-term hypoxic stress increases both Pgp expression and Pgp distribution to lysosomes under normoxia and hypoxia. KBV1 (+Pgp) cells were incubated under normoxia (A–C) or hypoxia (D–E) for 0, 4, 8, or 24 h at 37 °C. Cells were then examined using Western blotting (A and D) and confocal immunofluorescence microscopy (B and E), with Pgp co-localization being visualized with the anti-LAMP2 antibody for lysosomes. Nuclei were stained with DAPI. Images are typical of three independent experiments with data analysis in C and F presented as arbitrary units (a.u.) and are the mean ± S.D. (error bars) (n = 3). **, p < 0.01; ***, p < 0.001, relative to the respective 0-h control. Scale bar, 10 μm; scale bar (Magnified), 5 μm; scale bar (Close-up), 2.5 μm.
Western blot analysis (Fig. 6A) and confocal microscopy (Fig. 6B) demonstrated no significant (p > 0.05) alteration in LAMP2 or Pgp levels over 0–24 h under normoxia; nor was there any significant alteration in Pgp or LAMP2 co-localization in the merge (Fig. 6, B ((i)–(iv)) and C). These studies were consistent with those in Fig. 5B ((i) and (ii)) under control normoxic conditions in the absence of stressors. In contrast, under hypoxia, Western blotting demonstrated a significant (p < 0.001–0.01) increase in Pgp expression from 8 to 24 h and a significant (p < 0.001) increase in LAMP2 levels after a 4–24-h incubation (Fig. 6D). Furthermore, confocal microscopy demonstrated that hypoxia induced a significant (p < 0.001) increase in LAMP2 from 4 to 24 h and Pgp levels from 8 to 24 h and significantly (p < 0.001) increased their co-localization at 4, 8, and 24 h relative to the 0-h control (Fig. 6, E ((i)–(iv)) and F). The increase in LAMP2 was consistent with lysosomal biogenesis after exposure to stressors and was also confirmed using another lysosomal marker, cathepsin D (16, 35) (Fig. S1).
In summary, in addition to the redistribution of Pgp observed after a short incubation of 1 h under various stressors (Fig. 5, B, C, E, and F), prolonged exposure of cells to the micro-environmental stressor, hypoxia, results in increased Pgp and LAMP2 expression and their co-localization after 4–24 h of incubation (Fig. 6, E ((i)–(iv)) and F).
Stressors increase internalization of Pgp from the plasma membrane into cathepsin-stained lysosomes
To further dissect the mechanism of the increased intracellular Pgp levels after incubation with micro-environmental stressors, studies assessed Pgp internalization from the plasma membrane to intracellular compartments. This was achieved using pulse-chase analysis and combining data obtained from examining 125I-labeled anti-Pgp antibody (Ab) internalization and immunofluorescence examining co-localization of anti-Pgp Ab and a well-characterized lysosomal marker, cathepsin D (Fig. 7A).
Figure 7.

Stressors increase internalization of Pgp from the plasma membrane to the cathepsin D–defined lysosomal compartment. KBV1 (+Pgp) cells were incubated under normoxia, and internalization of Pgp was assessed using pulse-chase analysis via immunofluorescence examining co-localization of anti-Pgp Ab and a well-characterized lysosomal marker, cathepsin D. A, plates were first cooled to 4 °C on ice, and the anti-Pgp Ab was added and incubated for 1 h at 4 °C on ice, washed, fixed, and permeabilized. For the 1 h at 37 °C control or stress conditions, the 4 °C plates were washed, and prewarmed medium was added containing the stressors and incubated for 1 h at 37 °C. Cells were then washed, fixed, etc., as above. Cells were then blocked and incubated with anti-cathepsin D Ab. B, plot profile analyses at 4 °C control (i), 37 °C control (ii); 37 °C (−) glucose (iii); 37 °C (−) serum (iv), and 37 °C (+) H2O2 (v). C, analysis of masking the cathepsin D channel to calculate Pgp inside and outside the cathepsin D–defined lysosome region using ImageJ. The images in A are typical of three independent experiments. ***, p < 0.001, relative to the respective 37 °C control. Scale bar, 10 μm. Densitometry is mean ± S.E. (error bars) (n = 3).
In initial studies to validate the pulse-chase experiments and the role of temperature-dependent endocytosis (40) in Pgp internalization from the plasma membrane, the uptake of 125I-labeled anti-Pgp Ab was examined using KBV1 (+Pgp) cells. The plates were first cooled on ice to limit endocytosis (40), and 125I-labeled Ab was added for 1 h at 4 °C to label cell-surface Pgp. These plates were then washed on ice and incubated with the protease, Pronase (1 mg/ml at 4 °C) to examine membrane-bound (Pronase-sensitive) and internalized 125I-anti-Pgp Ab (Pronase-resistant (40–42)). To determine whether Pgp is internalized at 37 °C, the 125I-Ab–labeled plates at 4 °C were washed, and then prewarmed medium was added, and the cells were incubated for 1 h at 37 °C. Cells were then treated with Pronase to separate the internalized compartment. These studies demonstrated that for the 4 °C control, most 125I-labeled anti-Pgp Ab remained on the cell membrane, with little internalization, whereas at 37 °C, a 2–3-fold increase in 125I-Ab internalization was observed (Fig. S2). Whereas these observations with the 125I-Ab demonstrate increased internalization of Pgp, they do not provide evidence of co-localization of Pgp specifically to lysosomes.
Hence, a similar pulse-chase protocol under the same conditions then assessed co-localization of Pgp from the membrane to the cathepsin D–defined lysosomal compartment (Fig. 7A). As found for the 125I-labeled anti-Pgp Ab-binding studies, for the 4 °C control, most Pgp remained on the plasma membrane with limited internalization and co-localization (Fig. 7A). This latter observation is probably due to the limitation of endocytosis at this temperature (40). Notably, co-localization did not significantly (p > 0.05) increase under the 37 °C control condition compared with its control condition at 4 °C. However, Pgp co-localization with cathepsin D was markedly and significantly (p < 0.001) stimulated by incubation with the stressors at 37 °C compared with its 37 °C control. In fact, stressors resulted in a pronounced increase in co-localization of Pgp with the cathepsin D lysosomal marker (Mander's overlap coefficient = 0.87–0.88; Fig. 7A).
Initial analysis of these images (Fig. 7B (i)–(v)). was then performed using the software ImageJ and its analytic tool Plot Profile (43). This type of analysis displays intensities of different channels (i.e. green for Pgp and red for cathepsin D) across the white line that crosses the cell body in the merged image in Fig. 7A. Notably, for the 4 °C control, the intensity of the Pgp fluorescence peaks sharply on the outside boundaries of the cell and then decreases markedly in the intracellular compartment, whereas cathepsin D was confined only to the cell body (Fig. 7B (i)). Examining the 37 °C control, the intensity of Pgp channel begins to increase in the intracellular compartment relative to the external membrane (Fig. 7B (ii)). These results are consistent with the increase in internalization of the 125I-Pgp Ab at 37 °C relative to 4 °C (Fig. S2). Hence, there is an alteration in distribution of Pgp between the plasma membrane and the intracellular compartment (Fig. 7B (ii)), but no change in total Pgp after only 1 h of incubation (Fig. 5, A–C). Upon the addition of stressors, the intracellular Pgp and cathepsin D channels strongly merge (Fig. 7B (iii)–(v)).
Additional analysis using ImageJ was performed by masking the cathepsin D channel to demonstrate the distribution of Pgp and enable quantitation of relative Pgp fluorescence intensity inside and outside the cathepsin D–defined lysosomal region (Fig. 7C). In direct accordance with the previous analyses (Fig. 7, A and B), these studies demonstrated a marked and significant (p < 0.001) increase in Pgp inside the lysosome-defined region upon incubation at 37 °C with the stressors relative to that found with the 37 °C control (Fig. 7C). All of these data in Fig. 7 agree with a model of Pgp internalization and trafficking from the plasma membrane to the lysosome upon exposure to micro-environmental stressors.
Tumor micro-environmental stressors increase functional lysosomal Pgp under both normoxia and hypoxia, redirecting DOX into lysosomes and away from nuclei
Our laboratory has previously demonstrated that Pgp actively mediates transport of Pgp substrates into lysosomes (14–16). In particular, DOX was demonstrated to be sequestered by Pgp into the lysosome and away from the nucleus, resulting in resistance to this agent (Fig. 1A (ii) (14, 16, 24)). Considering this, we next assessed whether tumor micro-environmental stressors could potentiate this effect. To assess the functionality of the redistributed lysosomal Pgp under stressful conditions, intracellular trafficking and localization of the intrinsically fluorescent Pgp substrate, DOX (44), was examined by live-cell immunofluorescence microscopy (Figs. 8 and 9).
Figure 8.

Micro-environmental stressors under normoxia increase Pgp-dependent sequestration of DOX in lysosomes of Pgp-expressing KBV1 cells, preventing access of DOX to its nuclear targets. A, KBV1 (+Pgp) cells were incubated under control conditions (0 or 1 h at 37 °C) or for 1 h at 37 °C under the micro-environmental stressors, namely glucose starvation (0 μm), serum starvation (no FCS), or H2O2 stress (100 μm) under normoxia. The cells were then reincubated for 2 h at 37 °C with DOX (25 μm) in the presence and absence of the Pgp inhibitor, Ela (0.2 μm), with the same stressors. Cells were examined via live-cell immunofluorescence imaging with intrinsically fluorescent DOX and with antibodies against LAMP2 for lysosomes or DAPI for nuclei. These images are typical of three independent experiments with data analysis in B and C presented as arbitrary units (a.u.) and are the mean ± S.D. (error bars) (n = 3). *, p < 0.05; **, p < 0.01; ***, p < 0.001, compared with the respective DOX control in B and C. #, p < 0.05; ##, p < 0.01, compared with the relative DOX treatment in C. Scale bar, 10 μm.
Figure 9.

Micro-environmental stressors under hypoxia increase Pgp-dependent sequestration of DOX into lysosomes of Pgp-expressing KBV1 cells, preventing access of DOX to its nuclear targets. A, KBV1 (+Pgp) cells were incubated under control conditions (0 and 1 h) or for 1 h at 37 °C with glucose starvation (0 μm), serum starvation (no FCS), or H2O2 stress (100 μm) under normoxia. This was followed by a 2-h/37 °C incubation of DOX (25 μm) in the presence and absence of the Pgp inhibitor, Ela (0.2 μm), with the same stressors. Cells were examined via live-cell immunofluorescence imaging with the intrinsically fluorescent Pgp substrate, DOX, and with antibodies against LAMP2 for lysosomes. Nuclei (a molecular target for DOX) were stained with DAPI. These images are typical of three independent experiments with data analysis in B and C presented as arbitrary units (a.u.) and are the mean ± S.D. (error bars) (n = 3). *, p < 0.05; **, p < 0.01; ***, p < 0.001, compared with the respective DOX control in B and C. #, p < 0.05; ###, p < 0.001, compared with the relative DOX treatment in C. Scale bar, 10 μm.
In these studies, KBV1 (+Pgp) cells were incubated with tumor micro-environmental stressors under both normoxic (Fig. 8) and hypoxic (Fig. 9) control conditions (0 h), leading to DOX localization in the nucleus (Figs. 8A (i) and 9A (i)). The addition of the potent Pgp inhibitor, elacridar (Ela; 0.2 μm (14, 15)), resulted in no change in the overlap between DOX and LAMP2 relative to the 0-h control (Figs. 8 (A (ii) and B) and 9 (A (ii) and B); cf. Figs. 8 (A (i) and B) and 9 (A (i) and B)). However, Ela led to a significant (p < 0.01–0.05) increase in DOX nuclear accumulation (Figs. 8 (A (ii) and C) and 9 (A (ii) and C)) compared with that observed with DOX alone (Figs. 8 (A (i) and C) and 9 (A (i) and C)). This result was probably due to the ability of the Pgp inhibitor to block Pgp-mediated DOX export out of the cell and also Pgp-induced lysosomal DOX accumulation, thereby allowing DOX to access its nuclear targets.
However, when KBV1 (+Pgp) cells were glucose-starved for 1 h under either normoxia or hypoxia, there was a significant (p < 0.01) increase in DOX overlap with LAMP2-stained lysosomes (Figs. 8 (A (iii) and B) and 9 (A (iii) and B)). The Pgp inhibitor, Ela, reversed the effect of glucose starvation, so that DOX then accumulated in the nucleus and not LAMP2-stained lysosomes (Figs. 8 (A (iv) and C) and 9 (A (iv) and C).
Similarly to the results observed with glucose starvation under normoxia and hypoxia, serum starvation or H2O2 stress also induced significantly (p < 0.001–0.01) more overlap of DOX with lysosomal LAMP2 (see yellow overlap in the merge; Figs. 8 (A (v and vii) and B) and 9 (A (v and vii) and B) compared with control cells (0 h; Figs. 8 (A (i) and B) and 9 (A (i) and B)). Again, this effect was reversed with Ela, resulting in a significant (p < 0.001–0.01) increase in DOX nuclear staining (Figs. 8 (A (vi and viii) and C) and 9 (A (vi and viii) and C)) relative to DOX alone (Figs. 8 (A (v and vii) and C) and 9 (A (v and vii) and C). The redistribution of DOX to the nucleus after inhibition of Pgp by Ela was in good agreement with our previous study (14). In fact, we demonstrated that selective Pgp inhibitors such as Ela or valspodar (45–48) acted similarly to Pgp silencing to inhibit the entrance of DOX into lysosomes, leading to its uptake into nuclei (14). Considering the demonstrated potency and selectivity of Ela (14–17, 24, 45–48), this inhibitor was used throughout this study, as it gave results similar to both valspodar and Pgp siRNA.
In contrast to KBV1 (+Pgp) cells (Figs. 8 and 9), when KB31 cells (very low Pgp) were utilized to study DOX overlap with lysosomal LAMP2 in the presence and absence of Ela and stressors, there was none observed under either normoxia (Fig. S3) or hypoxia (Fig. S4). Further, compared with the untreated control, the addition of Ela had no significant (p > 0.05) effect on the relative distribution of Pgp in KBV1 (+Pgp) cells in the presence or absence of stressors (Fig. S5). Collectively, these controls indicated that Ela acted as a specific Pgp inhibitor in KBV1 (+Pgp) cells and did not nonspecifically affect DOX or Pgp distribution.
Together, the studies and controls in Figs. 8 and 9 and Figs. S3–S5 are consistent with the hypothesis that in Pgp-expressing cells, stressors typically present in the tumor micro-environment (49) result in redistribution of functional Pgp to LAMP2-stained lysosomes. This in turn could lead to increased lysosomal accumulation of Pgp substrates, such as DOX, which prevents its interaction with its nuclear targets.
Tumor micro-environment stressors increase Pgp-mediated lysosomal damage by thiosemicarbazones
The studies above demonstrate that tumor micro-environmental stressors result in rapid redistribution of Pgp into lysosomes (Fig. 5), followed by sustained up-regulation of Pgp (Figs. 2 (A (ii) and B (i) and (ii), 3, and 6) and lysosomal biogenesis over longer incubations (Fig. 6, D and E). This combined effect results in transport of Pgp substrates into lysosomes (Figs. 8 and 9). Considering this, we next investigated whether micro-environmental stressor-induced redistribution of Pgp into the lysosome could also be used to potentiate LMP and cell death in resistant cancer cells. To test this, we used the novel anti-tumor agent, Dp44mT (Fig. 1B (i)) that was previously shown to “hijack” lysosomal Pgp (15–17, 24), inducing more LMP and cell death in resistant cancer cells compared with cells with lower Pgp expression (Fig. 1B (ii)) (15, 18, 24).
In these studies, lysosomal stability was examined using the lysosomotropic, metachromatic fluorophore, acridine orange (AO) (50), by live-cell immunofluorescence microscopy. High lysosomal concentrations of AO result in a red fluorescence, whereas lower cytosolic and nuclear AO concentrations generate green fluorescence (50). Both KB31 (very low Pgp) and KBV1 (+Pgp) cells were preincubated for 1 h under normoxia with either control medium or stressors, namely glucose starvation, serum starvation, or H2O2 (Fig. 10). Cells were then incubated with Dp44mT (25 μm) in the presence or absence of the Pgp inhibitor, Ela (0.2 μm), in the continued absence or presence of these micro-environmental stressors for 24 h at 37 °C.
Figure 10.

Under normoxia, micro-environmental stressors potentiate Dp44mT-mediated lysosomal damage only in high-Pgp–expressing cells. A, KB31 (very low Pgp; i–xii) and KBV1 (+Pgp; xiii–xxiv) cells under normoxia were preincubated for 1 h with either control medium or stressors, namely glucose starvation, serum starvation, or H2O2 stress (100 μm). Cells were then incubated with Dp44mT (25 μm) in the presence or absence of the Pgp inhibitor, Ela (0.2 μm), in the continued absence or presence of these stressors (under normoxia) for 24 h at 37 °C. Lysosomal stability was examined using live-cell immunofluorescence imaging of the lysosomotropic fluorophore, AO, which is sequestered and retained in intact lysosomes. At high lysosomal concentrations of acridine orange, an orange fluorescence is visualized, whereas lower cytosolic and nuclear concentrations produce a green fluorescence. Images are typical of three independent experiments with data analysis in B representing mean ± S.D. (error bars) (n = 3). ***, p < 0.001, relative to respective KBV1 control. ††, p < 0.01, relative to respective treatment with Dp44mT alone. ##, p < 0.01; ###, p < 0.001, relative to respective treatment of KB31 cells with Dp44mT alone. Scale bar, 10 μm.
Examination of KB31 (very low Pgp) cells incubated with Dp44mT (25 μm) in control medium (Fig. 10A (v)) or together with tumor micro-environmental stressors (Fig. 10A (vi)–(viii)) demonstrated a granular red AO fluorescence similar to the respective controls (Fig. 10, A ((i)–(iv)) and B). These observations under normoxia indicate that Dp44mT in the presence or absence of stressors in KB31 (very low Pgp) cells does not damage lysosomes. The addition of Ela (0.2 μm) in combination with Dp44mT under control and stressful conditions also demonstrated no significant (p > 0.05) change in lysosomal stability in KB31 (very low Pgp) cells (Fig. 10, A ((ix)–(xii)) and B).
As observed for KB31 (very low Pgp) cells, KBV1 (+Pgp) cells exposed to stressors under normoxia (Fig. 10A (xiv)–(xvi)) showed no significant (p > 0.05) change in lysosomal stability relative to the control (Fig. 10, A (xiii) and B). Further, Dp44mT (25 μm) had no significant (p > 0.05) effect on KBV1 (+Pgp) cells under control normoxia (24 h; Fig. 10, A (xvii) and B). In contrast, incubation of KBV1 (+Pgp) cells with Dp44mT under glucose starvation, serum starvation, or H2O2 stress resulted in a marked and significant (p < 0.001) loss of red fluorescence and the disappearance of red-stained AO vesicles consistent with increased lysosomal damage and LMP (Fig. 10, A ((xviii)–(xx)) and B) However, when adding the Pgp inhibitor, Ela (0.2 μm), to cells treated with Dp44mT and the stressors, the distinctive lysosomal red fluorescence pattern was again observed (Fig. 10, A ((xxii)–(xxiv)) and B). This observation indicates that inhibiting Pgp activity with Ela prevented the ability of Dp44mT to damage lysosomes when cells were under stress.
These results in Fig. 10 indicate that stressors potentiate Pgp-mediated lysosomal damage induced by Dp44mT. Importantly, this occurred only in Pgp-expressing KBV1 cells and was not observed in KB31 (very low Pgp) cells.
To further mimic the tumor micro-environment, these treatments using stressors in Fig. 10 (A and B) were repeated using the same conditions, except under hypoxia (Fig. 11, A and B). As per the observations under normoxia (Fig. 10A (v)), Dp44mT alone did not induce LMP under hypoxia in KB31 (very low Pgp) cells (Fig. 11A (v)). However, in contrast to normoxia (Fig. 10A (vi)–(viii)), the red-stained lysosomes disappeared when KB31 (very low Pgp) cells were incubated under hypoxia with Dp44mT and either glucose starvation, serum starvation, or H2O2 (Fig. 11A (vi)–(viii)). This indicated lysosomal damage under these conditions.
Figure 11.

Under hypoxia, micro-environmental stressors potentiate Dp44mT-mediated lysosomal damage in both low- and high-Pgp–expressing cells. A, KB31 (very low Pgp; i–xii) and KBV1 (+Pgp; xiii–xxiv) cells under hypoxia were preincubated for 1 h with either control medium or stressors, namely glucose starvation, serum starvation, or H2O2 stress (100 μm). Cells were then incubated with Dp44mT (25 μm) in the presence or absence of the Pgp inhibitor, Ela (0.2 μm), in the continued absence or presence of these stressors (under hypoxia) for 24 h at 37 °C. Lysosomal stability was examined using live-cell immunofluorescence imaging of the lysosomotropic fluorophore, AO, which is retained within intact lysosomes. At high lysosomal concentrations of acridine orange, a red fluorescence is visualized, whereas lower cytosolic and nuclear concentrations produce a green fluorescence. Images are typical of three independent experiments with data analysis in B representing mean ± S.D. (error bars) (n = 3). *, p < 0.05; **, p < 0.01; ***, p < 0.001, relative to respective control. †††, p < 0.001, relative to the respective treatment with Dp44mT alone. Scale bar, 10 μm.
The Pgp inhibitor, Ela (0.2 μm), reversed this latter effect of Dp44mT (Fig. 11A (x)–(xii) versus (vi)–(viii)) by inhibiting Pgp-mediated transport of Dp44mT into lysosomes and, thus, preventing lysosomal damage (15–17). Hence, these observations demonstrated that stressors up-regulate Pgp, even in very low-Pgp–expressing KB31 cells, as shown in Western blotting studies (Fig. 2B (i)). This up-regulation of Pgp is probably responsible for the increased lysosomal damage via Dp44mT (Fig. 11A (vi)–(viii)).
Similar to normoxia (Fig. 10A (xviii)–(xx)), incubation of KBV1 (+Pgp) cells under hypoxia with Dp44mT and either glucose starvation, serum starvation, or H2O2 resulted in a loss of red fluorescence that is indicative of LMP (Fig. 11A (xviii)–(xx)). In contrast, the lysosomal red fluorescence appeared upon the addition of Ela to cells treated with Dp44mT and the stressors under hypoxia (Fig. 11A (xxii)–(xxiv)).
These results in Fig. 11 demonstrate that hypoxia combined with other stressors can potentiate the Pgp-mediated lysosomal damage of Dp44mT not only in highly Pgp-expressing KBV1 cells, but also in cells such as KB31 that express very low Pgp levels under basal conditions.
Tumor stressors induce Pgp resistance to DOX
To determine how tumor micro- environmental stressors affect Pgp-mediated drug resistance, the cytotoxicity of DOX was characterized in KB31 cells (very low Pgp), KBV1 (+Pgp) cells and an endogenously Pgp-expressing cell line, DMS-53 (29, 51), under normoxia, or hypoxia (Table 1 (A–C) and Fig. S6, A–F). All cell types were preincubated for 1 h at 37 °C with either normoxia or hypoxia (1% O2) and the different micro-environmental stressors found in tumors (i.e. glucose starvation, serum starvation, and H2O2). The cells were then incubated for a further 24 h at 37 °C under normoxia or hypoxia with these stress conditions with DOX (0.2–100 μm) in the presence and absence of the Pgp inhibitor, Ela (0.2 μm). The concentration of DOX required to inhibit proliferation by 50% (i.e. IC50 value) was then calculated.
Table 1.
Effect of tumor stressors on DOX cytotoxicity in very low Pgp– or high-Pgp–expressing tumor cells under normoxia or hypoxia
KB31 (very low Pgp), (A) KBV1 (+Pgp), and (B) DMS-53 (+Pgp) (C) cells were preincubated for 1 h at 37 °C under normoxia (21% O2) or hypoxia (1% O2) with or without the stressors: (−)Glucose (0 μm), (−)Serum (no FCS), or (+)H2O2 (100 μm). The cells were then incubated with or without these stressors under normoxia or hypoxia for 24 h/37 °C with DOX (0.2–100 μm) in the presence or absence of Ela (0.2 μm). Proliferation was assessed by the MTT assay. The results are mean ± SD (three experiments). *, p < 0.05, relative to the respective control. #, p < 0.05; ##, p < 0.01, relative to the respective DOX treatment with Ela.
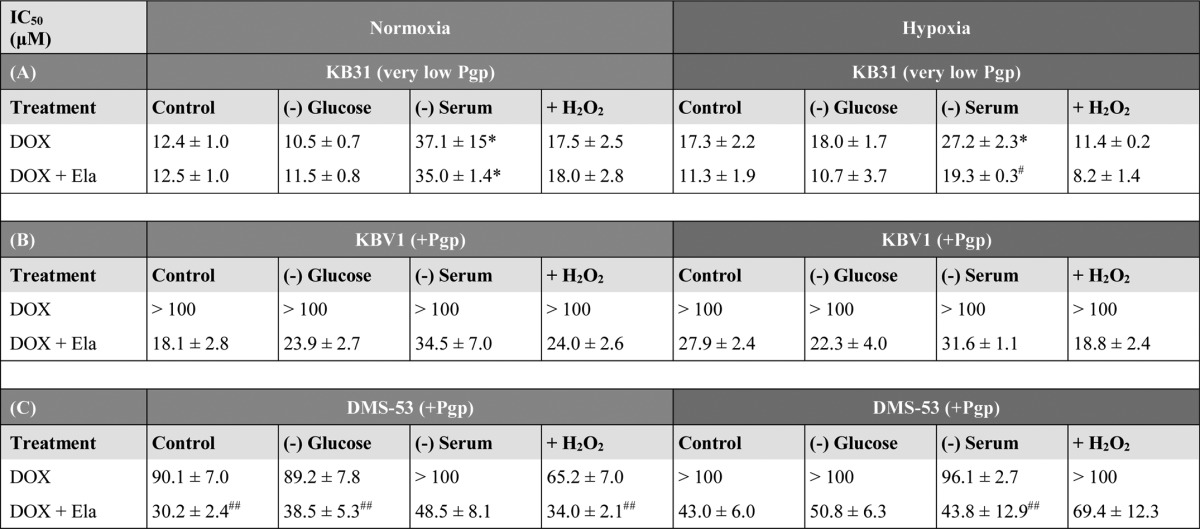
Initially, as a negative control, very low-Pgp–expressing KB31 cells (14) underwent a 24-h incubation with DOX under normoxia in the presence and absence of Ela (Table 1A). There was no significant (p > 0.05) difference in the IC50 of KB31 (low Pgp) cells incubated under normoxic control conditions with DOX in the presence and absence of the Pgp inhibitor, Ela (0.2 μm; Table 1A). Similarly, Ela had no effect on the IC50 of DOX in KB31 cells that were glucose-starved (0 μm), serum-starved, or exposed to H2O2 (100 μm) stress for 24 h under normoxia (Table 1A). Interestingly, the IC50 of DOX and DOX + Ela under serum starvation were significantly (p < 0.05) increased relative to DOX alone or DOX + Ela, respectively, under control conditions (Table 1A). In this case, Ela had no effect on the IC50, suggesting that the increased IC50 value was independent of Pgp. Considering this, the high IC50 may be due to the G1/S arrest caused by serum starvation, which may decrease DOX activity (52). The lack of effect of Ela on the cytotoxicity of DOX under normoxia was probably because the stressors did not alter Pgp expression under these conditions (Fig. 2A (i)).
To further test the effect of stressors on the cytotoxicity of DOX, KB31 (very low Pgp) cells were subjected to hypoxia alone or to hypoxia with glucose starvation, serum starvation, or H2O2 stress (100 μm; Table 1A). The IC50 for DOX under these conditions was slightly higher than that under normoxia alone (Table 1A), which is consistent with an up-regulation of Pgp (Fig. 2B (i)) and, thus, the reduced efficacy of DOX. The addition of Ela to KB31 (very low Pgp) cells under control conditions, glucose starvation, serum starvation, or H2O2 stress during hypoxia led to a decrease or to a significant (p < 0.05) decrease (for serum starvation) in the IC50. This observation indicates an increase in DOX cytotoxicity, suggesting a role for Pgp in resistance against this drug (Table 1A). Together with the results in Fig. 2B (i), these data indicate that hypoxia plays a major role in Pgp expression and activity, which contributes to drug resistance toward DOX.
To compare the effect of Pgp on drug efficacy, the IC50 of DOX in the presence or absence of Ela (0.2 μm) was also investigated in KBV1 (+Pgp) cells under normoxia or hypoxia (Table 1B). Implementing control normoxia, an IC50 value could not be established for DOX, as it was >100 μm (Table 1B). This result suggested a role for the high Pgp levels in KBV1 cells conferring resistance against DOX relative to KB31 (very low Pgp) cells (Table 1B). This was substantiated by studies showing that Ela (0.2 μm) caused a pronounced decrease in the IC50 of DOX in KBV1 (+Pgp) cells from >100 μm to 18.1 ± 2.8 μm (Table 1B).
This latter trend was also observed during glucose starvation, serum starvation, and H2O2 stress under normoxia, where the IC50 of DOX was >100 μm, whereas the addition of Ela (0.2 μm) again markedly sensitized KBV1 (+Pgp) cells to drug treatment, resulting in IC50 values from 23.9 to 34.5 μm (Table 1B). Furthermore, the cytotoxicity of DOX in KBV1 (+Pgp) cells under hypoxia alone and in combination with stressors was similar to that under normoxia, being >100 μm (Table 1B). Under all conditions, the addition of Ela (0.2 μm) led to a pronounced decrease in the IC50 to 18.8–31.6 μm, indicating an increase in DOX cytotoxicity probably due to inhibition of Pgp (Table 1B).
Results similar to those for KBV1 cells (Table 1B) were also obtained using DMS-53 lung cancer cells (Table 1C) that express relatively high endogenous Pgp levels (Fig. 3). Under normoxic control conditions, Ela led to a marked and significant (p < 0.01) decrease in the IC50 of DOX from 90.1 ± 7.0 to 30.2 ± 2.4 μm (i.e. increase in DOX cytotoxicity; Table 1C). All stress conditions showed a marked increase in DOX cytotoxicity in the presence of Ela (Table 1C). Under hypoxia in the presence or absence of stressors, the IC50 of DOX increased or remained similar to that observed under normoxia, suggesting decreased or comparable efficacy of DOX (Table 1C). Similarly to normoxia, the addition of Ela under control hypoxia led to an increase in DOX cytotoxicity (i.e. from >100 μm to 43.0 ± 6.0 μm), which is probably due to the inhibitor suppressing Pgp activity (Table 1C). This marked increase in DOX cytotoxicity in the presence of Ela was also observed with glucose starvation, serum starvation, and H2O2 stress under hypoxia (Table 1C).
Overall, in the presence or absence of stressors for KBV1 (+Pgp) and DMS-53 (+Pgp) cells under normoxia and hypoxia or for KB31 (very low Pgp levels) cells under hypoxia, Ela increased DOX cytotoxicity (Table 1, A–C), suggesting a role for Pgp in conferring DOX resistance. Notably, Ela could only increase DOX cytotoxicity in KB31 cells (Table 1A) under stressful conditions (i.e. hypoxia in the presence or absence of additional stress stimuli), where an increase in Pgp expression occurred (cf. Fig. 2, A (i) and B (i)).
Tumor stressors up-regulate Pgp, increasing sensitivity to Dp44mT
As hypoxia and the ensuing Pgp expression leads to resistance to DOX (Table 1), one strategy to combat this major clinical problem (53) could be the use of agents, such as Dp44mT, that overcome Pgp-mediated resistance by targeting lysosomes (Fig. 1B (ii)) (15, 16). As stressors, such as hypoxia, exacerbate DOX resistance (Table 1) by up-regulating Pgp (Figs. 2 (compare A and B) and 3 (compare A and B)), it was crucial to establish how Dp44mT efficacy is influenced by tumor stressors (Fig. 12). This was assessed using the same experimental conditions described above for Table 1, implementing KB31 (Fig. 12A), KBV1 (Fig. 12B), and DMS-53 cells (Fig. 12C), comparing normoxia or hypoxia.
Figure 12.
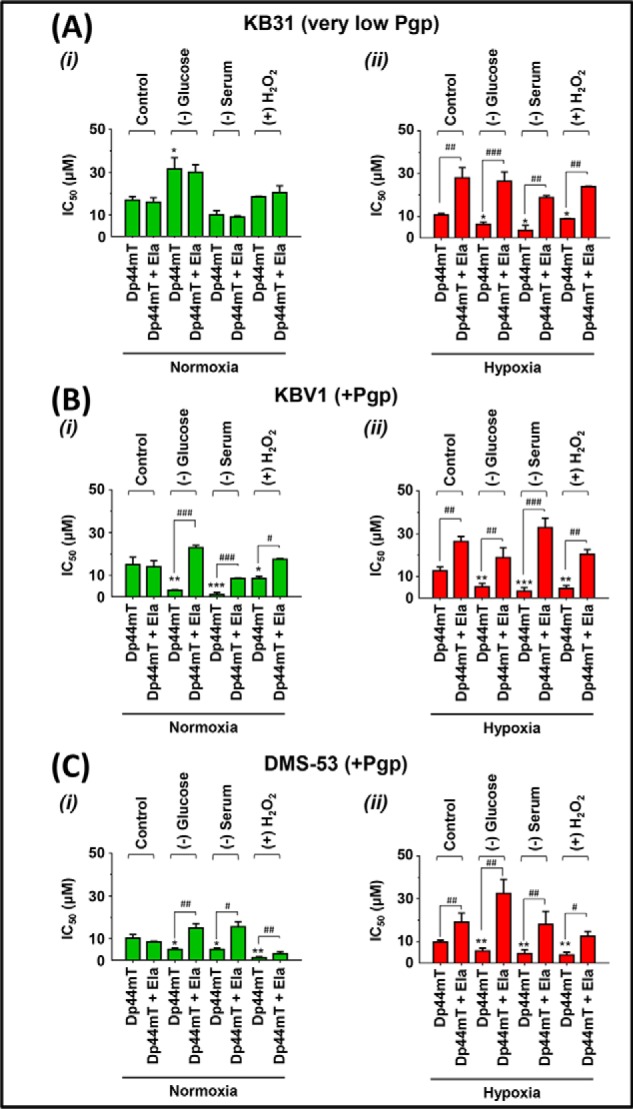
Micro-environmental stressors potentiate Pgp-mediated Dp44mT cytotoxicity to a greater extent under hypoxia relative to normoxia. KB31 (very low Pgp) (A), KBV1 (+Pgp) (B), and DMS-53 (+Pgp) (C) cells were preincubated for 1 h at 37 °C either under control conditions or with the micro-environmental stressors glucose starvation (0 μm), serum starvation (no FCS), or H2O2 stress (100 μm) under either normoxia (i) or hypoxia (ii). An additional incubation of 24 h/37 °C under the same conditions was then performed with the addition of Dp44mT (0.2–100 μm) in the presence and absence of the Pgp inhibitor, Ela (0.2 μm), under normoxia or hypoxia. Cellular proliferation was measured using the MTT proliferation assay. Results are typical of three independent experiments with data analysis representing mean ± S.D. (error bars) (n = 3). *, p < 0.05; **, p < 0.01; ***, p < 0.001, relative to the respective Dp44mT control. #, p < 0.05; ##, p < 0.01; ###, p < 0.001, relative to the respective Dp44mT treatment with Ela.
For KB31 (very low Pgp) cells under normoxia (Fig. 12A (i)), the IC50 of Dp44mT was significantly (p < 0.05) increased (i.e. increased resistance and decreased cytotoxicity) only under glucose starvation but was not significantly (p > 0.05) affected by the other stressors. The reason for this unique effect of glucose starvation is unclear, but as the Pgp inhibitor, Ela, had no influence on the IC50 of Dp44mT (Fig. 12A (i)), this effect does not appear to be due to Pgp activity.
Using KB31 (very low Pgp) cells under hypoxia in the presence of the other stressors (Fig. 12A (ii)), Dp44mT was significantly (p < 0.05) more cytotoxic relative to the hypoxic Dp44mT control. Moreover, Ela significantly (p < 0.001–0.01) decreased the sensitivity to Dp44mT (i.e. increased IC50) using all conditions under hypoxia (Fig. 12A (ii)). These data with Ela indicate the role of Pgp activity in mediating the cytotoxicity of Dp44mT. In other words, these results are consistent with Ela inhibiting Pgp-mediated transport into the lysosome and preventing lysosomal damage and cytotoxicity by Dp44mT when exposed to hypoxia and stressors (see Figs. 1B (ii) and 10A). The fact that this inhibition by Ela only occurred under hypoxia, and not normoxia, is consistent with the increased Pgp expression under hypoxia in KB31 (very low Pgp) cells (Fig. 2 (compare A (i) and B (i)).
We also used KBV1 (+Pgp) cells to assess the effects of stressors on Dp44mT cytotoxicity (Fig. 12B). Importantly, when KBV1 (+Pgp) cells were incubated with Dp44mT under normoxia with all stressors (Fig. 12B (i)), there was a significant (p < 0.001–0.05) increase in Dp44mT cytotoxicity relative to the Dp44mT control. Under these later stressors, Ela significantly (p < 0.001–0.05) decreased the cytotoxicity (Fig. 12B (i)). This observation suggested that the stress-induced increase in Pgp imparted by these stressors (Fig. 2A (ii)) enhanced lysosomal damage by Dp44mT, which killed the resistant KBV1 (+Pgp) cells (Fig. 12B (i)).
Under hypoxia, Ela significantly (p < 0.01) prevented Dp44mT cytotoxicity to KBV1 (+Pgp) cells (Fig. 12B (ii)). Similarly to normoxia, all stressors under hypoxia significantly (p < 0.001–0.01) increased Dp44mT cytotoxicity to KBV1 (+Pgp) cells relative to the Dp44mT control under hypoxia (Fig. 12B (ii)). Notably, endogenously Pgp-expressing DMS-53 cells (Fig. 12C) responded similarly to KBV1 (+Pgp) cells (Fig. 12B) in response to all stressors under normoxia and hypoxia.
Collectively, the results in Fig. 12 suggest that tumor stressors potentiate Dp44mT cytotoxicity, especially under hypoxia. This is probably due to the increased Pgp redistribution to, and expression in, lysosomes (Figs. 2, 5, and 6), leading to Dp44mT-mediated lysosomal damage (Figs. 10 and 11) and increased cytotoxicity in resistant cancer cells (Fig. 1B (ii)). In contrast, for DOX, the increase of Pgp in lysosomes after stressors decreased DOX cytotoxicity (i.e. increased IC50; Table 1) due to the trapping of DOX in lysosomes, preventing access to its sensitive nuclear targets (Figs. 8 and 9; so called “safe house” effect; see Fig. 1A (ii)).
Discussion
In this study, we demonstrate for the first time that micro-environmental stressors, such as hypoxia, serum, glucose starvation, and H2O2, markedly increase drug resistance to known chemotherapeutics, such as DOX. Furthermore, we demonstrate that stressors characteristic of the tumor micro-environment greatly affected drug resistance not only by up-regulating Pgp, but also by relocalizing Pgp to lysosomes. This investigation also showed that stressors up-regulate HIF-1α, which is involved in the transcriptional up-regulation of Pgp (5–7, 32).
Under normoxia, HIF-1α is a short-lived protein due to its proteasome-mediated degradation that is enhanced by the iron-dependent prolyl hydroxylases 1–3 (54, 55). However, tumor micro-environmental stressors, such as hypoxia, glucose starvation, and increased ROS production (12), can decrease prolyl hydroxylase activity, resulting in increased HIF-1α expression (55, 56). Our data demonstrate that micro-environmental stressors play a marked role in up-regulating Pgp and HIF-1α expression in a range of cell types. Moreover, studies implementing silencing of HIF-1α led to suppression of stress-dependent Pgp up-regulation. These results indicate that HIF-1α is involved in Pgp up-regulation in response to cellular stress (5–7).
Stressors in the tumor have also been implicated in triggering endocytosis, which is initiated as a cell survival mechanism (16, 35). In the current studies, a short (1-h) exposure of Pgp-expressing KBV1 cells to tumor stressors under normoxia or hypoxia did not lead to up-regulation of Pgp (Fig. 5A). However, this short exposure to stress stimuli resulted in a major change in Pgp distribution, resulting in significant co-localization with lysosomes (Fig. 5, B, C, E, and F). Indeed, we demonstrated that a short-term exposure to stressors increases internalization of Pgp from the plasma membrane into the lysosomal compartment (Fig. 7, A–C). In addition to this, under prolonged hypoxia, an increase in both Pgp and lysosomal-LAMP2 expression was observed in addition to their co-localization (Fig. 6, D–F). The increase of the lysosomal marker, LAMP2, in response to prolonged stress was in line with the ability of the cell to adapt to stressors, resulting in up-regulation of autophagy (57) and lysosomal biogenesis (16, 58).
The stress-induced increase in lysosomal Pgp was also found to be functional and led to increased trapping of DOX in lysosomes, resulting in decreased targeting of DOX to the nucleus (Figs. 8 and 9). In fact, tumor stressors led to DOX significantly redistributing to LAMP2-positive lysosomes in Pgp-expressing cells. The crucial role of stress-induced lysosomal Pgp was further supported by the observation that the Pgp inhibitor, Ela, prevented DOX sequestration in lysosomes, allowing DOX to reach one of its major molecular targets (i.e. nuclear DNA; Figs. 8 and 9). Hence, not only does Pgp facilitate drug efflux out of cells, but when this drug pump is endocytosed, it can also promote trapping of substrates in lysosomes (14, 16). For DOX, this decreases its anti-tumor efficacy due to the “safe house” effect, which prevents interaction of DOX with its molecular targets in the nucleus (see Fig. 1A (ii)). Furthermore, the hydrolytic environment of the lysosome and its role in the dynamic process of autophagy could facilitate the degradation of DOX. The lysosome is the site of ∼40 hydrolytic enzymes, and its acidic pH that mediates the degradation of myriad substrates (59) provides an optimized “reaction vessel” for facilitating drug breakdown. Hence, the ability of the lysosome to safely sequester DOX away from its key molecular targets in the nucleus (this study) and also its dynamic role in hydrolytic degradation could both play a role in DOX resistance.
As an alternative strategy for overcoming Pgp-mediated drug resistance, Dp44mT has been shown to “hijack” lysosomal Pgp pumps to induce lysosomal damage via ROS generation (15). This investigation demonstrated that tumor stressors under normoxia or hypoxia result in increased Dp44mT Pgp-mediated lysosomal damage (Figs. 10 and 11). Interestingly, when incubating low-Pgp–expressing KB31 cells with hypoxia, these cells became sensitive to Dp44mT-induced lysosomal damage under tumor stressors. The lysosome-damaging effects were directly linked to Pgp activity, as the potent Pgp inhibitor, Ela (14), rescued lysosomal damage (Figs. 10 and 11). Thus, our studies demonstrated that stress stimuli increased lysosomal Pgp, which can potentiate lysosomal damage for agents targeting this organelle.
DOX induces cell death through DNA intercalation (60). However, the therapeutic use of this drug can be severely limited in patients due to Pgp-mediated resistance (61). In the current studies, Pgp was induced by hypoxia and other stressors, leading to decreased DOX cytotoxicity even in very low-Pgp–expressing KB31 cells. Opposite to the effect of DOX, under hypoxia, tumor stressors potentiated the effectiveness of Dp44mT to induce cytotoxicity to very low-Pgp–expressing KB31 cells (Fig. 12A). The activity of Pgp played a central role in this potentiated cytotoxicity of Dp44mT, as the Pgp inhibitor, Ela, decreased Dp44mT-mediated cytotoxicity under all stressors in KBV1 and DMS-53 cells (Fig. 12, B and C). Hence, the marked differences in the pharmacology of Dp44mT and DOX enable Dp44mT to take advantage of the tumor micro-environment to utilize lysosomal Pgp to kill resistant cancer cells.
In conclusion, the classical anti-cancer agent, DOX, presents limited cytotoxicity to Pgp-expressing cells in the stressful tumor micro-environment. The tumor micro-environment–inducible Pgp prevents DOX from reaching one of its major molecular targets, namely the nucleus (6, 16) (Fig. 13). However, the stressors typically found under these conditions resulted in potentiated cytotoxicity of novel lysosomal targeting agents, such as Dp44mT, via increased Pgp-mediated targeting of lysosomes. In fact, the stressful tumor micro-environment increases functional Pgp on the lysosomal membrane and facilitates entry of Dp44mT into this organelle, where it induces LMP and cell death. This property is a distinctive advantage of these thiosemicarbazones over standard chemotherapy and is important, as this class of agents has entered multicenter clinical trials in patients with advanced cancers (22, 23).
Figure 13.

Schematic model illustrating the two major mechanisms of Pgp regulation by which tumor micro-environmental stressors increase drug resistance. Tumor micro-environment stressors (i.e. serum starvation, low glucose levels, ROS, and hypoxia) induced Pgp-mediated resistance by two mechanisms: 1) redistribution of Pgp to lysosomes after short-term (1-h) stress and 2) increased Pgp expression via HIF-1α accompanied by lysosomal biogenesis after long-term (4–24-h) stress. A, basal Pgp expression in unstressed (normoxic) cancer cells; B, short-term exposure to stressors causes a rapid increase in Pgp redistribution to lysosomes; C, long-term exposure to stressors also redistributes Pgp to lysosomes but additionally increases Pgp levels via HIF-1α and lysosomal biogenesis. Within the lysosome, Pgp allows import of Pgp substrates into this organelle. D, from a therapeutic standpoint, stressors decrease drug sensitivity/toxicity (i.e. increase drug resistance) to DOX via increased Pgp expression and Pgp-mediated lysosomal drug trapping (i.e. lysosomal “safe house” effect). In contrast to DOX, tumor micro-environmental stress increases drug sensitivity/toxicity of Dp44mT toward Pgp-expressing cells. Significantly, the stressors induce Pgp-mediated resistance to DOX, whereas Dp44mT directly utilizes Pgp to overcome this resistance and kill tumor cells.
Experimental procedures
Cell culture
Cells were grown in Dulbecco's modified Eagle's medium (Life Technologies, Inc.) supplemented with 10% (v/v) fetal calf serum (Sigma-Aldrich), 1% (v/v) sodium pyruvate, 1% (v/v) non-essential amino acids, 100 units/ml penicillin, 100 μg/ml streptomycin, 2 mm l-glutamine, and 0.28 μg/ml fungizone (all from Life Technologies). The cells were then incubated at 37 °C under either (i) normoxia using a humidified atmosphere of 5% CO2 and 95% air in a water-jacketed incubator (Forma Series III, Thermo Scientific, Waltham, MA) or (ii) hypoxia in a humidified atmosphere of 1% O2, 5% CO2, and 94% N2 in a Coy Scientific (Grass Lake, MI) hypoxia chamber (62).
The human KB31 epidermoid carcinoma, DMS-53 lung carcinoma, MDA-MB-23 breast cancer, PANC-1 pancreatic cancer, PC-3 prostate cancer, and DU-145 prostate cancer cell lines were obtained from the American Type Culture Collection (Manassas, VA). The Pgp-overexpressing cell line, KBV1, was derived from KB31 cells by selection in medium supplemented with VBL (0.5 μg/ml). This concentration of VBL resulted in a partial MDR phenotype in KBV1 cells (63), allowing Pgp induction upon stimulation.
Cellular growth and viability were assessed by phase-contrast microscopy, cell adherence to the culture substratum, and trypan blue staining. For all experiments, to study tumor micro-environment–induced stress, cells were exposed to either (i) glucose starvation (0 μm) through the use of glucose-free Dulbecco's modified Eagle's medium (catalog no. 11966-025, Life Technologies); (ii) serum starvation (no FCS); or (iii) medium supplemented with H2O2 (100 μm) in the presence or absence of normoxia (21% O2) or hypoxia (1% O2). Each of these stress stimuli are well known to exist within the tumor micro-environment (12, 25, 26).
Protein extraction and Western blotting
Whole-cell, membrane protein extractions and Western blotting were performed using standard procedures (15, 16, 64). Membranes were probed using mouse anti-human Pgp (catalog no. P7965, 1:5,000; Sigma-Aldrich) or mouse anti-mouse Pgp (catalog no. C219, 1:3,500; Thermo Fisher Scientific), mouse anti-HIF-1α (catalog no. 610959, 1:400; BD Biosciences), or rabbit anti-HIF-1α (catalog no. ab179483, 1:1,000; Abcam, Cambridge, UK). Incubations were performed overnight at 4 °C or 2 h at 25 °C, followed by incubation with an appropriate secondary antibody (HRP-conjugated goat anti-mouse; catalog no. A4416, 1:2,000; Sigma-Aldrich), or goat anti-rabbit (catalog no. A6154, 1:5,000; Sigma-Aldrich) for 1 h at room temperature.
Membranes were developed with enhanced chemiluminescence reagent (Amersham Biosciences) and visualized using a ChemiDoc system (Bio-Rad). Densitometry was performed using ImageLab software (Bio-Rad). β-Actin (catalog no. A5441, 1:10,000; Sigma-Aldrich) was used as a protein-loading control.
HIF-1α silencing
Cellular HIF-1α expression was silenced using ON-TARGETplus human HIF-1α siRNA SMARTPools (catalog no. L-004018-00; Dharmacon, Lafayette, CO). Briefly, the HIF-1α/lipofectamine mixture (20 nm HIF-1α siRNA and Lipofectamine RNAiMAX; Life Technologies) combined in a 1:24 (siRNA/lipofectamine) ratio was added to the cells soon after seeding them using reverse transfection and incubated for 48 h at 37 °C before further experimentation. The effectiveness of HIF-1α silencing was examined using Western blotting. A negative control siRNA (ON-TARGETplus Non-Targeting Pool siRNA; catalog no. D-001810-10; Dharmacon, Lafayette, CO) was used at the same concentration as HIF-1α siRNA.
Immunofluorescence
For assessment of intracellular Pgp co-localization, cells (1 × 10⁵ cells/ml) were grown on coverslips (24 h/37 °C) and incubated for 1 h at 37 °C under control conditions or with stress stimuli, such as glucose starvation, serum starvation, or H2O2 (100 μm), under normoxia or hypoxia. These steps were similarly carried out for experiments assessing Pgp function, although the cells were then incubated with DOX (10 μm; 2 h at 37 °C). For both studies, this procedure was followed by paraformaldehyde fixation (4% (w/v), 15 min/20 °C) and digitonin permeabilization (100 μm, 10 min at 20 °C). Importantly, the mild detergent digitonin was utilized to specifically avoid dissolving the lysosomal membrane (65). After blocking with 5% (w/v) BSA, immunofluorescence was performed by incubation (16 h/4 °C) with FITC (FITC-conjugated anti-Pgp (1:100, catalog no. 557002; BD Biosciences), and anti-LAMP2 (1:20, catalog no. ab25631; Abcam, Cambridge, UK) antibodies (24 h at 4 °C).
In the case of the primary incubation with anti-LAMP2 Ab, this was followed by treatment (1 h at 25 °C) with Alexa Fluor-conjugated secondary antibodies (1:1,000, catalog nos. A-21200 and A-21201, Invitrogen). The coverslips where then mounted onto DAPI (0.5 μm; Invitrogen). Stained samples were examined using a Zeiss LSM 510 Meta confocal microscope (Zeiss, Oberkochen, Germany) equipped with FITC (excitation, 495 nm; emission, 516 nm) and Texas Red (excitation, 577 nm; emission, 592 nm) filters and captured with Zeiss LSM 510 META software (Zeiss). Fluorescence intensity and Mander's overlap for image co-localization were measured using ImageJ version 4.7 software (National Institutes of Health). Scan parameters were kept constant during acquisition of all images. Minimal image processing (i.e. brightness and contrast only) was carried out on all confocal images presented. Slight adjustments in brightness and contrast were made in images to allow low level fluorescent signals to be observed more clearly. However, all image analysis measurements, including co-localization analyses were carried out on raw data. For each slide assessed, three separate field of views were used, and at least three cells were counted per field. The fields of view were chosen randomly with no selection criteria being applied. Each condition was performed at least three times independently.
125I labeling of antibodies
Labeling of the specific anti-Pgp (Mab 4E3; Abcam, ab10333) and nonspecific Ab, namely goat anti-rabbit polyclonal Ab (catalog no. A6154, Sigma-Aldrich) was performed with Na125I (carrier-free, NEZ033A001MC, PerkinElmer Life Sciences), as described by Brown et al. (66).
Pulse-chase analysis to assess internalization of Pgp
Examination of the internalization of Pgp from the plasma membrane to intracellular compartments was performed via a pulse-chase protocol (67) using either radioisotope labeling or immunofluorescence.
In initial studies, the uptake of 125I-labeled anti-Pgp Ab was examined using KBV1 (+Pgp) cells. These cells were seeded on 35-mm3 plates and allowed to grow overnight. They were first cooled to 4 °C on ice to limit endocytosis (40), and the 125I-labeled antibody was then added for 1 h at 4 °C on ice. For the 4 °C control condition, cells were washed six times on ice with ice-cold PBS to remove unbound Ab. The cells were then incubated for 30 min on ice with the protease, Pronase (1 mg/ml) to separate membrane-bound proteins from internalized proteins using standard methods (40–42). For the 1-h control/stress conditions at 37 °C, the labeled cells at 4 °C were washed six times on ice with ice-cold PBS. Then prewarmed medium was added and incubated for 1 h at 37 °C. Cells were then treated with Pronase as above to separate the membrane (Pronase-sensitive) from the internalized (Pronase-resistant) compartment. At the end of the incubation, the cell monolayer was then detached from the plate using a plastic spatula and centrifuged at 14,000 rpm for 3 min at 4 °C. The supernatant that contains membrane-bound 125I was removed, and the cell pellet containing internalized 125I was resuspended in 1 ml of PBS. The levels of 125I in both the supernatant and cell suspension were measured using a γ-counter (Wallac Wizard 3, Turku, Finland).
For immunofluorescence studies, KBV1 cells were seeded onto 24-well plates containing coverslips and were left to grow overnight. KBV1 cells were seeded onto 24-well plates containing coverslips and were left to grow overnight. The plates were first cooled to 4 °C on ice to limit endocytosis (40), and the anti-Pgp (Mab 4E3; Abcam; catalog no. ab10333) antibody was then added at a 1:100 dilution and incubated for 1 h at 4 °C on ice.
For the 4 °C control condition, cells were thoroughly washed three times with ice-cold PBS on ice to remove unbound Ab. This was followed by a further wash with ice-cold PBS. The cells were incubated with 4% (w/v) paraformaldehyde for 10 min at room temperature to enable fixation. Cells were then washed twice with PBS and permeabilized by incubation with 200 μm digitonin.
For the 1-h control/stressors at 37 °C, the plates were thoroughly washed three times with ice-cold PBS on ice. Then prewarmed medium containing the stressors (control, glucose-free medium, serum-free medium, or 100 μm H2O2) was added to the respective wells and incubated for 1 h at 37 °C. Cells were washed once with PBS, followed by incubation with 4% (w/v) paraformaldehyde for 10 min at room temperature to ensure fixation. Cells were then washed twice with PBS and incubated with 200 μm digitonin.
For both the 0-h control at 4 °C and 1-h control/stressors plate at 37 °C, cells were washed three times with PBS every 5 min. Cells were then blocked with 10% BSA in PBS-T for 30 min and incubated with cathepsin D antibody (Abcam; catalog no. ab72915) at 1:100 dilution overnight at 4 °C with agitation. Cells were incubated with both anti-mouse Alexa Fluor® 488 (green; for Pgp Ab) and anti-rabbit Alexa Fluor® 594 (red; for cathepsin D Ab) secondary antibodies at a 1:1,000 dilution for 1 h in the dark with agitation. Cells were then washed three times with PBS every 5 min. Coverslips were mounted on slides with ProLong Gold DAPI and sealed with nail polish and left to dry. Images were taken using the confocal microscope implemented above and analyzed using ImageJ.
Plot profile analysis to assess cellular internalization of Pgp
Plots were generated from confocal images using the Plot Profile analysis function in ImageJ. The merged confocal image was split into its individual channels, and a line for performing Plot Profile analysis was drawn through the cell, excluding the DAPI-stained nucleus. Cells chosen for analysis were representative of the overall pattern of expression of both cathepsin D and Pgp for each condition. The plot generated displays the intensity of protein expressed as a gray value for each point along the distance of the line measured in micrometers.
To examine the proportion of Pgp in and outside of lysosomes under various incubation conditions, a “mask” was created from the cathepsin D channel and was applied to the Pgp channel using ImageJ. Corrected total cell fluorescence was then calculated by established methods (68) for Pgp inside and outside the masked region using ImageJ.
Live-cell fluorescence imaging
The lysosomal stains, LAMP2 and DAPI, were used to determine whether DOX (intrinsically fluorescent) localizes to lysosomes or nuclei, respectively. Cells were incubated under control conditions (0 or 1 h at 37 °C) or for 1 h at 37 °C under the micro-environmental stressors, namely glucose starvation (0 μm), serum starvation (no FCS), or H2O2 stress (100 μm) under normoxia. The cells were then re-incubated for 2 h at 37 °C with DOX (25 μm) in the presence or absence of the Pgp inhibitor, Ela (0.2 μm), with the same stressors. Cells were then washed three times with ice-cold PBS. Live cells were visualized for green (495-nm excitation/516-nm emission), red (577-nm excitation/592-nm emission), and blue (358-nm excitation/461-nm emission) by wide-field fluorescence (Axio Observer Z1 microscope; Zeiss, Oberkochen, Germany) using an LD Plan-NEOFLUAR 40×/0.6 Ph2 Korr objective.
Assessment of lysosomal membrane permeability
Microscopic visualization of lysosomes was performed using the classical lysosomotropic stain, AO, which accumulates within the lysosomal compartment (69, 70). In these studies, KB31 (−Pgp) and KBV1 (+Pgp) cells were preincubated under glucose starvation, serum starvation, or H2O2 stress under normoxia or hypoxia (1 h at 37 °C), followed by a further incubation under similar conditions for 24 h at 37 °C in the presence or absence of Dp44mT (25 μm) or Dp44mT (25 μm) and Ela (0.2 μm). The cells were then washed with serum-free medium and further incubated with AO (20 μm; 12 min at 37 °C), followed by a second wash. Notably, AO accumulates in lysosomes to induce a red lysosomal fluorescence and a weak green cytosolic fluorescence following blue light excitation. The live-cell samples were examined with a Zeiss Axio Observer.Z1 wide-field fluorescence microscope (Zeiss) equipped with FITC and Texas Red filters. Images were captured with an AxioCam camera and AxioVision version 4.7 software (Zeiss).
MTT proliferation assay
Cellular proliferation was examined using the 3-(4,5-dimethylthiazol-2-yl)-5-(3-carboxymethoxyphenyl)-2-(4-sulfophenyl)-2H-tetrazolium (MTT) assay (71). Cells were seeded into 96-well microtiter plates at 3 × 10³ cells/well, which allowed exponential growth for the duration of the assay. The cells were grown overnight, and the agents were then added to give concentrations between 0.2 and 100 μm. For assessing the impact of MDR inhibitors on cellular proliferation, cells were treated with potent Pgp inhibitor, Ela (Sigma-Aldrich; 0.2 μm), which was utilized in conjunction with other test agents for 24 h and 37 °C.
After this incubation, 20 μl of MTT (5 mg/ml; Sigma-Aldrich) in PBS was added to each well, and the plates were incubated for 2 h at 37 °C. The cells were then solubilized by adding 70 μl of DMSO for 60 min at 20 °C while incubating on a shaking incubator, and the plates were read at 570 nm on a VictorTM multilabel counter plate reader (PerkinElmer Life Sciences). The formation of the insoluble purple formazan was directly proportional to the number of viable cells (33). Concentration-response curves were fitted in Prism version 6.0 (GraphPad Software, La Jolla, CA) to obtain IC50 values.
Data analysis
Results were expressed as mean ± S.D. (three experiments). Statistical analysis was performed using Student's t test. Data were considered statistically significant when p < 0.05.
Author contributions
L. A.-A. designed studies, performed studies, analyzed data, and wrote the manuscript. D.-H. B. and S. S. performed studies and analyzed data. K. C. P. and M. L. H. H. analyzed data. D. J. R. L. aided in experimental design, data analysis, and writing of the manuscript. P. J. J. and D. R. R. conceived the idea for the study, designed experiments, analyzed data, and wrote the manuscript.
Supplementary Material
Acknowledgments
We kindly thank Jasmina Paluncic for the acquisition of the confocal microscope photographs in Fig. 7B. We kindly acknowledge the expert assistance of Dr. Louise Cole (Bosch Institute Advanced Microscopy Facility, University of Sydney) regarding confocal microscopy image analysis.
This work was supported by Project Grant 1021607 from the National Health and Medical Research Council (NHMRC) Australia (to D. R. R.), NHMRC Senior Principal Research Fellowship 1062607 (to D. R. R.), Cancer Institute NSW Fellowships (to P. J. J. and D. J. R. L.), a National Breast Cancer Foundation and Avner Pancreatic Cancer Foundation project grant (to D. R. R and P. J. J.), a Prostate Cancer Foundation Australia New Concept Grant (to D. R. R. and D. J. R. L.), and an NHMRC Early Career Fellowship (to M. L. H. H.). D. R. R. is a stakeholder in Oncochel Therapeutics LLC and Pty Ltd, which is developing the thiosemicarbazone, DpC, for the treatment of advanced and resistant cancer.
This article contains Figs. S1–S6.
- MDR
- multidrug resistance
- MTT
- 3-(4,5-dimethylthiazol-2-yl)-2,5-diphenyltetrazolium bromide
- AO
- acridine orange
- DOX
- doxorubicin
- Dp44mT
- di-2-pyridylketone 4,4-dimethyl-3-thiosemicarbazone
- Ela
- elacridar
- HIF-1α
- hypoxia-inducible factor-1α
- LMP
- lysosomal membrane permeabilization
- LAMP2
- lysosome-associated membrane protein 2
- ROS
- reactive oxygen species
- Pgp
- P-glycoprotein
- VBL
- vinblastine
- DAPI
- 4′,6-diamidino-2-phenylindole
- Ab
- antibody.
References
- 1. Germann U. A. (1996) P-glycoprotein: a mediator of multidrug resistance in tumour cells. Eur. J. Cancer 32A, 927–944 [DOI] [PubMed] [Google Scholar]
- 2. Cole S. P., Bhardwaj G., Gerlach J. H., Mackie J. E., Grant C. E., Almquist K. C., Stewart A. J., Kurz E. U., Duncan A. M., and Deeley R. G. (1992) Overexpression of a transporter gene in a multidrug-resistant human lung cancer cell line. Science 258, 1650–1654 10.1126/science.1360704 [DOI] [PubMed] [Google Scholar]
- 3. Seebacher N., Lane D. J., Richardson D. R., and Jansson P. J. (2016) Turning the gun on cancer: utilizing lysosomal P-glycoprotein as a new strategy to overcome multi-drug resistance. Free Radic. Biol. Med. 96, 432–445 10.1016/j.freeradbiomed.2016.04.201 [DOI] [PubMed] [Google Scholar]
- 4. Sharom F. J. (2008) ABC multidrug transporters: structure, function and role in chemoresistance. Pharmacogenomics 9, 105–127 10.2217/14622416.9.1.105 [DOI] [PubMed] [Google Scholar]
- 5. Comerford K. M., Wallace T. J., Karhausen J., Louis N. A., Montalto M. C., and Colgan S. P. (2002) Hypoxia-inducible factor-1-dependent regulation of the multidrug resistance (MDR1) gene. Cancer Res. 62, 3387–3394 [PubMed] [Google Scholar]
- 6. Seebacher N. A., Richardson D. R., and Jansson P. J. (2015) Glucose modulation induces reactive oxygen species and increases Pgp-mediated multidrug-resistance to chemotherapeutics. Br. J. Pharmacol. 172, 2557–2572 10.1111/bph.13079 [DOI] [PMC free article] [PubMed] [Google Scholar]
- 7. Yang G., Xu S., Peng L., Li H., Zhao Y., and Hu Y. (2016) The hypoxia-mimetic agent CoCl2 induces chemotherapy resistance in LOVO colorectal cancer cells. Mol. Med. Rep. 13, 2583–2589 10.3892/mmr.2016.4836 [DOI] [PMC free article] [PubMed] [Google Scholar]
- 8. Denko N. C. (2008) Hypoxia, HIF1 and glucose metabolism in the solid tumour. Nat. Rev. Cancer 8, 705–713 10.1038/nrc2468 [DOI] [PubMed] [Google Scholar]
- 9. Brahimi-Horn M. C., Chiche J., and Pouysségur J. (2007) Hypoxia and cancer. J. Mol. Med. 85, 1301–1307 10.1007/s00109-007-0281-3 [DOI] [PubMed] [Google Scholar]
- 10. McKeown S. R. (2014) Defining normoxia, physoxia and hypoxia in tumours-implications for treatment response. Br. J. Radiol. 87, 20130676 10.1259/bjr.20130676 [DOI] [PMC free article] [PubMed] [Google Scholar]
- 11. Weber C. E., and Kuo P. C. (2012) The tumor microenvironment. Surg. Oncol. 21, 172–177 10.1016/j.suronc.2011.09.001 [DOI] [PubMed] [Google Scholar]
- 12. Cuvier C., Jang A., and Hill R. P. (1997) Exposure to hypoxia, glucose starvation and acidosis: effect on invasive capacity of murine tumor cells and correlation with cathepsin (L + B) secretion. Clin. Exp. Metastasis 15, 19–25 [DOI] [PubMed] [Google Scholar]
- 13. Ziemann C., Bürkle A., Kahl G. F., and Hirsch-Ernst K. I. (1999) Reactive oxygen species participate in mdr1b mRNA and P-glycoprotein overexpression in primary rat hepatocyte cultures. Carcinogenesis 20, 407–414 10.1093/carcin/20.3.407 [DOI] [PubMed] [Google Scholar]
- 14. Yamagishi T., Sahni S., Sharp D. M., Arvind A., Jansson P. J., and Richardson D. R. (2013) P-glycoprotein mediates drug resistance via a novel mechanism involving lysosomal sequestration. J. Biol. Chem. 288, 31761–31771 10.1074/jbc.M113.514091 [DOI] [PMC free article] [PubMed] [Google Scholar]
- 15. Jansson P. J., Yamagishi T., Arvind A., Seebacher N., Gutierrez E., Stacy A., Maleki S., Sharp D., Sahni S., and Richardson D. R. (2015) Di-2-pyridylketone 4,4-dimethyl-3-thiosemicarbazone (Dp44mT) overcomes multidrug resistance by a novel mechanism involving the hijacking of lysosomal P-glycoprotein (Pgp). J. Biol. Chem. 290, 9588–9603 10.1074/jbc.M114.631283 [DOI] [PMC free article] [PubMed] [Google Scholar]
- 16. Seebacher N. A., Lane D. J., Jansson P. J., and Richardson D. R. (2016) Glucose modulation induces lysosome formation and increases lysosomotropic drug sequestration via the P-glycoprotein drug transporter. J. Biol. Chem. 291, 3796–3820 10.1074/jbc.M115.682450 [DOI] [PMC free article] [PubMed] [Google Scholar]
- 17. Stacy A. E., Palanimuthu D., Bernhardt P. V., Kalinowski D. S., Jansson P. J., and Richardson D. R. (2016) Structure-activity relationships of di-2-pyridylketone, 2-benzoylpyridine and 2-acetylpyridine thiosemicarbazones for overcoming Pgp-mediated drug resistance. J. Med. Chem. 59, 8601–8620 10.1021/acs.jmedchem.6b01050 [DOI] [PubMed] [Google Scholar]
- 18. Lovejoy D. B., Jansson P. J., Brunk U. T., Wong J., Ponka P., and Richardson D. R. (2011) Antitumor activity of metal-chelating compound Dp44mT is mediated by formation of a redox-active copper complex that accumulates in lysosomes. Cancer Res. 71, 5871–5880 10.1158/0008-5472.CAN-11-1218 [DOI] [PubMed] [Google Scholar]
- 19. Stacy A. E., Palanimuthu D., Bernhardt P. V., Kalinowski D. S., Jansson P. J., and Richardson D. R. (2016) Zinc(II)-thiosemicarbazone complexes are localized to the lysosomal compartment where they transmetallate with copper ions to induce cytotoxicity. J. Med. Chem. 59, 4965–4984 10.1021/acs.jmedchem.6b00238 [DOI] [PubMed] [Google Scholar]
- 20. Kovacevic Z., Chikhani S., Lovejoy D. B., and Richardson D. R. (2011) Novel thiosemicarbazone iron chelators induce up-regulation and phosphorylation of the metastasis suppressor N-myc down-stream regulated gene 1: a new strategy for the treatment of pancreatic cancer. Mol. Pharmacol. 80, 598–609 10.1124/mol.111.073627 [DOI] [PubMed] [Google Scholar]
- 21. Lovejoy D. B., Sharp D. M., Seebacher N., Obeidy P., Prichard T., Stefani C., Basha M. T., Sharpe P. C., Jansson P. J., Kalinowski D. S., Bernhardt P. V., and Richardson D. R. (2012) Novel second-generation di-2-pyridylketone thiosemicarbazones show synergism with standard chemotherapeutics and demonstrate potent activity against lung cancer xenografts after oral and intravenous administration in vivo. J. Med. Chem. 55, 7230–7244 10.1021/jm300768u [DOI] [PubMed] [Google Scholar]
- 22. Jansson P. J., Kalinowski D. S., Lane D. J., Kovacevic Z., Seebacher N. A., Fouani L., Sahni S., Merlot A. M., and Richardson D. R. (2015) The renaissance of polypharmacology in the development of anti-cancer therapeutics: inhibition of the “Triad of Death” in cancer by di-2-pyridylketone thiosemicarbazones. Pharmacol. Res. 100, 255–260 10.1016/j.phrs.2015.08.013 [DOI] [PubMed] [Google Scholar]
- 23. Kalinowski D. S., Stefani C., Toyokuni S., Ganz T., Anderson G. J., Subramaniam N. V., Trinder D., Olynyk J. K., Chua A., Jansson P. J., Sahni S., Lane D. J., Merlot A. M., Kovacevic Z., Huang M. L., Lee C. S., and Richardson D. R. (2016) Redox cycling metals: pedaling their roles in metabolism and their use in the development of novel therapeutics. Biochim. Biophys. Acta 1863, 727–748 10.1016/j.bbamcr.2016.01.026 [DOI] [PubMed] [Google Scholar]
- 24. Seebacher N. A., Richardson D. R., and Jansson P. J. (2016) A mechanism for overcoming P-glycoprotein-mediated drug resistance: novel combination therapy that releases stored doxorubicin from lysosomes via lysosomal permeabilization using Dp44mT or DpC. Cell Death Dis. 7, e2510 10.1038/cddis.2016.381 [DOI] [PMC free article] [PubMed] [Google Scholar]
- 25. Yeom C. J., Goto Y., Zhu Y., Hiraoka M., and Harada H. (2012) Microenvironments and cellular characteristics in the micro tumor cords of malignant solid tumors. Int. J. Mol. Sci. 13, 13949–13965 10.3390/ijms131113949 [DOI] [PMC free article] [PubMed] [Google Scholar]
- 26. Giampietri C., Petrungaro S., Conti S., Facchiano A., Filippini A., and Ziparo E. (2015) Cancer microenvironment and endoplasmic reticulum stress response. Mediators Inflamm. 2015, 417281 [DOI] [PMC free article] [PubMed] [Google Scholar]
- 27. Endicott J. A., and Ling V. (1989) The biochemistry of P-glycoprotein-mediated multidrug resistance. Annu. Rev. Biochem. 58, 137–171 10.1146/annurev.bi.58.070189.001033 [DOI] [PubMed] [Google Scholar]
- 28. Blagosklonny M. V. (2004) Antiangiogenic therapy and tumor progression. Cancer Cell 5, 13–17 10.1016/S1535-6108(03)00336-2 [DOI] [PubMed] [Google Scholar]
- 29. Murphy L., Henry M., Meleady P., Clynes M., and Keenan J. (2008) Proteomic investigation of taxol and taxotere resistance and invasiveness in a squamous lung carcinoma cell line. Biochim. Biophys. Acta 1784, 1184–1191 10.1016/j.bbapap.2008.04.014 [DOI] [PubMed] [Google Scholar]
- 30. Artal-Sanz M., and Tavernarakis N. (2005) Proteolytic mechanisms in necrotic cell death and neurodegeneration. FEBS Lett. 579, 3287–3296 10.1016/j.febslet.2005.03.052 [DOI] [PubMed] [Google Scholar]
- 31. Brojatsch J., Lima H., Kar A. K., Jacobson L. S., Muehlbauer S. M., Chandran K., and Diaz-Griffero F. (2014) A proteolytic cascade controls lysosome rupture and necrotic cell death mediated by lysosome-destabilizing adjuvants. PLoS One 9, e95032 10.1371/journal.pone.0095032 [DOI] [PMC free article] [PubMed] [Google Scholar]
- 32. Doublier S., Belisario D. C., Polimeni M., Annaratone L., Riganti C., Allia E., Ghigo D., Bosia A., and Sapino A. (2012) HIF-1 activation induces doxorubicin resistance in MCF7 3-D spheroids via P-glycoprotein expression: a potential model of the chemo-resistance of invasive micropapillary carcinoma of the breast. BMC Cancer 12, 4 10.1186/1471-2407-12-4 [DOI] [PMC free article] [PubMed] [Google Scholar]
- 33. Richardson D. R., Tran E. H., and Ponka P. (1995) The potential of iron chelators of the pyridoxal isonicotinoyl hydrazone class as effective antiproliferative agents. Blood 86, 4295–4306 [PubMed] [Google Scholar]
- 34. Gottesman M. M. (2002) Mechanisms of cancer drug resistance. Annu. Rev. Med. 53, 615–627 10.1146/annurev.med.53.082901.103929 [DOI] [PubMed] [Google Scholar]
- 35. Mukherjee S., Ghosh R. N., and Maxfield F. R. (1997) Endocytosis. Physiol. Rev. 77, 759–803 10.1152/physrev.1997.77.3.759 [DOI] [PubMed] [Google Scholar]
- 36. Hu Y.-L., DeLay M., Jahangiri A., Molinaro A. M., Rose S. D., Carbonell W. S., and Aghi M. K. (2012) Hypoxia-induced autophagy promotes tumor cell survival and adaptation to antiangiogenic treatment in glioblastoma. Cancer Res. 72, 1773–1783 10.1158/0008-5472.CAN-11-3831 [DOI] [PMC free article] [PubMed] [Google Scholar]
- 37. Huynh K. K., Eskelinen E. L., Scott C. C., Malevanets A., Saftig P., and Grinstein S. (2007) LAMP proteins are required for fusion of lysosomes with phagosomes. EMBO J. 26, 313–324 10.1038/sj.emboj.7601511 [DOI] [PMC free article] [PubMed] [Google Scholar]
- 38. Paterson J. K., and Gottesman M. M. (2007) P-Glycoprotein is not present in mitochondrial membranes. Exp. Cell Res. 313, 3100–3105 10.1016/j.yexcr.2007.04.019 [DOI] [PMC free article] [PubMed] [Google Scholar]
- 39. Bolte S., and Cordelières F. P. (2006) A guided tour into subcellular colocalization analysis in light microscopy. J. Microsc. 224, 213–232 10.1111/j.1365-2818.2006.01706.x [DOI] [PubMed] [Google Scholar]
- 40. Iacopetta B. J., and Morgan E. H. (1983) The kinetics of transferrin endocytosis and iron uptake from transferrin in rabbit reticulocytes. J. Biol. Chem. 258, 9108–9115 [PubMed] [Google Scholar]
- 41. Karin M., and Mintz B. (1981) Receptor-mediated endocytosis of transferrin in developmentally totipotent mouse teratocarcinoma stem cells. J. Biol. Chem. 256, 3245–3252 [PubMed] [Google Scholar]
- 42. Richardson D. R., Cameron K., Robinson B., and Turner K. J. (1993) The mechanisms of IgE uptake by human alveolar macrophages and a human B-lymphoblastoid cell line (Wil-2wt). Immunology 79, 305–311 [PMC free article] [PubMed] [Google Scholar]
- 43. Zhu Y., Massen S., Terenzio M., Lang V., Chen-Lindner S., Eils R., Novak I., Dikic I., Hamacher-Brady A., and Brady N. R. (2013) Modulation of serines 17 and 24 in the LC3-interacting region of Bnip3 determines pro-survival mitophagy versus apoptosis. J. Biol. Chem. 288, 1099–1113 10.1074/jbc.M112.399345 [DOI] [PMC free article] [PubMed] [Google Scholar]
- 44. Shen F., Chu S., Bence A. K., Bailey B., Xue X., Erickson P. A., Montrose M. H., Beck W. T., and Erickson L. C. (2008) Quantitation of doxorubicin uptake, efflux, and modulation of multidrug resistance (MDR) in MDR human cancer cells. J. Pharmacol. Exp. Ther. 324, 95–102 [DOI] [PubMed] [Google Scholar]
- 45. Akhtar N., Ahad A., Khar R. K., Jaggi M., Aqil M., Iqbal Z., Ahmad F. J., and Talegaonkar S. (2011) The emerging role of P-glycoprotein inhibitors in drug delivery: a patent review. Expert Opin. Ther. Pat. 21, 561–576 10.1517/13543776.2011.561784 [DOI] [PubMed] [Google Scholar]
- 46. Ward K. W., and Azzarano L. M. (2004) Preclinical pharmacokinetic properties of the P-glycoprotein inhibitor GF120918A (HCl salt of GF120918, 9,10-dihydro-5-methoxy-9-oxo-N-[4-[2-(1,2,3,4-tetrahydro-6,7-dimethoxy-2-isoquino linyl)ethyl]phenyl]-4-acridine-carboxamide) in the mouse, rat, dog, and monkey. J. Pharmacol. Exp. Ther. 310, 703–709 10.1124/jpet.104.068288 [DOI] [PubMed] [Google Scholar]
- 47. Hyafil F., Vergely C., Du Vignaud P., and Grand-Perret T. (1993) In vitro and in vivo reversal of multidrug resistance by GF120918, an acridonecarboxamide derivative. Cancer Res. 53, 4595–4602 [PubMed] [Google Scholar]
- 48. Kemper E. M., Verheij M., Boogerd W., Beijnen J. H., and van Tellingen O. (2004) Improved penetration of docetaxel into the brain by co-administration of inhibitors of P-glycoprotein. Eur. J. Cancer 40, 1269–1274 10.1016/j.ejca.2004.01.024 [DOI] [PubMed] [Google Scholar]
- 49. Witz I. P., and Levy-Nissenbaum O. (2006) The tumor microenvironment in the post-PAGET era. Cancer Lett. 242, 1–10 10.1016/j.canlet.2005.12.005 [DOI] [PubMed] [Google Scholar]
- 50. Yu H., Zhou Y., Lind S. E., and Ding W. Q. (2009) Clioquinol targets zinc to lysosomes in human cancer cells. Biochem. J 417, 133–139 10.1042/BJ20081421 [DOI] [PubMed] [Google Scholar]
- 51. Whitnall M., Howard J., Ponka P., and Richardson D. R. (2006) A class of iron chelators with a wide spectrum of potent antitumor activity that overcomes resistance to chemotherapeutics. Proc. Natl. Acad. Sci. U.S.A. 103, 14901–14906 10.1073/pnas.0604979103 [DOI] [PMC free article] [PubMed] [Google Scholar]
- 52. Kues W. A., Anger M., Carnwath J. W., Paul D., Motlik J., and Niemann H. (2000) Cell cycle synchronization of porcine fetal fibroblasts: effects of serum deprivation and reversible cell cycle inhibitors. Biol. Reprod. 62, 412–419 10.1095/biolreprod62.2.412 [DOI] [PubMed] [Google Scholar]
- 53. Higgins C. F. (2007) Multiple molecular mechanisms for multidrug resistance transporters. Nature 446, 749–757 10.1038/nature05630 [DOI] [PubMed] [Google Scholar]
- 54. Keith B., Johnson R. S., and Simon M. C. (2011) HIF1α and HIF2α: sibling rivalry in hypoxic tumour growth and progression. Nat. Rev. Cancer 12, 9–22 [DOI] [PMC free article] [PubMed] [Google Scholar]
- 55. Tanimoto K., Makino Y., Pereira T., and Poellinger L. (2000) Mechanism of regulation of the hypoxia-inducible factor-1α by the von Hippel-Lindau tumor suppressor protein. EMBO J. 19, 4298–4309 10.1093/emboj/19.16.4298 [DOI] [PMC free article] [PubMed] [Google Scholar]
- 56. Nishimoto A., Kugimiya N., Hosoyama T., Enoki T., Li T.-S., and Hamano K. (2014) HIF-1α activation under glucose deprivation plays a central role in the acquisition of anti-apoptosis in human colon cancer cells. Int. J. Oncol. 44, 2077–2084 10.3892/ijo.2014.2367 [DOI] [PubMed] [Google Scholar]
- 57. Settembre C., Fraldi A., Medina D. L., and Ballabio A. (2013) Signals from the lysosome: a control centre for cellular clearance and energy metabolism. Nat. Rev. Mol. Cell Biol. 14, 283–296 10.1038/nrm3565 [DOI] [PMC free article] [PubMed] [Google Scholar]
- 58. Shi L., Ito F., Wang Y., Okazaki Y., Tanaka H., Mizuno M., Hori M., Hirayama T., Nagasawa H., Richardson D. R., and Toyokuni S. (2017) Non-thermal plasma induces a stress response in mesothelioma cells resulting in increased endocytosis, lysosome biogenesis and autophagy. Free Radic. Biol. Med. 108, 904–917 10.1016/j.freeradbiomed.2017.04.368 [DOI] [PubMed] [Google Scholar]
- 59. Rajendran L., Knölker H. J., and Simons K. (2010) Subcellular targeting strategies for drug design and delivery. Nat. Rev. Drug Discov. 9, 29–42 10.1038/nrd2897 [DOI] [PubMed] [Google Scholar]
- 60. Taatjes D. J., and Koch T. H. (2001) Nuclear targeting and retention of anthracycline antitumor drugs in sensitive and resistant tumor cells. Curr. Med. Chem. 8, 15–29 10.2174/0929867013374029 [DOI] [PubMed] [Google Scholar]
- 61. Gottesman M. M., Fojo T., and Bates S. E. (2002) Multidrug resistance in cancer: role of ATP-dependent transporters. Nat. Rev. Cancer 2, 48–58 10.1038/nrc706 [DOI] [PubMed] [Google Scholar]
- 62. Hickok J. R., Sahni S., Shen H., Arvind A., Antoniou C., Fung L. W., and Thomas D. D. (2011) Dinitrosyliron complexes are the most abundant nitric oxide-derived cellular adduct: biological parameters of assembly and disappearance. Free Radic. Biol. Med. 51, 1558–1566 10.1016/j.freeradbiomed.2011.06.030 [DOI] [PMC free article] [PubMed] [Google Scholar]
- 63. Shen D. W., Cardarelli C., Hwang J., Cornwell M., Richert N., Ishii S., Pastan I., and Gottesman M. M. (1986) Multiple drug-resistant human KB carcinoma cells independently selected for high-level resistance to colchicine, adriamycin, or vinblastine show changes in expression of specific proteins. J. Biol. Chem. 261, 7762–7770 [PubMed] [Google Scholar]
- 64. Gao J., and Richardson D. R. (2001) The potential of iron chelators of the pyridoxal isonicotinoyl hydrazone class as effective antiproliferative agents, IV: the mechanisms involved in inhibiting cell-cycle progression. Blood 98, 842–850 10.1182/blood.V98.3.842 [DOI] [PubMed] [Google Scholar]
- 65. Klostermann E., Droste Gen Helling I., Carde J. P., and Schünemann D. (2002) The thylakoid membrane protein ALB3 associates with the cpSecY-translocase in Arabidopsis thaliana. Biochem. J 368, 777–781 10.1042/bj20021291 [DOI] [PMC free article] [PubMed] [Google Scholar]
- 66. Brown J. P., Nishiyama K., Hellström I., and Hellström K. E. (1981) Structural characterization of human melanoma-associated antigen p97 with monoclonal antibodies. J. Immunol. 127, 539–546 [PubMed] [Google Scholar]
- 67. Kim H., Barroso M., Samanta R., Greenberger L., and Sztul E. (1997) Experimentally induced changes in the endocytic traffic of P-glycoprotein alter drug resistance of cancer cells. Am. J. Physiol. 273, C687–C702 10.1152/ajpcell.1997.273.2.C687 [DOI] [PubMed] [Google Scholar]
- 68. Burgess A., Vigneron S., Brioudes E., Labbé J. C., Lorca T., and Castro A. (2010) Loss of human Greatwall results in G2 arrest and multiple mitotic defects due to deregulation of the cyclin B-Cdc2/PP2A balance. Proc. Natl. Acad. Sci. U.S.A. 107, 12564–12569 10.1073/pnas.0914191107 [DOI] [PMC free article] [PubMed] [Google Scholar]
- 69. Hwang J. J., Lee S. J., Kim T. Y., Cho J. H., and Koh J. Y. (2008) Zinc and 4-hydroxy-2-nonenal mediate lysosomal membrane permeabilization induced by H2O2 in cultured hippocampal neurons. J. Neurosci. 28, 3114–3122 10.1523/JNEUROSCI.0199-08.2008 [DOI] [PMC free article] [PubMed] [Google Scholar]
- 70. Boya P., and Kroemer G. (2008) Lysosomal membrane permeabilization in cell death. Oncogene 27, 6434–6451 10.1038/onc.2008.310 [DOI] [PubMed] [Google Scholar]
- 71. Mosmann T. (1983) Rapid colorimetric assay for cellular growth and survival: application to proliferation and cytotoxicity assays. J. Immunol. Methods 65, 55–63 10.1016/0022-1759(83)90303-4 [DOI] [PubMed] [Google Scholar]
Associated Data
This section collects any data citations, data availability statements, or supplementary materials included in this article.