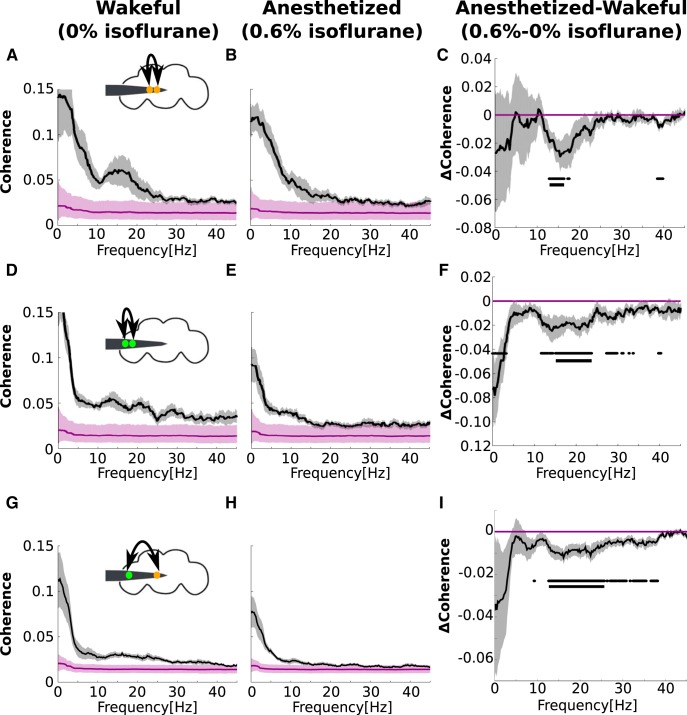
Figure 3.
The effect of isoflurane on center, periphery, and center-periphery coherence. A, Coherence between electrodes in the central brain in 0% isoflurane (black line). Gray shades represent SEM across flies (N = 13). Purple line and shades represents the bias level and its 95% confidence intervals. A schematic representation of the fly head and inserted electrode showing the estimated positions of two central channels is depicted above. B, Same as a in 0.6% isoflurane. C, The effect of isoflurane on center coherence, obtained by subtracting values in 0% isoflurane from values in 0.6% isoflurane. Dots and solid lines below the effect of isoflurane (C, F, I) indicate significant reductions (p < 0.05) uncorrected and corrected, respectively, for multiple comparisons. The same format is repeated in D–F for within-periphery coherence and G–I for center-periphery coherence.

