Abstract
Supramolecular complexes of a family of positively charged conjugated polymers (CPs) and green fluorescent protein (GFP) create a fluorescence resonance energy transfer (FRET)-based ratiometric biosensor array. Selective multivalent interactions of the CPs with mammalian cell surfaces caused differential change in FRET signals, providing a fingerprint signature for each cell type. The resulting fluorescence signatures allowed the identification of sixteen different cell types and discrimination between healthy, cancerous, and metastatic cells, with the same genetic background. While the CP-GFP sensor array completely differentiated between the cell types, only partial classification was achieved for the CPs alone, validating the effectiveness of the ratiometric sensor. The utility of the biosensor was further demonstrated in the detection of blinded unknown samples, where 121 of 128 samples were correctly identified. Notably, this selectivity-based sensor stratified diverse cell types in minutes, using only 2000 cells, without requiring specific biomarkers or cell labelling.
Graphical abstract
INTRODUCTION
Combating cancer demands fast and efficient detection and monitoring of the disease progress. A generalized approach for identifying different cancer types and states is achieved by profiling their genomic,1 transcriptomic,2 proteomic,3 and metabolomic4 signatures that provide a reliable correlation between the healthy and disease state. In addition to identifying cancers and their subtypes, profiling molecular signatures of a cell type allows prediction of potential neoplastic transformation of normal cells or benign tumors,5 enabling the personalized screening of disease states. Notably, these signature-based approaches identify wide varieties of cancer types, overcoming limitations of traditional specific biomarker-based methods such as the lack of appropriate markers for every cancer type and false positive diagnosis.6 While specific intracellular signatures are promising for cancer cell detection, phenotypic signatures of cell surfaces7 enable construction of a rapid, simple, and generic diagnostic tool for identifying cell types and their states. The surface signature-based sensing method applies to any cell type and makes additional processing steps to extract the genetic materials, proteins, glycoproteins, or other biomarkers unnecessary.
Differential sensor arrays featuring cross-reactive receptors provide an ideal platform for surface phenotype-based mammalian cell detection. The differential sensing methods (also called “chemical nose/tongue”) create a unique response signature for each analyte through differential receptor-analyte binding interactions, allowing them to be ‘trained’ to identify diverse analytes both individually and in mixtures.8 The signature-based strategy is a powerful technique for the detection of bioanalytes including amino acids,9 carbohydrates,10 proteins,11 and bacteria.12 Likewise, biosensor arrays with non-ratiometric sensor responses have been developed for profiling cell-surface signatures, enabling identification of a few different mammalian cell types.13 We envisage that a generalized biosensor array with ratiometric output, high sensitivity, and minimum number of sensor elements would provide robust and universal cell diagnostics.
Thanks to their easily tailorable multivalent functionalities and excellent light harvesting properties, water-soluble conjugated polymers offer an excellent scaffold for cell surface-based biosensor design.14 Unlike small-molecule fluorophores, the delocalized electronic structure of CP backbones with large numbers of light absorbing units allows efficient intra- and inter-chain energy transfer that amplifies the signal of acceptors.15 Moreover, their optical properties (e.g. absorption and emission) are sensitive to conformational or environmental changes, enabling sensitive detection of the subtle differences between analytes.15,16 A key feature of CPs containing pendant charged functional groups is their ability to form supramolecular complexes with charge complementary macromolecules, producing fluorescence quenching or fluorescence resonance energy transfer (FRET). Using the FRET modulation mechanism, CPs have provided simple, sensitive, and ratiometric platforms for detecting bioanalytes17 including nucleic acids,18 proteins,19 glycans,20 and bacteria.21 While functionalized CPs have demonstrated cell recognition abilities,22, 23 utilizing them in FRET-based cell sensing platforms could be instrumental in increasing the sensitivity and minimizing the common interferences in the conventional cell sensing methods, caused by the sample heterogeneity (cell morphology, and size) and phenotypic diversity.
Herein, we introduce a new biosensor using supramolecular conjugates of CP-green fluorescent protein (GFP) that provides a universal platform for the rapid (within minutes) and sensitive (only ~2000 cells) identification of diverse mammalian cell types utilizing their ‘fingerprint’ surface phenotypes. The key feature of this biosensor is the cell binding-mediated generation of a ratiometric response that cancels out experimental factors such as the sample variability, total sensor concentration, and instrument variation; we completely differentiate sixteen different cell types with healthy/tumorigenic/metastatic states. Moreover, emission ratioing to estimate the FRET response increases the reproducibility and reliability of detection, a major requirement for non-specific array-based sensors. Notably, this ratiometric sensor array not only works significantly better than the quenching-based non-ratiometric CP array, its ability to profile diverse cell types with challenging features such as isogenic origin, difference in metastatic potency, and subtle variation in glycosylation patterns based on cell-surface features makes it a generalized cell detection toolkit.
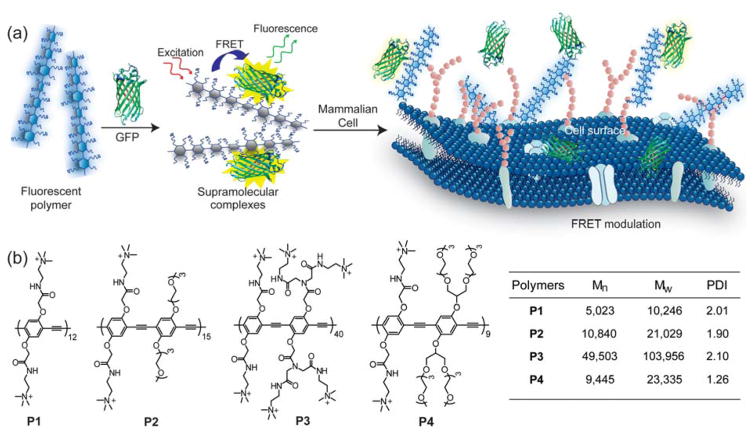
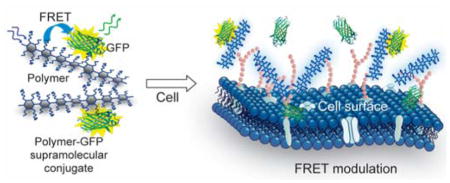
The underlying principle of mammalian cell sensing by our CP-based ratiometric biosensor is illustrated schematically in Figure 1. Herein, assembly of cationic CPs with charge complementary GFP produces supramolecular assemblies that exhibit FRET processes, where the polymers and GFP act as the donor and acceptor, respectively. Multivalent binding of the polymers with cell surfaces modulates the FRET signal of the CP-GFP complexes, and provides a direct transduction of the binding events. The differential interactions between the polymers and cell surface functionalities (such as proteins, lipids, and glycans) generate changes in FRET responses that are characteristic of a cell type. Subsequently, chemometric analysis on such responses creates reference patterns for different cells (“training set”) that identify unknown samples (“test set”).
Figure 1. Schematic illustration of FRET-based cell sensing using CP-GFP complexes.
(a) The polymers and GFP form supramolecular complexes through electrostatic interactions, giving rise to FRET responses that are modulated when the complexes interact with cell surface. (b) Chemical structures and characteristics of the cationic CPs used in the study. Mn: number average molecular weight; Mw: weight average molecular weight; PDI: polydispersity index.
RESULTS AND DISCUSSION
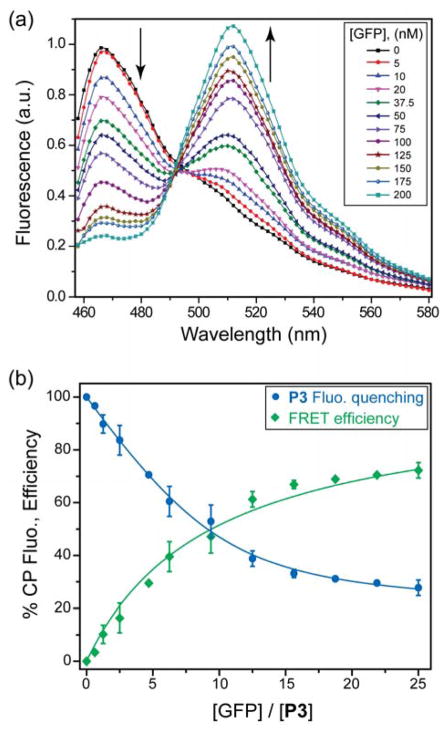
We constructed four supramolecular FRET pairs using GFP and water-soluble functionalized CPs. Unlike small molecule fluorophores, the chromophore in GFP is protected inside a robust beta barrel protein structure,24 providing excellent fluorescence properties including high photostability. Another advantage of using GFP as a fluorophore is its strong electrostatic interactions with cationic molecules, owing to net negative charges under the experimental buffer conditions (pH 7.4) (Table S2). On the other hand, the ease of functionalization of the CP backbone made it possible to synthesize poly(p-phenyleneethynylene)s P1 – P4 (Figure 1b) with tailored cationic charge densities and degrees of polymerization25 that are expected to display differential binding with GFP. These CPs were selected for the cell sensing assay based on previous studies that demonstrated their effectiveness in profiling cells through differential binding.23 We estimated the overlap integral (Table S3) between the emission spectra of the CPs and the absorption spectrum of GFP (Figure S2) that satisfied the requirement26 for FRET. Therefore, upon excitation at the P1 – P4 absorbance band of 430 nm, the CP-GFP supramolecular complexes exhibit efficient FRET from the CPs to GFP (Figure 2a and S3), with decreased fluorescence emission at 466 nm and sensitized emission at 510 nm. The results for the spectral overlap integral (J), Förster distance (R0), maximum energy transfer efficiency (Emax), and donor-acceptor separation distance (R) are summarized in Table S3. The short separation distance among all the FRET pairs indicates good supramolecular affinity between the CPs and GFP.
Figure 2. FRET between CPs and GFP.
(a) Emission spectra as a function of GFP concentration for the P3-GFP pair. [P3] = 8 nM; 5 mM sodium phosphate buffer. (b) Quenching of P3 fluorescence (blue circles) and the corresponding FRET efficiency (green squares) as a function of the increasing GFP concentration. Each value is the average of three independent measurements and the error bars are the ± standard deviations (SD). Solid lines represent the best-fitted curves, where the blue line is obtained from fitting the binding equation based on the model of single set of identical binding sites and the green line is obtained through fitting the Förster equation (See SI).
To develop the sensing arrays, we determined the ratio of CP and GFP that corresponds to maximum FRET efficiency as estimated from the polymer fluorescence loss27 (Figure 2b and S4). Fitting of the titration data (Figure 2b and S5) revealed differential affinities (Table S4) between the four CPs and GFP, indicating the possibility of selectivity-based sensing. Fluorescence titration with P5 (Figure S1 and S3), the negative control, demonstrates that the primary interaction between polymer and GFP is electrostatic. Once the optimal CP-GFP ratio was determined, we prepared the sensors by mixing appropriate stoichiometry of polymer and GFP, and tested the ability of this sensor array to detect mammalian cells using ratiometric emissions. Titration of the CP-GFP complexes with different concentrations of cell suspensions showed a stable and differentiable change in FRET response with as few as 2000 cells. Using the initial linear slope, a calibration curve of cell concentration-dependent FRET responses (such as Figure S6) would allow quantitative detection of cells within the limited dynamic range.
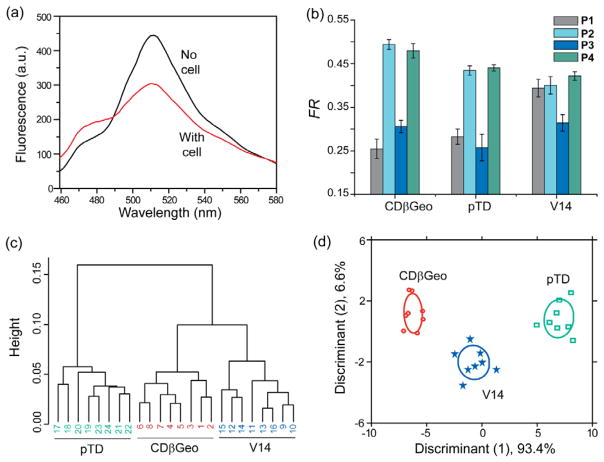
As a robust starting point for mammalian cell sensing, we sought to differentiate between genetically identical (isogenic) cells with healthy and cancerous states. In sensor development, the differentiation of isogenic cells presents a particularly challenging task for signature-based sensors owing to the lack of cell-surface phenotypic differences that arise from genetic diversities. Therefore, the isogenic cells provide ideal targets for sensor validation. We tested three murine cell lines obtained from the mammary fat pads of BALB/c mice as the reliable isogenic targets: CDβGeo, pTD, and V14 that are respectively normal, cancerous, and metastatic cell types28 (Table 1). Incubation of the cells with the CP-GFP complexes caused a decrease in sensitized GFP fluorescence and an increase in polymer fluorescence (Figure 3a), indicating dissociation of the complexes by the competitive binding of the cationic polymers with cells leading to FRET inhibition. Additionally, polymer fluorescence is quenched due to aggregation of polymers on cell surfaces23 (Figure S7) that depends on the polymer as well as interacting cell types. The relative changes in FRET responses were quantified by FR, as defined in equation (1):
| (1) |
where, FRET and FRET0 are the ratio of emission intensities at 510 nm to 466 nm with and without cells, respectively. We observed distinct differences in FRET response patterns from the four independent polymer-GFP dyads for each cell line (Figure 3b), indicating differential interaction of the polymers and cell surfaces. Hierarchical clustering analysis (HCA) of the FRET responses produced three distinct branches (Figure 3c), each corresponding to a cell type. The distinct and characteristic responses for each cell type demonstrate the sensitivity and selectivity of the CP-GFP sensor to cell surface functionalities, indicating effective FRET response-based fingerprinting of cell types/states.
Table 1.
Features of the isogenic murine and human cell lines with their cell status.
| Cell line | Tissue origin | Cell status |
|---|---|---|
| CDβGeo | Breast | Normal immortalized |
| pTD | Breast | Tumorigenic |
| V14 | Breast | Metastatic |
|
| ||
| NCI-H1299 (parental) | Lung | Metastatic |
| Subline-1 | Adrenal | Highly metastatic |
| Subline-2 | Bone | Highly metastatic |
| Subline-5 | Ovary | Highly metastatic |
Figure 3. Detection of isogenic murine cells at different states.
(a) Initial fluorescence spectrum (red) of the P2-GFP complex and final spectrum upon incubation with CDβGeo cells. (b) Change in FRET responses (FR) from the CP-GFP complexes upon interacting with the isogenic murine breast cell types, where each value is the average of eight independent measurements and the error bars are the ± SD. (c) Clustering analysis of the FRET responses. Hierarchical clustering was performed on the raw data set (3 cell lines × 8 replicates × 4 CP-GFP complexes) using a correlation metric and average linkage. (d) LDA score plot of the FRET responses. The analysis resulted in canonical scores with two discriminants explaining 93.4%, and 6.6% of total variance and was plotted with 95% confidence ellipses around the centroid of each group.
Given the multidimensional nature of the sensor output, it is essential to reduce the dimensionality of the data sets for identifying the patterns and trends among the analytes, and establishing a quantitative classifier to identify unknown samples. For this purpose, we employed linear discriminant analysis (LDA),29 a supervised statistical method that maximizes the ratio of between- vs within-class variation. Separation between data points on an LDA plot demonstrates the differences between them. LDA on the above FRET data set (3 isogenic cell lines × 8 replicates × 4 CP-GFP complexes) resulted in two canonical factors explaining the total variance. A score plot constructed using the canonical factors produced three non-overlapping clusters corresponding to the three cell lines (Figure 3d), indicating excellent discriminatory capacity of the method. To assess the reliability of the LDA method in correctly classifying sample observations, leave-one-out cross-validation analysis was performed on all the response data. The jackknifed analysis (a leave-one-out exercise on LDA) on the data set revealed 100% cross-validation accuracy (Figure S8a), demonstrating the LDA method to be a robust statistical tool for this system. Furthermore, the Wilks lambda parameter for the training set was derived to be 0.009 (F = 44.8, P = 0.0000), the small value of which supports LDA to be a strong model for the present analyses. Overall, the differential interaction of the sensor combined with the robust statistical analysis suggests the feasibility of FRET response-based identification of diverse types of mammalian cells in a rapid, sensitive, and label-free manner.
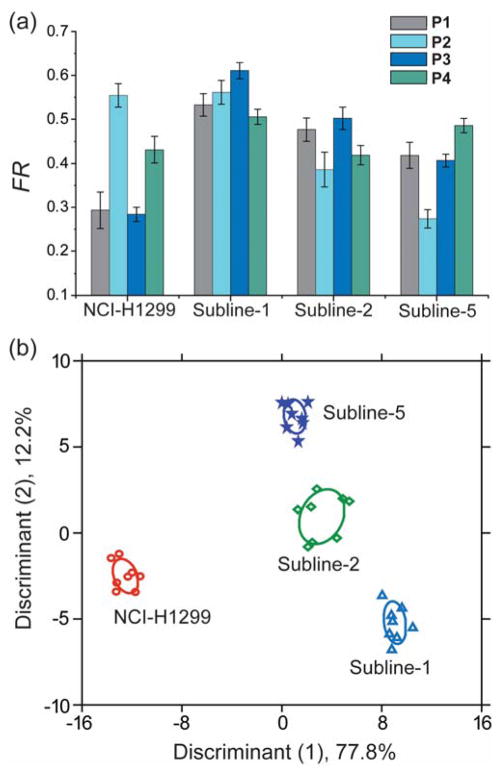
We tested the generality of the CP-GFP sensor using another set of isogenic human cell lines: NCI-H1299, a non-small cell lung cancer (NSCLC) line, and three derived anatomical site-specific metastatic cell lines (subines) with different metastatic propensity. Site-specific metastasis is an important factor in determining cancer progression and therapeutic treatments. We established three metastatic sublines (Table 1) using cells isolated from metastatic lesions in the adrenal gland, bone, and ovary that developed following arterial (intra-cardiac) inoculation of human NCI-H1299 cells in mice.30, 31 Multiple passages in tissue culture and cell sorting provided pure populations of the metastatic sublines. These three sublines exhibited significantly enhanced metastatic capacity as well as variable degrees of tissue tropism. We evaluated the in vitro cultured parental NCI-H1299 cell line and the sublines using the CP-GFP sensor array. The FRET response patterns from these cells (Figure 4a) were found to be distinct, and characteristic of each cell type. Analysis of the ratiometric FRET responses by LDA resulted in three canonical discriminants (77.8%, 12.2%, and 2.0%), with the two most significant discriminants plotted in Figure 4b. Significantly, the different cell types clustered into four non-overlapping groups, with 100% cross-validation accuracy (Figure S8b). These results validate the ability of the sensor to discriminate between the parental cancerous line and the metastasis-derived sublines, as well as between site-specific metastasis (adrenal, bone, and ovary) based on the cell-surface phenotypic variations.
Figure 4. Detection of murine isogenic site-specific metastatic cells.
(a) Change in FRET responses (FR) from the polymer-GFP complexes upon interacting with the four murine metastatic cell types, where each value is the average of six independent measurements and the error bars are the ± SD. (b) LDA score plot of the fluorescence responses. The analysis resulted in canonical scores with three discriminants explaining 77.8%, 12.2%, and 2.0% of total variance and was plotted with 95% confidence ellipses around the centroid of each group.
The versatility of the CP-GFP array sensor was further demonstrated through the detection of (non-isogenic) human cell types with different cell states. One normal breast cell line MCF10A and four cancer cell lines were used in this study (Table S5). The cancer cell lines comprised: HeLa (cervical adenocarcinoma) and HepG2 (hepatocellular carcinoma), derived from primary tissue sites; and MCF7 (breast adenocarcinoma) and NT2/D1 (embryonal carcinoma), derived from metastatic sites and containing metastatic features. These healthy, cancerous, and metastatic cell types were clustered into five respective groups through LDA on the FRET responses (Figure S9), with 100% cross-validated accuracy (Figure S8c). In all, the simple biosensor is a generic mammalian cell sensor, highlighting that the molecular interaction of the CP-GFP complexes with the cell surface provides characteristic signatures for each mammalian cell type.
After validating the sensing platform, we focused on differentially glycosylated cell lines to investigate the effect of glycome structure on the ratiometric FRET response patterns, as the mammalian cell surfaces are covered with dense layers of glycans that largely regulate the extracellular biochemical interactions. Given the electrostatic basis of the sensor, we tested isogenic glycosaminoglycan (GAG)-modified cell lines that provide a robust testbed to validate the interaction of the polymers with cell-specific glycans as a sensing mechanism.32 We studied a wild-type and GAG-mutant Chinese hamster ovary (CHO) cell lines (Table 2) that are benign or tumorigenic depending on the proteoglycan composition of the cell surface.33 For example, mutant CHO cell types defective in the synthesis of heparan sulfate (HS) proteoglycans do not form tumors, whereas mutants with altered chondroitin sulfate proteoglycans are tumorigenic.33a
Table 2.
Features of the Chinese hamster ovary cell lines used in the current studies.
| Cell line | Features of the cell lines | Cell status |
|---|---|---|
| CHO-K1 | Wild-type epithelial-like; derived as a subclone from the parental CHO cells | Tumorigenic |
| pgsA-745 | CHO-K1-dervied cells deficient in proteoglycans (~8% of the parental cells) | Non-tumorigenic |
| pgsB-618 | CHO- K1-dervied cells deficient in proteoglycans (~15% of the parental cells) | Tumorigenic |
| pgsD-677 | CHO- K1-dervied cells deficient in heparin sulfate; 3–4 fold higher chondroitin sulfate than CHO-K1 cells | Non-tumorigenic |
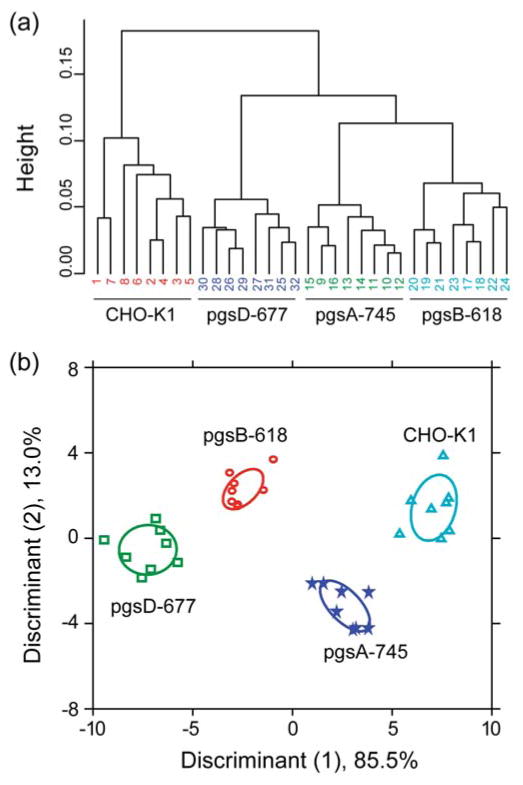
Upon addition of the CHO cell variants to the CP-GFP sensor array, differential FRET responses were observed for the wild-type and glyco-engineered cell lines (Figure S10). Unsupervised HCA was performed on the FRET responses to visualize the relation between the wild-type and the glycomutated cells. It is readily observed that the glyco-engineered cells with diminished GAGs are classified into different branches in the dendrogram than the wild-type cells (Figure 5a), indicating the major contribution of proteoglycans in generating the sensor responses. Together with other reports on cationic polyelectrolytes,32,34 this study provides an insight into the central role of proteoglycans in controlling the polymer-cell interactions. Furthermore, we employed LDA on the FRET responses that classified the 32 sample observations (4 cell lines × 8 replicates) into four quantifiably distinct clusters (Figure 5b) with 100% cross-validation accuracy (Figures S8d), demonstrating their effective classification. Therefore, subtle variation in GAG composition on the cell surfaces can be reliably distinguished by the FRET sensor system, providing a useful tool for glycan biomarker-based cancer detection.
Figure 5. Sensing of isogenic glycan-engineered cell types.
(a) Clustering analysis of the FRET responses obtained from the four CHO cell types. Hierarchical clustering was performed on the FR values (4 CHO cell lines × 8 replicates × 4 CP-GFP complexes) using a correlation metric and average linkage. The numbers at the bottom correspond to the replicates. (b) LDA score plot of the FRET responses. The analysis resulted in canonical scores with three discriminants explaining 85.5%, 13.0%, and 1.5% of total variance and is plotted with 95% confidence ellipses around the centroid of each group.
After demonstrating the selective polymer-cell surface interaction for differentiating between diverse cell types, we assessed the importance of each CP in generating the differential FRET responses for each cell type. Analysis of the FRET responses from all the sixteen cell lines revealed that each of the four CPs significantly contributes to the overall sensing capabilities (see the discussion on contribution of each CP in the Supporting Information). In addition, correlation (Pearson’s) of the canonical scores with FRET responses from each CP (Figure S11) validated the involvement of the four polymer-GFP dyads in the effective classification. Moreover, we evaluated the usefulness of the ratiometric FRET signals in cell detection compared to the fluorescence quenching of the CPs on cell surfaces by incubating the polymers (P1 – P4) alone with the glyco-mutant cells. The resulting fluorescence quenching patterns were subjected to LDA that produced overlapped clusters with 63% cross-validated accuracy (Figure S13). Likewise, the metastatic sublines could be differentiated only with 72% accuracy. Therefore, the ratiometric CP-GFP sensor has a synergistic advantage over the polymers themselves.
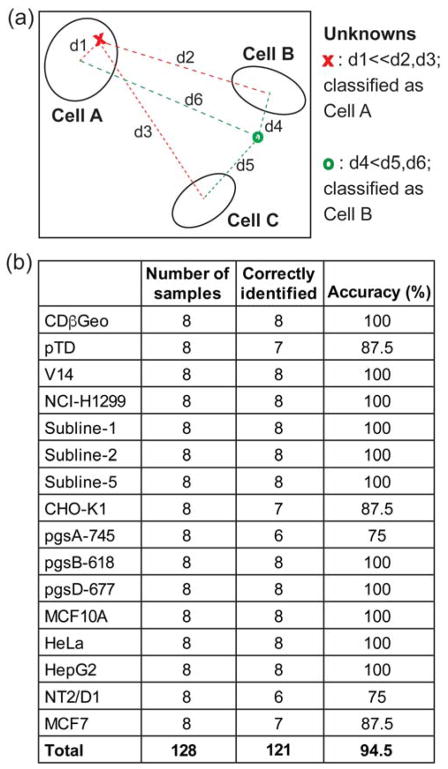
A key requirement for diagnostic applications of the signature-based detection tools is the ability to identify unknown samples. Building upon the training sets that we established by the LDA clustering above, we performed tests on a randomised set of 128 unknown samples prepared from these cells. The unknowns were blinded during the measurements and analysis. An algorithm was used in LDA to compute the Mahalanobis squared distance between the test samples and each cell type within the corresponding training set. The test samples were classified to the cell type for which the distance was minimal (Figure 6a). Using this approach, 121 of the 128 unknowns were correctly identified with a 94.5% accuracy (Figure 6b and Table S10 – S13), validating the reliability of the sensor in detecting cells and the robustness of LDA clustering methodology.
Figure 6. Identification of unknown samples.
(a) Schematic of unknown detection using LDA, where d is the squared Mahalanobis distance. (b) Result of unknown detection using a LDA algorithm (see SI methods section S13).
The above results demonstrate that fluorescence signatures of polymer-cell interactions enable efficient differentiation and identification of diverse healthy and cancerous cell types, making the sensor useful in cancer diagnostics. However, applications of the sensing approach in clinical settings including real-time identification of an unknown cell type (outside the training set) would rely on its ability to predict the cell status from the known training set. Analysis of the above experimental results together with previous reports30,35 on selectivity-based cell sensors indicates a clear demarcation between normal and diseased cells/tissues, suggesting the feasibility of discernible patterns of healthy and malignant cells. In addition, construction of a global database of fluorescence fingerprints of a large number of healthy and cancer cells would ensure accurate and rapid identification of malignancies at different stages. Development of diverse polymer structures, enhancement of sensor-analyte selectivity, and evaluation of appropriate statistical methods for large data analysis would likely constitute the next steps to realize the broader applicability of the fingerprinting approach in clinical biodiagnostics.
CONCLUSIONS
In summary, we have developed an efficient and highly sensitive ratiometric sensor array using CP-GFP supramolecular complexes and demonstrated its utility in identifying mammalian cells in minutes. The biosensor benefits from the high fluorescence sensitivity as well as signal amplification effects of the CPs, and the strong affinity of the macromolecular fluorophore GFP to CP with efficient FRET capability, enabling sensitive and reliable identification of sixteen different cell types. Notably, isogenic healthy, cancerous, and metastatic cells that possess the same genetic background were readily discerned using only four CP-GFP dyads, requiring only 2000 cells. The sensor array detect the overall molecular differences on the cell surfaces; importantly, its ability to differentiate between isogenic cells differing in glycosylation patterns opens up new opportunities for cancer diagnostics using glycan biomarkers. Given the ratiometric nature, these systems have the potential to study disease state-dependent biophysical changes on cell surfaces that would not depend on sampling. Furthermore, the availability of polymers in a variety of colors arising from backbone and side-chain modifications,36 and a range of fluorescent proteins,37 should enable fabrication of multichannel sensors, allowing one-well detection32,38 of bioanalytes in a ratiometric and multiplexed format. Taken together, this first ever ratiometric sensor array for mammalian cell holds great promise for profiling benign and cancer cells, personalized screening of disease states, creating cellular imaging agents, and cell-based high-throughput screening of therapeutics.
Supplementary Material
Acknowledgments
V.M.R. acknowledges support from the NIH (GM077173), F.R.J. from the Canadian Cancer Society Research Institute with funds raised by the Canadian Cancer Society, and S.R. from Marie Curie International Incoming Fellowship by the European Commission (PIIF-GA-2013-629218). We are thankful to Dr. D. Joseph Jerry and Dr. R. Thomas Zoeller for providing CDβGeo, pTD, V14, and NT2/D1 cell lines. We thank Dr. Margaret N. Holme for providing useful suggestions on the manuscript. We thank Dr. Ikbum Kim, Dr. Ronnie Lee Phillips and Dr. Iqing Wang for the preparation of the conjugated cationic polymers.
Footnotes
Notes
The authors declare no competing financial interest.
The Supporting Information is available free of charge on the ACS Publications website at DOI:
Materials used, experimental methods, statistical analysis, discussion on the role of each CP in the sensing process, unknown identification, supporting figures, supporting tables, and data
References
- 1.(a) Kandoth C, McLellan MD, Vandin F, Ye K, Niu B, Lu C, Xie M, Zhang Q, McMichael JF, Wyczalkowski MA, Leiserson MDM, Miller CA, Welch JS, Walter MJ, Wendl MC, Ley TJ, Wilson RK, Raphael BJ, Ding L. Nature. 2013;502:333. doi: 10.1038/nature12634. [DOI] [PMC free article] [PubMed] [Google Scholar]; (b) Alexandrov LB, Nik-Zainal S, Wedge DC, Aparicio SAJR, Behjati S, Biankin AV, Bignell GR, Bolli N, Borg A, Borresen-Dale A-L, Boyault S, Burkhardt B, Butler AP, Caldas C, Davies HR, Desmedt C, Eils R, Eyfjord JE, Foekens JA, Greaves M, Hosoda F, Hutter B, Ilicic T, Imbeaud S, Imielinsk M, Jager N, Jones DTW, Jones D, Knappskog S, Kool M, Lakhani SR, Lopez-Otin C, Martin S, Munshi NC, Nakamura H, Northcott PA, Pajic M, Papaemmanuil E, Paradiso A, Pearson JV, Puente XS, Raine K, Ramakrishna M, Richardson AL, Richter J, Rosenstiel P, Schlesner M, Schumacher TN, Span PN, Teague JW, Totoki Y, Tutt ANJ, Valdes-Mas R, van Buuren MM, van’t Veer L, Vincent-Salomon A, Waddell N, Yates LR, Zucman-Rossi J, Andrew Futreal P, McDermott U, Lichter P, Meyerson M, Grimmond SM, Siebert R, Campo E, Shibata T, Pfister SM, Campbell PJ, Stratton MR Australian Pancreatic Cancer Genome I, Consortium IBC, Consortium IM-S, PedBrain I. Nature. 2013;500:415. [Google Scholar]; (c) Gevaert O, De Moor B. Expert Opin Med Diagn. 2009;3:157. doi: 10.1517/17530050802680172. [DOI] [PubMed] [Google Scholar]
- 2.(a) Peng L, Bian XW, Li DK, Xu C, Wang GM, Xia QY, Xiong Q. Sci Rep. 2015;5:13413. doi: 10.1038/srep13413. [DOI] [PMC free article] [PubMed] [Google Scholar]; (b) Fu JJ, Jeffrey SS. Mol BioSyst. 2007;3:466. doi: 10.1039/b618163e. [DOI] [PubMed] [Google Scholar]
- 3.(a) Wulfkuhle JD, Liotta LA, Petricoin EF. Nat Rev Cancer. 2003;3:267. doi: 10.1038/nrc1043. [DOI] [PubMed] [Google Scholar]; (b) Hanash S, Taguchi A. Nat Rev Cancer. 2010;10:652. doi: 10.1038/nrc2918. [DOI] [PubMed] [Google Scholar]
- 4.(a) Griffin JL, Shockcor JP. Nat Rev Cancer. 2004;4:551. doi: 10.1038/nrc1390. [DOI] [PubMed] [Google Scholar]; (b) Lu X, Bennet B, Mu E, Rabinowitz J, Kang Y. J Biol Chem. 2010;285:9317. doi: 10.1074/jbc.C110.104448. [DOI] [PMC free article] [PubMed] [Google Scholar]
- 5.(a) Wilhelm T. BMC Bioinformatics. 2014;15:193. doi: 10.1186/1471-2105-15-193. [DOI] [PMC free article] [PubMed] [Google Scholar]; (b) Szafranska AE, Davison TS, John J, Cannon T, Sipos B, Maghnouj A, Labourier E, Hahn SA. Oncogene. 2007;26:4442. doi: 10.1038/sj.onc.1210228. [DOI] [PubMed] [Google Scholar]; (c) Oakman C, Tenori L, Biganzoli L, Santarpia L, Cappadona S, Luchinat C, Di Leo A. Int J Biochem Cell Biol. 2011;43:1010. doi: 10.1016/j.biocel.2010.05.001. [DOI] [PubMed] [Google Scholar]
- 6.(a) Duffy MJ. Crit Rev Clin Lab Sci. 2001;38:225. doi: 10.1080/20014091084218. [DOI] [PubMed] [Google Scholar]; (b) Sanchez-Carbayo M. Clin Chem. 2006;52:1651. doi: 10.1373/clinchem.2005.059592. [DOI] [PubMed] [Google Scholar]
- 7.(a) Emmelot P. Eur J Cancer. 1973;9:319. doi: 10.1016/0014-2964(73)90047-9. [DOI] [PubMed] [Google Scholar]; (b) Iyer S, Gaikwad RM, Subba-Rao V, Woodworth CD, Sokolov I. Nat Nanotechnol. 2009;4:389. doi: 10.1038/nnano.2009.77. [DOI] [PMC free article] [PubMed] [Google Scholar]; (c) Hollingsworth MA, Swanson BJ. Nat Rev Cancer. 2004;4:45. doi: 10.1038/nrc1251. [DOI] [PubMed] [Google Scholar]; (d) Dermer GB. Cancer Res. 1973;33:999. [PubMed] [Google Scholar]
- 8.Wright AT, Zhong Z, Anslyn EV. Angew Chem Int Ed. 2005;44:5679. doi: 10.1002/anie.200501437. [DOI] [PubMed] [Google Scholar]
- 9.(a) Curey TE, Goodey A, Tsao A, Lavigne J, Sohn Y, McDevitt JT, Anslyn EV, Neikirk D, Shear JB. Anal Biochem. 2001;293:178. doi: 10.1006/abio.2001.5114. [DOI] [PubMed] [Google Scholar]; (b) Buryak A, Severin K. J Am Chem Soc. 2005;127:3700. doi: 10.1021/ja042363v. [DOI] [PubMed] [Google Scholar]; (c) Folmer-Andersen JF, Kitamura M, Anslyn EV. J Am Chem Soc. 2006;128:5652. doi: 10.1021/ja061313i. [DOI] [PubMed] [Google Scholar]
- 10.(a) Lee JW, Lee JS, Chang YT. Angew Chem Intl Ed. 2006;45:6485. doi: 10.1002/anie.200602055. [DOI] [PubMed] [Google Scholar]; (b) Edwards NY, Sager TW, McDevitt JT, Anslyn EV. J Am Chem Soc. 2007;129:13575. doi: 10.1021/ja073939u. [DOI] [PubMed] [Google Scholar]
- 11.(a) Wright AT, Griffin MJ, Zhong ZL, McCleskey SC, Anslyn EV, McDevitt JT. Angew Chem Intl Ed. 2005;44:6375. doi: 10.1002/anie.200501137. [DOI] [PubMed] [Google Scholar]; (b) You CC, Miranda OR, Gider B, Ghosh PS, Kim IB, Erdogan B, Krovi SA, Bunz UHF, Rotello VM. Nat Nanotechnol. 2007;2:318. doi: 10.1038/nnano.2007.99. [DOI] [PubMed] [Google Scholar]; (c) Kong H, Liu D, Zhang SC, Zhang XR. Anal Chem. 2011;83:1867. doi: 10.1021/ac200076c. [DOI] [PubMed] [Google Scholar]; (d) De M, Rana S, Akpinar H, Miranda OR, Arvizo RR, Bunz UHF, Rotello VM. Nat Chem. 2009;1:461. doi: 10.1038/nchem.334. [DOI] [PMC free article] [PubMed] [Google Scholar]
- 12.(a) Karasinski J, Andreescu S, Sadik OA, Lavine B, Vora MN. Anal Chem. 2005;77:7941. doi: 10.1021/ac0512150. [DOI] [PubMed] [Google Scholar]; (b) Phillips RL, Miranda OR, You CC, Rotello VM, Bunz UHF. Angew Chem Intl Ed. 2008;47:2590. doi: 10.1002/anie.200703369. [DOI] [PubMed] [Google Scholar]; (c) Hwang BH, Cha HJ. Biotechnol Bioeng. 2010;106:183. doi: 10.1002/bit.22674. [DOI] [PubMed] [Google Scholar]
- 13.(a) Bajaj A, Miranda OR, Kim IB, Phillips RL, Jerry DJ, Bunz UHF, Rotello VM. Proc Natl Acad Sci U S A. 2009;106:10912. doi: 10.1073/pnas.0900975106. [DOI] [PMC free article] [PubMed] [Google Scholar]; (b) El-Boubbou K, Zhu DC, Vasileiou C, Borhan B, Prosperi D, Li W, Huang XF. J Am Chem Soc. 2010;132:4490. doi: 10.1021/ja100455c. [DOI] [PubMed] [Google Scholar]; (c) Hedegaard M, Krafft C, Ditzel HJ, Johansen LE, Hassing S, Popp J. Anal Chem. 2010;82:2797. doi: 10.1021/ac902717d. [DOI] [PubMed] [Google Scholar]; (d) Bajaj A, Rana S, Miranda OR, Yawe JC, Jerry DJ, Bunz UHF, Rotello VM. Chem Sci. 2010;1:134. [Google Scholar]; (e) Scott MD, Dutta R, Haldar MK, Guo B, Friesner DL, Mallik S. Anal Chem. 2012;84:17. doi: 10.1021/ac202301k. [DOI] [PMC free article] [PubMed] [Google Scholar]; (f) Tanaka M, Bateman R, Rauh D, Vaisberg E, Ramachandani S, Zhang C, Hansen KC, Burlingame AL, Trautman JK, Shokat KM, Adams CL. PLoS Biol. 2005;3:e128. doi: 10.1371/journal.pbio.0030128. [DOI] [PMC free article] [PubMed] [Google Scholar]
- 14.(a) McQuade DT, Pullen AE, Swager TM. Chem Rev. 2000;100:2537. doi: 10.1021/cr9801014. [DOI] [PubMed] [Google Scholar]; (b) Liu B, Bazan GC. Chem Mater. 2004;16:4467. [Google Scholar]
- 15.(a) Liu B, Bazan GC. J Am Chem Soc. 2006;128:1188. doi: 10.1021/ja055382t. [DOI] [PubMed] [Google Scholar]; (b) Thomas SW, Joly GD, Swager TM. Chem Rev. 2007;107:1339. doi: 10.1021/cr0501339. [DOI] [PubMed] [Google Scholar]
- 16.Chen LH, Xu S, McBranch D, Whitten D. J Am Chem Soc. 2000;122:9302. [Google Scholar]
- 17.Kim HN, Guo Z, Zhu W, Yoon J, Tian H. Chem Soc Rev. 2011;40:79. doi: 10.1039/c0cs00058b. [DOI] [PubMed] [Google Scholar]
- 18.(a) Chi C, Mikhailovsky A, Bazan GC. J Am Chem Soc. 2007;129:11134. doi: 10.1021/ja072471s. [DOI] [PubMed] [Google Scholar]; (b) Song J, Zhang J, Lv F, Cheng Y, Wang B, Feng L, Liu L, Wang S. Angew Chem Intl Ed. 2013;52:13020. doi: 10.1002/anie.201305461. [DOI] [PubMed] [Google Scholar]; (c) Zheng W, He L. J Am Chem Soc. 2009;131:3432. doi: 10.1021/ja809175q. [DOI] [PubMed] [Google Scholar]
- 19.(a) Wang DL, Gong X, Heeger PS, Rininsland F, Bazan GC, Heeger AJ. Proc Natl Acad Sci U S A. 2002;99:49. doi: 10.1073/pnas.012581399. [DOI] [PMC free article] [PubMed] [Google Scholar]; (b) Zhu Q, Zhan R, Liu B. Macromol Rapid Commun. 2010;31:1060. doi: 10.1002/marc.200900909. [DOI] [PubMed] [Google Scholar]; (c) Chung CYS, Yam VWW. J Am Chem Soc. 2011;133:18775. doi: 10.1021/ja205996e. [DOI] [PubMed] [Google Scholar]; (d) Bai J, Liu C, Yang T, Wang F, Li Z. Chem Commun. 2013;49:3887. doi: 10.1039/c3cc41417e. [DOI] [PubMed] [Google Scholar]
- 20.(a) Pu KY, Liu B. Macromolecules. 2008;41:6636. [Google Scholar]; (b) Shi H, Sun H, Yang H, Liu S, Jenkins G, Feng W, Li F, Zhao Q, Liu B, Huang W. Adv Funct Mater. 2013;23:3268. [Google Scholar]
- 21.(a) Duarte A, Chworos A, Flagan SF, Hanrahan G, Bazan GC. J Am Chem Soc. 2010;132:12562. doi: 10.1021/ja105747b. [DOI] [PubMed] [Google Scholar]; (b) Yuan H, Liu Z, Liu L, Lv F, Wang Y, Wang S. Adv Mater. 2014;26:4333. doi: 10.1002/adma.201400636. [DOI] [PubMed] [Google Scholar]; (c) Duarte A, Slutsky M, Hanrahan G, Mello CM, Bazan GC. Chem Eur J. 2012;18:756. doi: 10.1002/chem.201103237. [DOI] [PubMed] [Google Scholar]
- 22.(a) Huang Y, Yao X, Zhang R, Ouyang L, Jiang R, Liu X, Song C, Zhang G, Fan Q, Wang L, Huang W. ACS Appl Mater Interfaces. 2014;6:19144. doi: 10.1021/am505113p. [DOI] [PubMed] [Google Scholar]; (b) Kim IB, Shin H, Garcia AJ, Bunz UHF. Bioconjug Chem. 2007;18:815. doi: 10.1021/bc0603440. [DOI] [PubMed] [Google Scholar]; (c) Moon JH, McDaniel W, MacLean P, Hancock LE. Angew Chem Intl Ed. 2007;46:8223. doi: 10.1002/anie.200701991. [DOI] [PubMed] [Google Scholar]
- 23.Bajaj A, Miranda OR, Phillips R, Kim IB, Jerry DJ, Bunz UHF, Rotello VM. J Am Chem Soc. 2010;132:1018. doi: 10.1021/ja9061272. [DOI] [PMC free article] [PubMed] [Google Scholar]
- 24.Tsien RY. Annu Rev Biochem. 1998;67:509. doi: 10.1146/annurev.biochem.67.1.509. [DOI] [PubMed] [Google Scholar]
- 25.(a) Kim IB, Dunkhorst A, Gilbert J, Bunz UHF. Macromolecules. 2005;38:4560. [Google Scholar]; (b) Tan CY, Pinto MR, Schanze KS. Chem Commun. 2002:446. doi: 10.1039/b109630c. [DOI] [PubMed] [Google Scholar]; (c) Kim IB, Phillips R, Bunz UHF. Macromolecules. 2007;40:5290. [Google Scholar]
- 26.Lakowicz JR. Principles of Fluorescence Spectroscopy. Kluwer Academic/Plenum Publishers; New York: 1999. [Google Scholar]
- 27.Boeneman K, Mei BC, Dennis AM, Bao G, Deschamps JR, Mattoussi H, Medintz IL. J Am Chem Soc. 2009;131:3828. doi: 10.1021/ja809721j. [DOI] [PMC free article] [PubMed] [Google Scholar]
- 28.(a) Blackburn AC, McLary SC, Naeem R, Luszcz J, Stockton DW, Donehower LA, Mohammed M, Mailhes JB, Soferr T, Naber SP, Otis CN, Jerry DJ. Cancer Res. 2004;64:5140. doi: 10.1158/0008-5472.CAN-03-3435. [DOI] [PubMed] [Google Scholar]; (b) Deugnier MA, Faraldo MM, Teuliere J, Thiery JP, Medina D, Glukhova MA. Dev Biol. 2006;293:414. doi: 10.1016/j.ydbio.2006.02.007. [DOI] [PubMed] [Google Scholar]; (c) Dunphy KA, Seo JH, Kim DJ, Roberts AL, Tao L, DiRenzo J, Balboni AL, Crisi GM, Hagen MJ, Chandrasekaran T, Gauger KJ, Schneider SS, Jerry DJ. Cancer Cell Int. 2013;13:74. doi: 10.1186/1475-2867-13-74. [DOI] [PMC free article] [PubMed] [Google Scholar]
- 29.Jurs PC, Bakken GA, McClelland HE. Chem Rev. 2000;100:2649. doi: 10.1021/cr9800964. [DOI] [PubMed] [Google Scholar]
- 30.Rana S, Singla AK, Bajaj A, Elci SG, Miranda OR, Mout R, Yan B, Jirik FR, Rotello VM. ACS Nano. 2012;6:8233. doi: 10.1021/nn302917e. [DOI] [PMC free article] [PubMed] [Google Scholar]
- 31.Singla AK, Downey CM, Bebb GD, Jirik FR. Oncoscience. 2015;2:263. doi: 10.18632/oncoscience.117. [DOI] [PMC free article] [PubMed] [Google Scholar]
- 32.Rana S, Le ND, Mout R, Duncan B, Elci SG, Saha K, Rotello VM. ACS Cent Sci. 2015;1:191. doi: 10.1021/acscentsci.5b00126. [DOI] [PMC free article] [PubMed] [Google Scholar]
- 33.(a) Esko JD, Rostand KS, Weinke JL. Science. 1988;241:1092. doi: 10.1126/science.3137658. [DOI] [PubMed] [Google Scholar]; (b) Esko JD, Stewart TE, Taylor WH. Proc Natl Acad Sci U S A. 1985;82:3197. doi: 10.1073/pnas.82.10.3197. [DOI] [PMC free article] [PubMed] [Google Scholar]; (c) Esko JD, Weinke JL, Taylor WH, Ekborg G, Roden L, Anantharamaiah G, Gawish A. J Biol Chem. 1987;262:12189. [PubMed] [Google Scholar]
- 34.(a) Nyren-Erickson EK, Haldar MK, Gu Y, Qian SY, Friesner DL, Mallik S. Anal Chem. 2011;83:5989. doi: 10.1021/ac2009993. [DOI] [PMC free article] [PubMed] [Google Scholar]; (b) Elci SG, Moyano DF, Rana S, Tong GY, Phillips RL, Bunz UHF, Rotello VM. Chem Sci. 2013;4:2076. [Google Scholar]; (c) Jelinek R, Kolusheva S. Chem Rev. 2004;104:5987. doi: 10.1021/cr0300284. [DOI] [PubMed] [Google Scholar]; (d) Wilson JT, Cui W, Kozlovskaya V, Kharlampieva E, Pan D, Qu Z, Krishnamurthy VR, Mets J, Kumar V, Wen J, Song Y, Tsukruk VV, Chaikof EL. J Am Chem Soc. 2011;133:7054. doi: 10.1021/ja110926s. [DOI] [PubMed] [Google Scholar]
- 35.Peng G, Hakim M, Broza YY, Billan S, Abdah-Bortnyak R, Kuten A, Tisch U, Haick H. Br J Cancer. 2010;103:542. doi: 10.1038/sj.bjc.6605810. [DOI] [PMC free article] [PubMed] [Google Scholar]
- 36.(a) Bunz UHF. Macromol Rapid Commun. 2009;30:772. doi: 10.1002/marc.200800775. [DOI] [PubMed] [Google Scholar]; (b) Dane EL, King SB, Swager TM. J Am Chem Soc. 2010;132:7758. doi: 10.1021/ja1019063. [DOI] [PubMed] [Google Scholar]; (c) Wu C, Bull B, Szymanski C, Christensen K, McNeill J. ACS Nano. 2008;2:2415. doi: 10.1021/nn800590n. [DOI] [PMC free article] [PubMed] [Google Scholar]
- 37.Shaner NC, Steinbach PA, Tsien RY. Nat Methods. 2005;2:905. doi: 10.1038/nmeth819. [DOI] [PubMed] [Google Scholar]
- 38.Rana S, Le NDB, Mout R, Saha K, Tonga GY, Bain RES, Miranda OR, Rotello CM, Rotello VM. Nat Nanotechnol. 2015;10:65. doi: 10.1038/nnano.2014.285. [DOI] [PMC free article] [PubMed] [Google Scholar]
Associated Data
This section collects any data citations, data availability statements, or supplementary materials included in this article.


