

Abstract
Objective
Brain glucose hypometabolism is a prominent feature of Alzheimer's disease (AD), and in this case–control study we used Magnetic Resonance Spectroscopy (MRS) to assess AD‐related differences in the posterior cingulate/precuneal ratio of glucose, lactate, and other metabolites.
Methods
J‐modulated Point‐Resolved Spectroscopy (J‐PRESS) and Prior‐Knowledge Fitting (ProFit) software was used to measure glucose and other metabolites in the posterior cingulate/precuneus of 25 AD, 27 older controls, and 27 younger control participants. Clinical assessments for AD participants included cognitive performance measures, insulin resistance metrics and CSF biomarkers.
Results
AD participants showed substantially elevated glucose, lactate, and ascorbate levels compared to older (and younger) controls. In addition, the precuneal glucose elevation discriminated well between AD participants and older controls. Myo‐inositol correlated with CSF p‐Tau181P, total Tau, and the Clinical Dementia Rating (CDR) sum‐of‐boxes score within the AD group.
Interpretation
Higher glucose to creatine ratios in the AD brain likely reflect lower glucose utilization. Our findings reveal pronounced metabolic abnormalities in the AD brain and strongly suggest that brain glucose merits further investigation as a candidate AD biomarker.
Introduction
Alzheimer's disease (AD) is increasingly viewed as a disorder of brain metabolism, an invariant feature of which is a profound reduction in cerebral glucose metabolism.1, 2, 3 The impairment in glucose uptake and metabolism starts decades before classic AD symptoms and worsens steadily with disease progression.4, 5, 6 Studies using positron emission tomography with 2‐[(18)F]fluoro‐2‐deoxy‐D‐glucose (FDG‐PET) have demonstrated a characteristic pattern of hypometabolism, which is most pronounced in the posterior cingulate and medial parieto‐temporal cortices, also notable for their higher reliance on aerobic glycolysis relative to the rest of the brain.7, 8 The precuneus/posterior cingulate region is also a key node of the Default Mode Network (DMN) and shows early and prominent beta‐amyloid (Aβ) deposition,9, 10, 11 abnormal functional connectivity,12 decreased glucose utilization,13 and an association with deficits in executive function14 in AD. These facts render this region ideal for examining both metabolic disturbances and potential neuroimaging biomarkers relevant to AD.
Despite decades of intense research, existing biomarkers of AD, such as CSF and plasma measurements of pathogenic proteins Aβ and Tau, are imperfect as they do not exhibit dynamic changes across the entire course of the disease15 and provide a classification accuracy below what would be accepted for clinical diagnosis. For this reason, they have been adopted in research, but not in clinical practice.16 Proton Magnetic Resonance Spectroscopy (1H‐MRS) provides accurate noninvasive in vivo measures of a limited set of brain metabolites, and aspects of AD neuropathology have long been associated with consistent changes in certain metabolites within its sensitivity. Specifically, reductions in the neuronal marker N‐Acetyl Aspartate (NAA) have long been associated with neurodegeneration, and elevations in myo‐inositol (mI), have been associated with reactive astrocytosis.14, 17, 18 Despite its immediate relevance to metabolic dysfunction, glucose has rarely been mentioned in earlier MRS studies. This is attributed to the difficulty of measuring glucose via conventional 1H‐MRS, as its signal consists of multiple peaks that overlap with other metabolites.19 Fortunately, with more advanced two‐dimensional MRS techniques such as J‐modulated Point‐Resolved Spectroscopy (J‐PRESS), metabolites such as glucose, glutamine, glutamate, and GABA that eluded many prior spectroscopy methods can now be more reliably quantified. In an earlier study, we used J‐PRESS MRS to successfully measure glutamate and GABA ratios in the posterior cingulate/precuneus of normal participants, revealing a strong association between these metabolites and default mode network connectivity.20 In this study, we use J‐PRESS MRS to measure glucose and other key metabolites in the same region, given its critical importance for AD pathogenesis.
To our knowledge, this is the first study to examine the expanded set of brain metabolites quantifiable in vivo by J‐PRESS MRS and make a preliminary assessment of their potential as AD biomarkers. Our findings replicate prior conventional 1H‐MRS findings for NAA, reveal substantial elevations in previously elusive brain metabolites such as glucose, lactate, and ascorbate, are consistent with earlier PET‐based and neuropathological research, and suggest that MRS‐measured glucose merits further research as a promising biomarker of abnormal brain metabolism in AD.
Methods
Subjects
This study was performed under NIH Institutional Review Board‐approved protocols and all participants provided written informed consent. Clinical investigations were conducted per the principles expressed in the Declaration of Helsinki. A total of 79 participants were recruited, including 27 cognitively normal younger controls under 60 years of age, 27 cognitively normal older controls over 60 years of age, and 25 participants with high probability AD over 60 years of age. Sex distribution was different between the groups by Pearson chi‐squared test (c 2[2, 79] = 13.432, P = 0.001) and this was included as a covariate in the analysis. Demographic data for the groups are summarized in Table 1. AD diagnosis with high probability was based on clinical diagnosis, low CSF Aβ, high CSF Tau and/or p‐Tau.16, 21
Table 1.
Demographics of participant sample
| Group | N | Age (years) | Sex |
|---|---|---|---|
| CN Younger (<60 years) | 27 | 41.0 ± 10.6 | 85% Male |
| CN Older (>60 years) | 27 | 70.2 ± 6.7 | 44% Male |
| AD (>60 years) | 25 | 74.3 ± 7.3 | 40% Male |
Age is given as mean ± standard deviation.
Clinical, cognitive, and laboratory measures
Clinical and cognitive measures for the AD group are presented in Table 2. These assessments included the Clinical Dementia Rating (CDR) global score, the CDR sum of boxes (CDR‐sob), the 70‐point Alzheimer's Disease Assessment Scale‐cognitive subscale (ADAS‐Cog), and the Mini‐Mental State Examination (MMSE). All subjects with AD had CDR global score of 0.5 or 1. In exploratory models, participants with CDR 0.5 or 1 had no differences and were therefore combined into one group. The CN groups (younger and older) were recruited using a separate protocol with no provision for the above measures, but these had no clinical diagnosis of cognitive impairment or neuropsychiatric disease and reported no use of neurotropic medications. No AD or control subjects with Diabetes Mellitus are included in this study.
Table 2.
Clinical data for AD participants
| Measure | Mean ± SD | |
|---|---|---|
| MMSE | 25.4 ± 3.9 | |
| ADAS Cog | 13.9 ± 6.9 | |
| CDR global 0.5 | n = 19 | |
| CDR global 1.0 | n = 6 | |
| CDR sob | 2.7 ± 1.6 | |
| CSF AB 1‐42 | 159.6 ± 43.8 | pg/ml |
| CSF Tau | 77.5 ± 34.5 | pg/ml |
| CSF p‐Tau181P | 47.12 ± 22.1 | pg/ml |
| Fasting insulin | 8.5 ± 4.6 | μIU/mL |
| Fasting glucose | 90.4 ± 8.5 | mg/dL |
| HOMA2%B | 95.9 ± 34.1 | |
| HOMA2%S | 118.3 ± 57.9 | |
| HOMA2‐IR | 1.1 ± 0.6 |
Values presented as mean ± standard deviation where applicable. MMSE, mini‐mental state examination; CDR, clinical dementia rating; CDR sob, CDR sum‐of‐boxes; CSF Aβ 1‐42, cerebrospinal fluid B‐amyloid 42; p‐Tau181P, Tau phosphorylated on threonine 181; HOMA2%B, Homeostasis Model Assessment 2 beta cell function; HOMA2%S, Homeostasis Model Assessment 2 insulin sensitivity; HOMA2 IR, Homeostasis Model Assessment 2 insulin resistance.
Laboratory measures for the AD group pertinent to systemic glucose metabolism and AD pathology are provided in Table 2. Blood samples were collected by venipuncture into a vacutainer EDTA tube. Plasma was immediately separated from cells by centrifugation at 2095 xg for 30 sec at 25°C, then realiquoted and stored at −80°C immediately afterward. Samples were thawed to room temperature before assaying. The Mercodia Insulin assay (Uppsala, Sweden) was used to provide a measure of fasting insulin (μIU/mL). Fasting plasma glucose was measured from the same aliquot used for insulin via the YSI 2300 STAT PLUS™ Glucose Analyzer by Yellow Springs Instrument (YSI; YSI Inc., Yellow Springs, Ohio, USA). Homeostatic Model Assessment (HOMA2) values were obtained by entering the fasting glucose and insulin into the HOMA2 Calculator, available at https://www.dtu.ox.ac.uk/homacalculator/.
Cerebrospinal fluid was obtained via lumbar puncture and stored at −80°C immediately until thawed for sample processing. The levels (pg/mL) of beta‐amyloid1‐42 (Aβ 42), phosphorylated Tau (p‐Tau181P) and total Tau (t‐Tau) were processed at the University of Pennsylvania Biomarker Research Laboratory using Luminex xMAP technology with INNO‐BIA Alz Bio3 kits provided by Fujirebio.
Magnetic resonance spectroscopy
Single voxel 1H‐MRS data were acquired using a Philips Achieva 3T whole‐body MR scanner equipped with an 8‐channel SENSE head coil. A volume of interest of 25 × 18 × 20 mm3 was placed at midline over the bilateral posteromedial cortex (PMC). For each participant, the MRS voxel was placed on the 3D MPRAGE image under direct visual inspection by one of the authors (RM), see Figure 1A for a representative precuneal voxel placement. The Talairach atlas22 was consulted to ensure maximal inclusion of the precuneus in the voxel. We acquired a two‐dimensional j‐resolved spectrum using a J‐PRESS sequence with maximum‐echo sampling.23 This method acquires a dynamic series of PRESS spectra incrementing the echo time to encode J‐modulations in the second (indirect) dimension; this additional dimension permits the discrimination and quantification of resonances that overlap in the directly detected chemical shift direction but have different J couplings. The echo times in this study were incremented from 31 to 229 msec using 100 echo steps with a step size of 2 msec. Other J‐PRESS acquisition parameters consisted of a repetition time = 1600 msec, eight averages per echo time, bandwidth in the direct dimension = 2 kHz, 1024 sample points, for a total scan duration of 21 min and 20 sec. Line widths for the water resonance were monitored for intrasubject scan reliability and were (mean ± SD) 7.3 ± 1.7 Hz.
Figure 1.
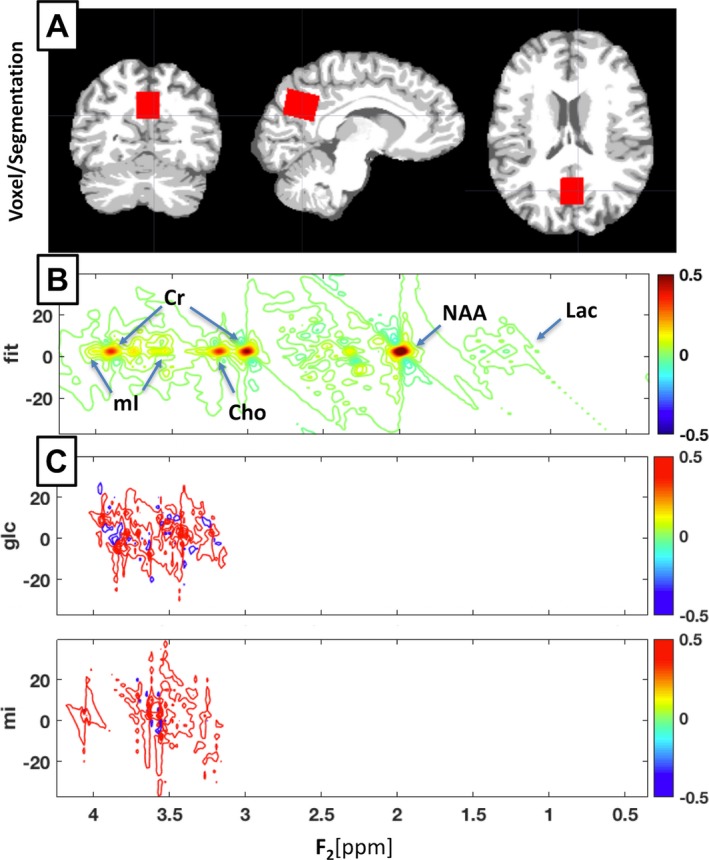
Segmentation & J‐PRESS Acquisition. (A) Segmented coronal, sagittal, and axial views of a representative younger control participant, showing bilateral precuneus voxel placement in red. Segmentation is displayed with white as white matter, light gray as gray matter, and dark gray as CSF. Figure created in MRIcroGL version 1.150909. (B) ProFit spectral fitting for a representative Alzheimer's disease participant showing labels for location of standard reference metabolite peaks (NAA, Cr, Cho) and mI. (C) ProFit basis sets used for J‐PRESS glucose and mI measurements showing the complex spectral location of these metabolites.
Relative metabolite ratios to creatine were determined using the Prior‐Knowledge Fitting procedure (ProFit), which fits linear combinations of simulated two‐dimensional basis metabolite spectra.24 Metabolite amounts for NAA, Glycerophosphocholine (Gpc), Phosphocholine (Pch), Alanine (Ala), Gamma‐Amino Butyric Acid (GABA), Glc, Glutamine (Gln), Glutamate (Glu), Glutathione (GSH), Lac, mI, N‐Acetyl‐Aspartyl‐glutamate (NAAG), Scyllo‐inositol (Scy), Taurine (Tau), and Ascorbate (Asc) are reported as their ratio to creatine. ProFit assesses goodness of fit in terms of Cramer–Rao lower bounds (CRLB%), which were used as an estimate of measurement error. Metabolite measurements were excluded from analysis if their CRLB exceeded a threshold of 20%.25 Aspartate (Asp), glycine (Gly), and phosphorylethanolamine (PE) were preemptively excluded from the analysis due to known in vivo overestimations or signal contamination.24 See Figure 1B and C for a representative J‐PRESS ProFit sample spectrum and select basis sets.
A PRESS sequence with nonsuppressed water signal reference in the same region was acquired to address the potential confound of group creatine differences affecting the J‐PRESS metabolite/creatine ratios. PRESS parameters were: TE = 35 msec, TR = 2000 msec, 256 averages, direct dimension bandwidth = 2 kHz, and 2048 sample points. Data were processed with LCModel26 and the resulting water‐scaled creatine values were corrected for partial volumes.27
MRI structural images
T1‐weighted magnetization‐prepared rapid gradient‐echo (MPRAGE) images were acquired on a 3T Phillips Achieva scanner with an 8‐channel SENSE head coil. A Turbo Field Echo acquisition sequence was used with the following parameters: TR = 6.803 msec, TE = 3.19 msec, number of excitations = 1, flip angle = 8°, acquisition matrix = 256 × 256 × 170, resolution = 1 × 1 × 1.2 mm.
Partial volume correction
Given the placement of the MRS voxel over a mixed area of gray matter, white matter, and cerebrospinal fluid (CSF), and the differential concentrations of certain metabolites between each tissue compartment, we sought to assess and correct for partial volume effects for those metabolites with non‐negligible concentration in the CSF. For example, glucose is detectable in the CSF at over three times its concentration in GM or WM.28, 29, 30 This is also the case for lactate, which is detectable in CSF but negligible in normal brain tissue.26 The reverse is true of ascorbate (Asc, vitamin C), which is marginally detectable in CSF but highly concentrated in GM and WM.31, 32 The potentially confounding influence of changes in CSF content within the voxel due to atrophy in the AD group was corrected statistically using the fractional volume of CSF (fCSF) as a covariate for these metabolites (Glc, Lac and Asc), as described below.
To obtain fCSF values for the voxel we used the T1‐weighted anatomical images (MP‐RAGE) and a custom MATLAB script adapted from Partial Volume Code for Philips MRS data provided by Dr. Nia Goulden and Dr. Paul Mullins of Bangor University.33 This method was used to find the fractional volume of cerebrospinal fluid (fCSF = CSFvol/(GMvol + WMvol + CSFvol)) within the MRS voxel. This script placed the spectroscopy voxel within the T1 structural image, which was then segmented into tissue types using the VBM8 toolbox (http://www.fil.ion.ucl.ac.uk/spm/software/spm8/). VBM8 uses a unified segmentation methodology registering and warping native‐space images into Montreal Neurological Institute (MNI) template space using affine and nonlinear parameters.34 Simultaneously, prior probability maps are applied to each subject's image to segment the brain into GM, WM, CSF, fat, and bone tissue classes. Maps were also manually inspected to ensure success of the segmentation algorithm. The whole brain CSF percentage (CSF%) and MRS voxel fCSF were both derived using this method. See Figure 1A for a representative segmentation.
Statistical analysis
All statistics were performed in SPSS 23.0 (Chicago, IL). For the comparison of AD and CN groups, univariate general linear model (GLM) analysis was employed, with group (CN < 60, CN > 60, AD > 60) as the fixed factor, metabolite ratio to creatine (/Cr) as the dependent variable, sex as a covariate, and the reciprocal (1/crlb) as the WLS (weighted least squares) weighting as previously described.20 This WLS weight gives less influence to the more uncertain (higher CRLB%) measurements. Pairwise post hoc comparisons were made between groups using Least Significant Difference (LSD) adjustment for multiple comparisons, as we were primarily interested in the planned comparison between the older CN and AD groups. As mentioned earlier, Glc, Lac, and Asc have detectable concentrations in CSF when compared to other MRS metabolites and may therefore be affected by differences in the CSF volume contained in the voxel. Although prior studies report no difference in CSF glucose between AD participants and controls,35, 36, 37 we wished to rule out that the difference seen in MRS Glc can be attributed to differences in CSF volume by adding fCSF to the model as a covariate.
Correlations between MRS metabolites (NAA, Gpc, Pch, Ala, GABA, Glc, Gln, Glu, GSH, Lac, mI, NAAG, Scy, Asc) and the laboratory and neuropsychological assessments (MMSE, ADAS‐Cog, CDR‐sob, CSF Aβ 42, CSF t‐Tau, CSF p‐Tau181P) were performed using two‐tailed bivariate Pearson's r.
To assess the individual and combined performance of the various measures in diagnostic classification we performed discriminant classifier analyses for AD participants versus older CN subjects. For this analysis, the performance of MRS metabolites was assessed alongside whole brain CSF% as a measure of atrophy. To determine the simplest and most accurate classifier model based on multiple measures we performed discriminant analyses step‐wise allowing different measures to “compete” against each other. As CRLB censoring resulted in more missing values for some metabolites, any missing values were imputed via multiple imputation option in SPSS for the discriminant analysis only. We used the Wilks' Lambda to select variables that significantly contribute to the discriminant function. In each step, only variables with a minimum partial F of 3.84 to enter and 2.71 to remove were retained. Prior probabilities were computed from group sizes. Cross‐validation was performed by leave‐one‐out classification. In addition, to assess the sensitivity and specificity for different cut‐off values in discriminating AD from older CN subjects, we performed receiver operating characteristics (ROC) analyses under the nonparametric distribution assumption. Diagnostic performance was assessed based on the area under curve (AUC) and an asymptotic significance under 0.05. Cut–offs were assessed using maximal Youden's J (Sensitivity + Specificity−1).
Results
Elevated glucose, ascorbate, and lactate with lower NAA in AD
Glc levels were significantly different between groups (F [2,73] = 8.752, P = 0.0004), with AD participants having a substantially elevated Glc compared to their younger CN (P = 0.0003) or older CN (P = 0.001) counterparts. Lactate (Lac) also showed significant differences (F [2,74] = 3.515, P = 0.035), being significantly elevated in AD compared to the older CNs (P = 0.013) and younger CNs (P = 0.041). Similarly, Ascorbate (Asc) was also significantly different (F [6.131] = 2,74, P = 0.003), with higher Asc levels in AD versus the younger CN (P = 0.003) and older CN (P = 0.003) groups. Results were comparable in models that did not include fCSF volume as a covariate. NAA is typically diminished in AD,17, 18 and this pattern held for this study (F [2,75] = 7.231, P = 0.001; NAA was lower in the AD than in the younger CN (P = 0.0003) and older CN groups (P = 0.022). Metabolite ratios in the normal groups were consistent with those reported earlier in ProFit literature.24 PRESS Creatine levels were not significantly different between groups (F [2, 43] = 1.106, P = 0.340), suggesting that between‐group differences in the ratios of other metabolites to creatine are not merely attributable to differences in creatine. See Figure 2 and Table 3 below for further details of the findings and Table S1 for the CRLBs.
Figure 2.
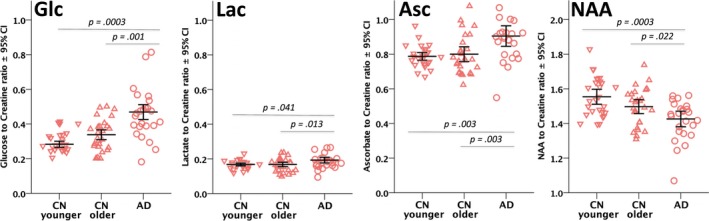
Scatter column graph of select metabolite to creatine ratios. Individual metabolite values are shown as red downward‐facing triangles for the younger control group (CN younger), upward triangles for the older control group (CN Older), and circles for the Alzheimer's disease group (AD). Error bars are unweighted mean ± 95% confidence interval for the metabolite.
Table 3.
J‐PRESS metabolite results
| Younger CN | Older CN | AD | Omnibus | AD vs. Older CN | ||||
|---|---|---|---|---|---|---|---|---|
| Metabolite | N | Mean | N | Mean | N | Mean | Sig. | Sig. |
| Glucose | 27 | 0.31 ± 0.02 | 27 | 0.36 ± 0.03 | 24 | 0.51 ± 0.06 | 0.0004 | 0.001 |
| Ascorbate | 27 | 0.79 ± 0.03 | 27 | 0.80 ± 0.06 | 25 | 0.92 ± 0.08 | 0.003 | 0.003 |
| Lactate | 27 | 0.17 ± 0.01 | 27 | 0.17 ± 0.01 | 25 | 0.20 ± 0.01 | 0.035 | 0.013 |
| NAA | 27 | 1.56 ± 0.12 | 27 | 1.50 ± 0.11 | 25 | 1.43 ± 0.10 | 0.001 | 0.022 |
| Glutamate | 27 | 1.57 ± 0.07 | 27 | 1.48 ± 0.05 | 25 | 1.43 ± 0.08 | 0.0003 | – |
| Glutamine | 27 | 0.34 ± 0.01 | 27 | 0.37 ± 0.02 | 25 | 0.39 ± 0.03 | 0.009 | – |
| Scyllo‐inositol | 18 | 0.05 ± 0.01 | 22 | 0.07 ± 0.01 | 19 | 0.07 ± 0.01 | 0.019 | – |
| Phosphocholine | 27 | 0.21 ± 0.01 | 27 | 0.20 ± 0.01 | 25 | 0.20 ± 0.01 | 0.047 | – |
| Myo‐inositol | 27 | 1.03 ± 0.04 | 27 | 0.99 ± 0.04 | 25 | 0.98 ± 0.08 | 0.077 | – |
| Glutathione | 27 | 0.26 ± 0.01 | 27 | 0.26 ± 0.02 | 25 | 0.27 ± 0.02 | 0.079 | – |
| Alanine | 26 | 0.14 ± 0.01 | 25 | 0.15 ± 0.01 | 20 | 0.15 ± 0.01 | 0.282 | – |
| NAAG | 10 | 0.16 ± 0.03 | 9 | 0.17 ± 0.02 | 17 | 0.21 ± 0.04 | 0.371 | – |
| GABA | 26 | 0.19 ± 0.01 | 25 | 0.20 ± 0.01 | 22 | 0.19 ± 0.01 | 0.399 | – |
N is number of participants in each group after CRLB censoring. Mean is standardized metabolite ratio to creatine ± its group standard deviation. Omnibus Sig. is derived from a univariate GLM across the three groups. AD versus Older CN Sig. is the planned LSD post hoc comparison significance. Significances in bold are below the 0.05 alpha threshold.
Age group differences in Gln, Glu, PCh, and Scy
Other metabolites (Gln, Glu, PCh, Scy) showed significant overall changes in AD only when compared to the younger CN group. Gln was significantly different among groups (F [2,75] = 5.071, P = 0.009), being higher in the AD group than the younger CNs (P = 0.002). Glu was affected in the opposite direction of Gln (F [2,75] = 9.071, P = 0.0003), with the AD (P = 0.00008) and older CN (P = 0.004) groups having lower Glu than the younger CN group. PCh (F[2,75] = 3.181, P = 0.047) was higher in the younger CN group than the older CN (P = 0.023) or AD groups (P = 0.036). Scy was also different between groups (F [2,55] = 4.241, P = 0.019), with the AD (P = 0.007)) and older CN (P = 0.016) groups having higher Scy than the younger CNs. However, none of these metabolites were significantly different for the comparison of the AD participants versus their age‐matched older CN counterparts.
Myo‐inositol correlates with disease severity
Within the AD group, myo‐Inositol (mI) showed the most convincing associations to CSF biomarkers and disease status. Myo‐inositol showed positive correlations with CSF Tau (r = 0.406, P = 0.049), CSF p‐Tau181P (r = 0.550, P = 0.005), and CDR‐sob (r = 0.548, P = 0.005), but not with CSF Aβ. Lac was also positively correlated with CDR sob (r = 0.414, P = 0.04), as was PCh (r = 0.486, P = 0.014). GABA was positively correlated with CSF p‐Tau181P (r = 0.431, P = 0.045), and Asp was negatively correlated with HOMA2%S (−0.478, P = 0.03). See Table 2 for a summary of these laboratory values and cognitive assessments in the AD group. See Figure 3, below for scatterplots of these correlations.
Figure 3.
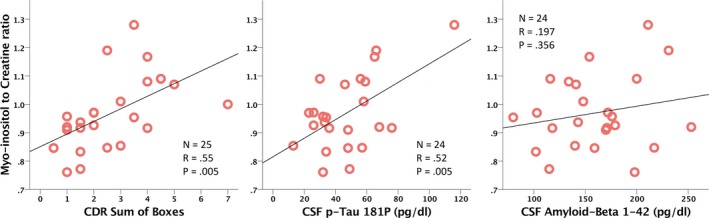
Scatterplots of select correlations between myo‐inositol on the y‐axis and CDR sum of boxes, CSF p‐Tau181P, and Aß42 on the x‐axis. Red circles indicate individual samples for each of the AD participants.
Glucose improves classification accuracy
A step‐wise discriminant analysis incorporated whole brain CSF% in step 1 and Glc/Cr in step 2, with criteria excluding all other J‐PRESS metabolites. This final CSF% & Glc/Cr model achieved a Wilks Lambda of 0.521 and an Exact F of 22.54, and correctly classified 90.4% of the subjects (or 88.5% with leave‐1‐out cross validation). Specifically, the Glc/Cr & CSF% model correctly classified 88.9% of older CN and 88.0% of AD participants after cross validation. Critically, a lower classification accuracy is observed with CSF% (82.7%) or Glc/Cr (73.1%) alone.
In an ROC analysis for the AD vs. Older CN classification (Fig. 4), the best individual performance was achieved by CSF% (AUC = 0.887, P = 0.000002), followed by Glc (AUC = 0.792, P = 0.0003), Asc (AUC = 0.740, P = 0.003), Lac (AUC = 0.676, P = 0.03), and NAA (AUC = 0.676, P = 0.03), see Table 4 for more details. All other J‐PRESS metabolites resulted in an asymptotic significance greater than 0.05 in the ROC analysis. Note that for NAA, the direction of change is opposite (downward) of the other affected metabolites, thus the reciprocal of NAA was used for the ROC analysis. Myo‐inositol did not distinguish well between AD and CN groups (AUC = 0.444, P = 0.486), but is included in Figure 4 for comparison.
Figure 4.
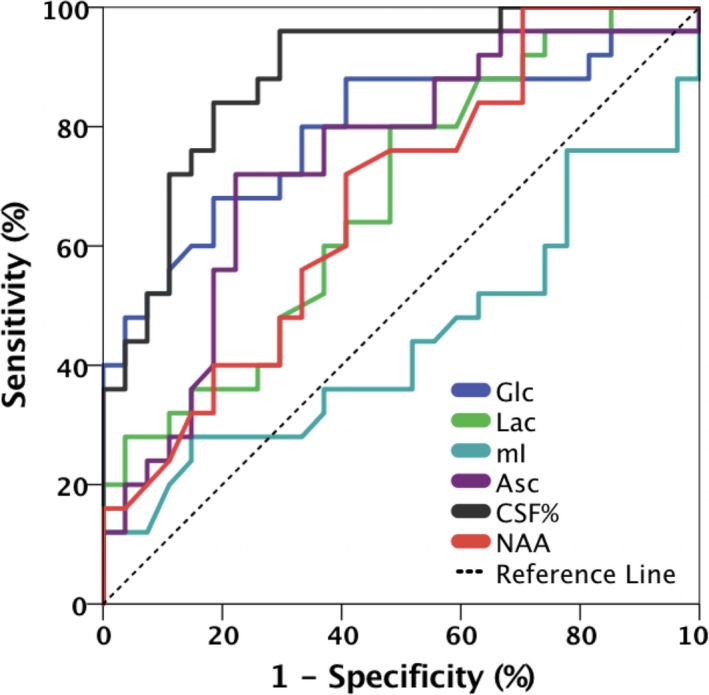
ROC curves for CSF%, glucose, ascorbate, lactate, NAA, and myo‐inositol for discrimination between the AD and older control groups.
Table 4.
ROC classification results for CSF%, Glc, Asc, Lac, NAA, and mI for discrimination between the AD and older CN groups
| Parameter | CSF% | Glc/Cr | Asc/Cr | Lac/Cr | NAA/Cr |
|---|---|---|---|---|---|
| ROC AUC | 0.89 | 0.79 | 0.74 | 0.68 | 0.68 |
| Asymp. Sig. | 0.000002 | 0.0003 | 0.003 | 0.03 | 0.03 |
| Cut‐off | >0.21 | >0.41 | >0.85 | >0.17 | ≤1.49 |
| Sensitivity | 96% | 68% | 72% | 80% | 72% |
| Specificity | 70% | 82% | 78% | 52% | 59% |
ROC, receiver operating characteristic; AUC, area under curve.
Discussion
In this study, we used J‐PRESS two‐dimensional MRS to examine the level of glucose and other metabolites in the posterior cingulate/precuneus region of AD participants and controls. Aside from demonstrating the ability of J‐PRESS to replicate previous findings of lower NAA in AD, this study revealed substantial elevations in Glc, Lac, and Asc in the disease. The inclusion of Glc into classification models improved their accuracy beyond that of anatomical measurement of brain atrophy.38, 39, 40 Myo‐Inositol, while not differing between groups, was nevertheless reflective of several important clinical and laboratory measures of AD severity.
The elevated Glc/Cr ratio in AD participants found in this study is comparable to the approximate 40% disparity found in a smaller early study in AD.41 From the standpoint of disease pathophysiology, the higher levels seen in AD participants also match the glucose elevation observed in diabetes mellitus,42 potentially due to their common underpinning of brain insulin resistance.43 Besides these earlier MRS findings, a recent human postmortem study also showed a dramatic glucose elevation in all brain regions of the AD specimens examined.44 Relevant concentrations of glucose in healthy individuals were previously reported as approximately 1 mmol/L in homogenous white matter, 1.1 mmol/L in gray matter,30 and 3.3 mmol/L in CSF.29, 37 While the differences described in the results were significant with and without our statistical covariate correction for fCSF volume, to further test the validity of our results we replicated these results in an additional post hoc analysis where the measured metabolite quantities were corrected for both the measured volume of CSF in each voxel and a range of reported Glc concentrations in each respective tissue compartment. This post hoc analysis retained significance for these comparisons. A pertinent limitation of the J‐PRESS method is that it may overestimate the Glc signal, possibly due to macromolecule contamination.24 However, this would also be true for the two control groups, and there is at the moment no clear evidence of macromolecule differences causing MRS signal differences in AD. Further research involving J‐PRESS MRS in animal models where the macromolecule constituents of brain tissue could be better studied and manipulated would be important for further validating the findings of this study.
Based on known aspects of AD pathophysiology, impaired glucose cellular uptake and metabolism is the most plausible explanation for the elevated MRS glucose levels we observed. The well‐replicated finding of lower FDG‐PET standardized uptake value ratio (SUVr) in AD reflects lower FDG cellular uptake and, by extension, less glucose cellular uptake as FDG competes for the same facilitated transporters as endogenous glucose.45 Glucose is primarily delivered from the extracellular space into neurons via the insulin‐independent glucose transporter GLUT3, and the insulin‐dependent GLUT4,46, 47 though many other GLUTs contribute. AD is characterized by downregulation of neuronal GLUT3 and glial/endothelial GLUT1, which provides far fewer avenues for glucose uptake into either cell type and thus leads to a reduction in neuronal activity and metabolism.48, 49 Large projection neurons are particularly vulnerable to these metabolic disruptions in AD due to their exceptionally high‐energy requirements coupled with their reliance on GLUT3 for glucose uptake.50, 51 The AD brain may thus suffer an effect similar to that found in type 2 diabetes, in which insulin resistance impairs the brain's ability to metabolize glucose,42, 52 possibly leading to a buildup of unmetabolized glucose in the extracellular space. This proposed surplus of glucose41 would be consistent with the higher AD Glc/Cr ratio found in this study.
Lactate is a product of glycolysis that may be used as an alternate neuronal energy substrate in conditions that do not favor aerobic metabolism.53 In AD, this switch is believed to occur due to hypoperfusion‐induced hypoxia and astrocytic mitochondrial dysfunction associated with the disease.54 Moreover, lactate production has been linked to regional neuronal activity and, most relevantly, levels of Aβ, 55 directly linking its production with AD pathogenesis. In this study, we found an elevation in lactate in AD compared to control subjects, which also survived the correction made for CSF volume. This corroborates the recent finding of elevated MRS‐measured lactate in transgenic AD mice compared to wild‐type mice, in which it is associated with memory deficits.56 Whereas older MRS studies failed to show any discernable lactate differences in AD,57, 58 our finding and that of a recent study54 align with this very strong mechanistic data.55, 56 Despite the biological plausibility of the finding, we interpret our results on Lac with caution as quantitation of Lac can be affected by signals from macromolecules which partially overlap with the Lac signal in the J‐PRESS spectrum.24
We also found Asc levels were higher in AD subjects, which is an interesting finding as this metabolite's role in brain function is still not clearly understood. As opposed to the miniscule levels typically found elsewhere in the body, the brain homeostatically maintains a high level of ascorbate, which is putatively assigned to antioxidant, neuroprotective, and/or neuromodulatory roles in the literature.31 Ascorbate is also synthesized from glucose59 and shares the GLUT1 Transporter for delivery into the cell (Rice, 2000). These elevated levels of Asc could be viewed alternately as either a response to AD‐related oxidative stress, or AD‐related downregulation of GLUT1 mirroring the putative buildup proposed for Glc, above. It is worth noting that vitamin C supplementation has been studied as a potential AD treatment for its antioxidant properties, but results were disappointing.60 The negative results of those earlier studies may be explicable if the disease causes a buildup of extracellular ascorbate that cannot be taken up by the cell.
Even when a biomarker cannot distinguish between participants and controls, it can be useful if it tracks disease progression. This may be a suitable role for myo‐inositol, which was well correlated with measures of AD disease status (CDR‐sob) and CSF biomarkers reflecting ongoing neurodegeneration (Tau, p‐Tau181P) within the AD group. This agrees with earlier findings on myo‐inositol in AD, which consistently revealed strong positive correlations with measures of cognitive decline and disease progression.14, 61, 62, 63 Higher levels of mI are considered a marker of neuroinflammation or “reactive astrogliosis,” and the activation of mI‐rich astrocytes and microglia is proposed as an explanation for these findings.64, 65
For a biomarker to be used as surrogate outcome measure in clinical trials, it should dynamically reflect the evolution of the pathophysiological process behind it, and effectively track disease progression. There is currently great interest in treatment approaches to improve insulin signaling and glucose metabolism in AD, including glucagon like peptide (GLP‐1) mimetics such as exendin‐4 (see clinical trial NCT01255163) and also66), intranasal insulin67 and calorie restriction diets.68 MRS biomarkers that reflect the metabolic status of the brain may be better suited to demonstrate target engagement and follow response to treatment compared to biomarkers reflecting amyloid and Tau pathologies in AD. In the classification analyses between older CN and AD groups within this study, Glc outperformed all other MRS metabolites, and was comparable in performance to the whole brain CSF fraction representative of the atrophy and ventricular enlargement found in AD.38, 39, 40 Moreover, it is mechanistically relevant to a promising line of AD experimental therapeutics targeting glucose metabolism. Further research is required to replicate this finding in larger cohorts, as well as to determine its effectiveness in the diagnosis of clinical and preclinical AD, in distinguishing AD from other dementing illnesses, and in responding to metabolism‐based interventions.
Conclusion
This study shows substantial elevations in glucose, lactate, and ascorbate levels within the posterior cingulate/precuneus of AD participants, which also discriminated well between groups. The biological basis of this effect cannot be determined based on MRS data alone, but is consistent with evidence that implicates insulin pathway dysregulation and impaired glucose metabolism, both well‐established components of AD pathophysiology. On the basis of this evidence, we propose further investigation on the role of brain glucose (alongside ascorbate, lactate, and myo‐inositol) in AD as well as further assessment of its feasibility as an effective MR biomarker of abnormal brain metabolism in AD.
Author Contributions
RM and DR performed acquisition and analysis of data. RM also responsible for drafting of the manuscript and figures. DR involved in spectroscopy expertise. DK involved in conception and design of study.
Conflicts of Interest
The authors declare that they have no conflicts of interest.
Supporting information
Table S1. J‐PRESS metabolite measurements and reproducibility data. N is number of participants after CRLB censoring. Mean is standardized metabolite ratio to creatine ± its group standard deviation. CRLB% is the Cramer–Rao lower bounds as a percentage ± its group standard deviation.
Acknowledgments
This research was supported by the Intramural Research Program of the National Institute on Aging (NIA/NIH).
Funding Statement
This work was funded by National Institute on Aging (NIA/NIH) grant .
References
- 1. Cunnane S, Nugent S, Roy M, et al. Brain fuel metabolism, aging, and Alzheimer's disease. Nutrition 2011;27:3–20. [DOI] [PMC free article] [PubMed] [Google Scholar]
- 2. Calsolaro V, Edison P. Alterations in glucose metabolism in Alzheimer's disease. Recent Pat Endocr Metab Immune Drug Discov 2016;10:31–39. [DOI] [PubMed] [Google Scholar]
- 3. Mosconi L. Brain glucose metabolism in the early and specific diagnosis of Alzheimer's disease. FDG‐PET studies in MCI and AD. Eur J Nucl Med Mol Imaging 2005;32:486–510. [DOI] [PubMed] [Google Scholar]
- 4. de Leon MJ, Convit A, Wolf OT, et al. Prediction of cognitive decline in normal elderly subjects with 2‐[(18)F]fluoro‐2‐deoxy‐D‐glucose/poitron‐emission tomography (FDG/PET). Proc Natl Acad Sci USA 2001;98:10966–10971. [DOI] [PMC free article] [PubMed] [Google Scholar]
- 5. Reiman EM, Caselli RJ, Yun LS, et al. Preclinical evidence of Alzheimer's disease in persons homozygous for the epsilon 4 allele for apolipoprotein E. N Engl J Med 1996;334:752–758. [DOI] [PubMed] [Google Scholar]
- 6. Small GW, Mazziotta JC, Collins MT, et al. Apolipoprotein E type 4 allele and cerebral glucose metabolism in relatives at risk for familial Alzheimer disease. JAMA 1995;273:942–947. [PubMed] [Google Scholar]
- 7. Vlassenko AG, Vaishnavi SN, Couture L, et al. Spatial correlation between brain aerobic glycolysis and amyloid‐beta (Abeta) deposition. Proc Natl Acad Sci USA 2010;107:17763–17767. [DOI] [PMC free article] [PubMed] [Google Scholar]
- 8. Mosconi L, Tsui WH, Rusinek H, et al. Quantitation, regional vulnerability, and kinetic modeling of brain glucose metabolism in mild Alzheimer's disease. Eur J Nucl Med Mol Imaging 2007;34:1467–1479. [DOI] [PubMed] [Google Scholar]
- 9. Sperling RA, LaViolette PS, O'Keefe K, et al. Amyloid Deposition Is Associated with Impaired Default Network Function in Older Persons without Dementia. Neuron 2009;63:178–188. [DOI] [PMC free article] [PubMed] [Google Scholar]
- 10. Bilgel M, An Y, Zhou Y, et al. Individual estimates of age at detectable amyloid onset for risk factor assessment. Alzheimers Dement 2016;12:373–379. [DOI] [PMC free article] [PubMed] [Google Scholar]
- 11. Sojkova J, Zhou Y, An Y, et al. Longitudinal patterns of beta‐amyloid deposition in nondemented older adults. Arch Neurol 2011;68 644–649. [DOI] [PMC free article] [PubMed] [Google Scholar]
- 12. Hedden T, Van Dijk KR, Becker JA, et al. Disruption of functional connectivity in clinically normal older adults harboring amyloid burden. J Neurosci 2009;29:12686–12694. [DOI] [PMC free article] [PubMed] [Google Scholar]
- 13. Landau SM, Mintun MA, Joshi AD, et al. Amyloid deposition, hypometabolism, and longitudinal cognitive decline. Ann Neurol 2012;72:578–586. [DOI] [PMC free article] [PubMed] [Google Scholar]
- 14. Bittner DM, Heinze HJ, Kaufmann J. Association of 1H‐MR spectroscopy and cerebrospinal fluid biomarkers in Alzheimer's disease: diverging behavior at three different brain regions. J Alzheimers Dis 2013;36:155–163. [DOI] [PubMed] [Google Scholar]
- 15. Jack CR Jr, Knopman DS, Jagust WJ, et al. Hypothetical model of dynamic biomarkers of the Alzheimer's pathological cascade. Lancet Neurol 2010;9:119–128. [DOI] [PMC free article] [PubMed] [Google Scholar]
- 16. McKhann GM, Knopman DS, Chertkow H, et al. The diagnosis of dementia due to Alzheimer's disease: recommendations from the National Institute on Aging‐Alzheimer's Association workgroups on diagnostic guidelines for Alzheimer's disease. Alzheimers Dement 2011;7:263–269. [DOI] [PMC free article] [PubMed] [Google Scholar]
- 17. Zhu X, Schuff N, Kornak J, et al. Effects of Alzheimer disease on fronto‐parietal brain N‐acetyl aspartate and myo‐inositol using magnetic resonance spectroscopic imaging. Alzheimer Dis Assoc Disord 2006;20:77–85. [DOI] [PMC free article] [PubMed] [Google Scholar]
- 18. Murray ME, Przybelski SA, Lesnick TG, et al. Early Alzheimer's disease neuropathology detected by proton MR spectroscopy. J Neurosci 2014;34:16247–16255. [DOI] [PMC free article] [PubMed] [Google Scholar]
- 19. Steinberg JD, Velan SS. Measuring glucose concentrations in the rat brain using echo‐time‐averaged point resolved spectroscopy at 7 tesla. Magn Reson Med 2013;70:301–308. [DOI] [PubMed] [Google Scholar]
- 20. Kapogiannis D, Reiter DA, Willette AA, Mattson MP. Posteromedial cortex glutamate and GABA predict intrinsic functional connectivity of the default mode network. NeuroImage 2013;1:112–119. [DOI] [PMC free article] [PubMed] [Google Scholar]
- 21. Sperling RA, Aisen PS, Beckett LA, et al. Toward defining the preclinical stages of Alzheimer's disease: recommendations from the National Institute on Aging‐Alzheimer's Association workgroups on diagnostic guidelines for Alzheimer's disease. Alzheimers Dement 2011;7:280–292. [DOI] [PMC free article] [PubMed] [Google Scholar]
- 22. Talairach J, Tournoux P. Co‐planar stereotaxic atlas of the human brain: 3‐dimensional proportional system: an approach to cerebral imaging. Stuttgart; New York: Georg Thieme, 1988. [Google Scholar]
- 23. Schulte RF, Lange T, Beck J, et al. Improved two‐dimensional J‐resolved spectroscopy. NMR Biomed 2006;19:264–270. [DOI] [PubMed] [Google Scholar]
- 24. Schulte RF, Boesiger P. ProFit: two‐dimensional prior‐knowledge fitting of J‐resolved spectra. NMR Biomed 2006;19:255–263. [DOI] [PubMed] [Google Scholar]
- 25. Provencher SW. LCModel & LCMgui User's Manual. http://s-provenchercom/pub/LCModel/manual/manualpdf. 2015.
- 26. Provencher SW. Estimation of metabolite concentrations from localized in vivo proton NMR spectra. Magn Reson Med 1993;30:672–679. [DOI] [PubMed] [Google Scholar]
- 27. Egerton A, Stone JM, Chaddock CA, et al. Relationship between brain glutamate levels and clinical outcome in individuals at ultra high risk of psychosis. Neuropsychopharmacology 2014;39:2891–2899. [DOI] [PMC free article] [PubMed] [Google Scholar]
- 28. McGale EH, Pye IF, Stonier C, et al. Studies of the inter‐relationship between cerebrospinal fluid and plasma amino acid concentrations in normal individuals. J Neurochem 1977;29:291–297. [DOI] [PubMed] [Google Scholar]
- 29. Leen WG, Willemsen MA, Wevers RA, Verbeek MM. Cerebrospinal fluid glucose and lactate: age‐specific reference values and implications for clinical practice. PLoS ONE 2012;7:e42745. [DOI] [PMC free article] [PubMed] [Google Scholar]
- 30. Michaelis T, Merboldt KD, Bruhn H, et al. Absolute concentrations of metabolites in the adult human brain in vivo: quantification of localized proton MR spectra. Radiology 1993;187:219–227. [DOI] [PubMed] [Google Scholar]
- 31. Rice ME. Ascorbate regulation and its neuroprotective role in the brain. Trends Neurosci 2000;23:209–216. [DOI] [PubMed] [Google Scholar]
- 32. Shih YY, Buchert M, Chung HW, et al. Vitamin C estimation with standard (1)H spectroscopy using a clinical 3T MR system: detectability and reliability within the human brain. J Magn Reson Imaging 2008;28:351–358. [DOI] [PubMed] [Google Scholar]
- 33. Gasparovic C, Song T, Devier D, et al. Use of tissue water as a concentration reference for proton spectroscopic imaging. Magn Reson Med 2006;55:1219–1226. [DOI] [PubMed] [Google Scholar]
- 34. Ashburner J, Friston KJ. Unified segmentation. NeuroImage 2005;26:839–851. [DOI] [PubMed] [Google Scholar]
- 35. Bouwman FH, Schoonenboom NS, Verwey NA, et al. CSF biomarker levels in early and late onset Alzheimer's disease. Neurobiol Aging 2009;30:1895–1901. [DOI] [PubMed] [Google Scholar]
- 36. Liguori C, Stefani A, Sancesario G, et al. CSF lactate levels, tau proteins, cognitive decline: a dynamic relationship in Alzheimer's disease. J Neurol Neurosurg Psychiatry 2015;86:655–659. [DOI] [PubMed] [Google Scholar]
- 37. Redjems‐Bennani N, Jeandel C, Lefebvre E, et al. Abnormal substrate levels that depend upon mitochondrial function in cerebrospinal fluid from Alzheimer patients. Gerontology 1998;44:300–304. [DOI] [PubMed] [Google Scholar]
- 38. Jack CR Jr, Shiung MM, Gunter JL, et al. Comparison of different MRI brain atrophy rate measures with clinical disease progression in AD. Neurology 2004;62:591–600. [DOI] [PMC free article] [PubMed] [Google Scholar]
- 39. Ott BR, Cohen RA, Gongvatana A, et al. Brain ventricular volume and cerebrospinal fluid biomarkers of Alzheimer's disease. J Alzheimers Dis 2010;20:647–657. [DOI] [PMC free article] [PubMed] [Google Scholar]
- 40. Nestor SM, Rupsingh R, Borrie M, et al. Ventricular enlargement as a possible measure of Alzheimer's disease progression validated using the Alzheimer's disease neuroimaging initiative database. Brain 2008;131(Pt 9):2443–2454. [DOI] [PMC free article] [PubMed] [Google Scholar]
- 41. Moats RA, Ernst T, Shonk TK, Ross BD. Abnormal cerebral metabolite concentrations in patients with probable Alzheimer disease. Magn Reson Med 1994;32:110–115. [DOI] [PubMed] [Google Scholar]
- 42. Kreis R, Ross BD. Cerebral metabolic disturbances in patients with subacute and chronic diabetes mellitus: detection with proton MR spectroscopy. Radiology 1992;184:123–130. [DOI] [PubMed] [Google Scholar]
- 43. Diehl T, Mullins R, Kapogiannis D. Insulin resistance in Alzheimer's disease. Transl Res 2016;183:26–40. [DOI] [PMC free article] [PubMed] [Google Scholar]
- 44. Xu J, Begley P, Church SJ, et al. Graded perturbations of metabolism in multiple regions of human brain in Alzheimer's disease: snapshot of a pervasive metabolic disorder. Biochim Biophys Acta 2016;1862:1084–1092. [DOI] [PMC free article] [PubMed] [Google Scholar]
- 45. Ishizu K, Nishizawa S, Yonekura Y, et al. Effects of hyperglycemia on FDG uptake in human brain and glioma. J Nucl Med 1994;35:1104–1109. [PubMed] [Google Scholar]
- 46. Blazquez E, Velazquez E, Hurtado‐Carneiro V, Ruiz‐Albusac JM. Insulin in the brain: its pathophysiological implications for States related with central insulin resistance, type 2 diabetes and Alzheimer's disease. Front Endocrinol (Lausanne) 2014;5:161. [DOI] [PMC free article] [PubMed] [Google Scholar]
- 47. Shah K, Desilva S, Abbruscato T. The role of glucose transporters in brain disease: diabetes and Alzheimer's Disease. Int J Mol Sci 2012;13:12629–12655. [DOI] [PMC free article] [PubMed] [Google Scholar]
- 48. Liu Y, Liu F, Iqbal K, et al. Decreased glucose transporters correlate to abnormal hyperphosphorylation of tau in Alzheimer disease. FEBS Lett 2008;582:359–364. [DOI] [PMC free article] [PubMed] [Google Scholar]
- 49. Simpson IA, Chundu KR, Davies‐Hill T, et al. Decreased concentrations of GLUT1 and GLUT3 glucose transporters in the brains of patients with Alzheimer's disease. Ann Neurol 1994;35:546–551. [DOI] [PubMed] [Google Scholar]
- 50. Mosconi L. Glucose metabolism in normal aging and Alzheimer's disease: methodological and physiological considerations for PET studies. Clin Transl Imaging 2013;1:217–233. [DOI] [PMC free article] [PubMed] [Google Scholar]
- 51. Mattson MP, Magnus T. Ageing and neuronal vulnerability. Nat Rev Neurosci 2006;7:278–294. [DOI] [PMC free article] [PubMed] [Google Scholar]
- 52. Steen E, Terry BM, Rivera EJ, et al. Impaired insulin and insulin‐like growth factor expression and signaling mechanisms in Alzheimer's disease–is this type 3 diabetes? J Alzheimers Dis 2005;7:63–80. [DOI] [PubMed] [Google Scholar]
- 53. Magistretti PJ, Pellerin L. Astrocytes Couple Synaptic Activity to Glucose Utilization in the Brain. News Physiol Sci 1999;14:177–182. [DOI] [PubMed] [Google Scholar]
- 54. Weaver KE, Richards TL, Logsdon RG, et al. Posterior Cingulate Lactate as a Metabolic Biomarker in Amnestic Mild Cognitive Impairment. Biomed Res Int 2015;2015:610605. [DOI] [PMC free article] [PubMed] [Google Scholar]
- 55. Bero AW, Yan P, Roh JH, et al. Neuronal activity regulates the regional vulnerability to amyloid‐beta deposition. Nat Neurosci 2011;14:750–756. [DOI] [PMC free article] [PubMed] [Google Scholar]
- 56. Harris RA, Tindale L, Lone A, et al. Aerobic Glycolysis in the Frontal Cortex Correlates with Memory Performance in Wild‐Type Mice But Not the APP/PS1 Mouse Model of Cerebral Amyloidosis. J Neurosci 2016;36:1871–1878. [DOI] [PMC free article] [PubMed] [Google Scholar]
- 57. Ernst T, Chang L, Melchor R, Mehringer CM. Frontotemporal dementia and early Alzheimer disease: differentiation with frontal lobe H‐1 MR spectroscopy. Radiology 1997;203:829–836. [DOI] [PubMed] [Google Scholar]
- 58. Stoppe G, Bruhn H, Pouwels PJ, et al. Alzheimer disease: absolute quantification of cerebral metabolites in vivo using localized proton magnetic resonance spectroscopy. Alzheimer Dis Assoc Disord 2000;14:112–119. [DOI] [PubMed] [Google Scholar]
- 59. Davies MB, Partridge DA, Austin JA. Vitamin C: its chemistry and biochemistry. The Royal Society of Chemistry 1991. [Google Scholar]
- 60. Harrison FE, Bowman GL, Polidori MC. Ascorbic acid and the brain: rationale for the use against cognitive decline. Nutrients 2014;6:1752–1781. [DOI] [PMC free article] [PubMed] [Google Scholar]
- 61. Voevodskaya O, Sundgren PC, Strandberg O, et al. Myo‐inositol changes precede amyloid pathology and relate to APOE genotype in Alzheimer disease. Neurology 2016;86:1754–1761. [DOI] [PMC free article] [PubMed] [Google Scholar]
- 62. Doraiswamy PM, Charles HC, Krishnan KR. Prediction of cognitive decline in early Alzheimer's disease. Lancet 1998;352:1678. [DOI] [PubMed] [Google Scholar]
- 63. Rose SE, de Zubicaray GI, Wang D, et al. A 1H MRS study of probable Alzheimer's disease and normal aging: implications for longitudinal monitoring of dementia progression. Magn Reson Imaging 1999;17:291–299. [DOI] [PubMed] [Google Scholar]
- 64. Eagan DE, Gonzales MM, Tarumi T, et al. Elevated serum C‐reactive protein relates to increased cerebral myoinositol levels in middle‐aged adults. Cardiovasc Psychiatry Neurol 2012;2012:120540. [DOI] [PMC free article] [PubMed] [Google Scholar]
- 65. Heneka MT, Carson MJ, El Khoury J, et al. Neuroinflammation in Alzheimer's disease. Lancet Neurol 2015;14:388–405. [DOI] [PMC free article] [PubMed] [Google Scholar]
- 66. Bomfim TR, Forny‐Germano L, Sathler LB, et al. An anti‐diabetes agent protects the mouse brain from defective insulin signaling caused by Alzheimer's disease‐ associated Abeta oligomers. J Clin Invest 2012;122:1339–1353. [DOI] [PMC free article] [PubMed] [Google Scholar]
- 67. Craft S, Baker LD, Montine TJ, et al. Intranasal insulin therapy for Alzheimer disease and amnestic mild cognitive impairment: a pilot clinical trial. Arch Neurol 2012;69:29–38. [DOI] [PMC free article] [PubMed] [Google Scholar]
- 68. Anson RM, Guo Z, de Cabo R, et al. Intermittent fasting dissociates beneficial effects of dietary restriction on glucose metabolism and neuronal resistance to injury from calorie intake. Proc Natl Acad Sci USA 2003;100:6216–6220. [DOI] [PMC free article] [PubMed] [Google Scholar]
Associated Data
This section collects any data citations, data availability statements, or supplementary materials included in this article.
Supplementary Materials
Table S1. J‐PRESS metabolite measurements and reproducibility data. N is number of participants after CRLB censoring. Mean is standardized metabolite ratio to creatine ± its group standard deviation. CRLB% is the Cramer–Rao lower bounds as a percentage ± its group standard deviation.