Abstract
Lymphoma is a significant cancer that affects the human lymphatic and hematopoietic systems. In this work, discrimination of lymphoma using laser-induced breakdown spectroscopy (LIBS) conducted on whole blood samples is presented. The whole blood samples collected from lymphoma patients and healthy controls are deposited onto standard quantitative filter papers and ablated with a 1064 nm Q-switched Nd:YAG laser. 16 atomic and ionic emission lines of calcium (Ca), iron (Fe), magnesium (Mg), potassium (K) and sodium (Na) are selected to discriminate the cancer disease. Chemometric methods, including principal component analysis (PCA), linear discriminant analysis (LDA) classification, and k nearest neighbor (kNN) classification are used to build the discrimination models. Both LDA and kNN models have achieved very good discrimination performances for lymphoma, with an accuracy of over 99.7%, a sensitivity of over 0.996, and a specificity of over 0.997. These results demonstrate that the whole-blood-based LIBS technique in combination with chemometric methods can serve as a fast, less invasive, and accurate method for detection and discrimination of human malignancies.
OCIS codes: (170.4580) Optical diagnostics for medicine; (300.6365) Spectroscopy, laser induced breakdown; (170.1580) Chemometrics
1. Introduction
Lymphoma is a cancer disease mainly affecting human lymphatic and hematopoietic systems. According to International Agency for Research on Cancer, lymphoma accounted for about 3.2% of the new cancer cases and 2.7% of the cancer deaths in 2012 worldwide [1]. In China, about 29300 people died from lymphoma in 2015 [2]. In-time diagnosis and discrimination of lymphoma will help to effectively control the progression of the disease and thus can reduce the morbidity and mortality of the cancer. However, diagnosis of lymphoma is a complicated issue, especially for the cases developing at the early stages. The early-stage lymphoma cases usually develop with no specific clinical symptoms, thus most cases are detected at the advanced stages, which are usually associated with bad prognosis. Currently, lymphoma is mainly discriminated using pathology. Although pathology is viewed as the “gold standard” for malignancy diagnosis, it still suffers some limitations. Firstly, pathology requires invasive biopsy collection, thus it cannot be used for the cases developing at the early stages, when the location of malignancies cannot be accurately determined. Meanwhile, pathology needs time-consuming sample preparation and laboratory work, thus it cannot be applied for real-time malignancy diagnosis. Furthermore, pathology depends largely on the experience of pathologists, thus it may give different and even contradicting results. Therefore, novel techniques to achieve non-invasive, quick, objective and robust diagnosis of lymphoma need to be developed.
Laser-induced breakdown spectroscopy (LIBS) is an analytical technique with many merits such as simplicity in apparatus, no or less sample preparation, capability of detecting all the elements, and possibility of standoff and on-site operations [3]. By focusing a pulsed laser onto a sample, a plasma can be formed if the power density at the focal spot exceeds a specific threshold value. As the plasma cools down, combination and de-excitation of atoms and ions in the plasma will give out fingerprint emissions of the elements in the sample. By analyzing these emissions, the chemical components of the sample can be determined, and the sample can then be classified and discriminated [4]. With the aforementioned benefits, LIBS has been applied in classification and discrimination of several different types of biomedical species, including bio-aerosols [5–8] (such as viruses, bacteria, fungi, pollens, etc.), calcified materials [9, 10] (such as teeth, bones, gallstones, etc.), and soft tissues [11, 12] (such as animal skin, muscle, nerve, etc.).
LIBS has also been investigated for discrimination of malignancies. Kumar et al. distinguished hemangiosarcoma and normal liver cells from the histological sections of dog liver based on the spectral intensity differences of several trace elements in the LIBS spectra [13]. El-Hussein et al. demonstrated classification of breast and colorectal cancers using LIBS via detecting the abundance of calcium and magnesium in the malignant tissues with respect to the non-neoplastic ones [14]. Han et al. realized discrimination of melanoma from surrounding dermis on a mice model using LIBS by analyzing the quantitative difference of calcium and magnesium in the tissues and using linear discriminant analysis (LDA) [15]. In the aforementioned references [13–15], the laser-induced breakdown was performed directly on the malignant tissues such that the LIBS discrimination can only be performed after the invasive biopsy collection, and it still cannot be used for the early cancer cases. In a recent publication, Melikechi et al. realized age-specific discrimination of blood plasma samples of healthy and ovarian cancer prone mice using LIBS, LDA and random forest analysis [16]. Recently, for the first time, we achieved successful diagnosis and discrimination of lymphoma and multiple myeloma using LIBS conducted on human serum samples in combination with LDA, quadratic discriminant analysis (QDA) and k nearest neighbor (kNN) classification [17]. Such work demonstrates that the blood-sample-based LIBS in combination with chemometric methods can be a quick, less-invasive and accurate diagnostic tool for human malignancies.
In this work, we will further extend the application of blood-sample-based LIBS technique for cancer diagnosis. Discrimination of lymphoma using LIBS conducted on whole blood samples is presented. The whole blood samples are used instead of serum samples, because they contain more constituents and are expected to provide more spectral signatures for the discrimination analysis. The LIBS spectra of the whole blood samples of lymphoma patients and healthy controls are compared and analyzed. Principal component analysis (PCA), LDA and kNN classification are used to build the discrimination models. Very good discrimination performances in terms of accuracy, sensitivity and specificity are achieved. The results show that the whole-blood-based LIBS technique assisted by chemometric methods can serve as a quick and accurate tool for diagnosis and discrimination of human malignancies.
2. Materials and methods
2.1 Whole blood sample preparation
Whole blood samples from 16 lymphoma patients registered in Department of Hematology, Harbin Medical University Cancer Hospital (HMUCH) and 17 healthy controls were collected and investigated in vitro. All the subjects involved in this work have signed informed consent in compliance with the Declaration of Helsinki. This clinical protocol was approved by the Clinical Research Ethics Committee of HMUCH. The lymphoma patients have been diagnosed by pathology in Department of Pathology, HMUCH. The extent of the disease was assessed with the four-stage Cotswolds modification of the Ann Arbor staging system. The numbers of patients developing at Stage I, Stage II, Stage III and Stage IV are two, five, two, and seven, respectively. One of them was first diagnosed and had not received any chemotherapy medication when the whole blood sample was collected. The other fifteen lymphoma patients were under chemotherapy when the whole blood samples were collected. The whole blood samples were drawn from the vein on the inner portion of the arm near the elbow of the subjects, and collected using EDTA-treated tubes to prevent blood clotting. After collection, the blood samples were kept in a 4 °C refrigerator until the LIBS measurements, which were performed within 48 hours after the sample collection.
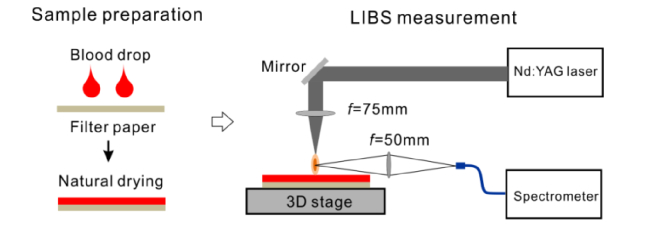
To facilitate the LIBS measurements, the liquid blood sample was transformed to solid form. For each subject, 50 μL whole blood sample was deposited uniformly onto a 2.5 × 1.25 cm2 quantitative filter paper using a pipettor. The average amount of the whole blood sample on the filter paper was 16 μLcm−2. The filter paper is a product made following Chinese national standard GB/T1914-2007. According to the standard, the main content of the filter paper is purified cellulose. The ash content of the filter paper is less than 0.01% in weight. After deposition, the filter paper was naturally dried for 20 minutes to remove the liquid content in the whole blood sample. To minimize contamination from the environment, these steps were performed in an air-filtered laminar flow cabinet.
2.2 LIBS experiments
The experimental setup for LIBS measurements on the whole blood samples is shown in Fig. 1. The dried filter paper was fixed onto a three-dimensional translation stage (OptoSigma). A Q-switched Nd:YAG laser was used to generate the plasma on the filter paper. The laser worked at the fundamental wavelength (λ = 1064 nm) with a pulse width of ~8 ns. The laser pulse energy was fixed to 73 mJ. The fluctuation of the laser pulse energy was within 1%. The LIBS experiments were conducted in the open air. The laser was focused onto the filter paper with a focal lens with f = 75 mm. The emission of the plasma was collected with a focal lens with f = 50 mm, coupled into a 4-in-1 fiber bundle and measured by a four-channel spectrometer (AvaSpec-ULS2048-4, Avantes). The spectrometer covers the wavelength range of 200-850 nm, with spectral resolution of 0.09-0.22 nm depending on the wavelength. Using a normal charge coupled device (CCD) as the detector, the minimum detection gate of the spectrometer was limited to 1.05 ms. Therefore, the detection gate was fixed to 2 ms to record all the emission of the plasma following the set delay time. The delay time was optimized to achieve good signal-to-noise ratio (SNR) and signal-to-background ratio (SBR) for the LIBS spectra. The optimized delay time was 5 μs relative to the onset of the plasma.
Fig. 1.
Experimental setup for LIBS measurements on whole blood samples.
The LIBS measurements were carried out following a “first collected, first tested” rule. Thus, the order of the measurements could be viewed as random. During the LIBS measurements, the filter paper was translated following a zigzag route with a step size of 200 μm. The experimental system was synchronized such that the laser ablated a fresh spot on the filter paper each time. For each sample, 100 LIBS spectra were collected, each obtained by averaging 25 independent spectra. In total, 3300 LIBS spectra were collected for the discrimination analysis. The reproducibility of the LIBS spectra was estimated by measuring the fluctuation of the shot-to-shot intensity ratios of Na D lines (588.99 nm and 589.59 nm) of the 25-time averaged spectrum data sets [16]. The reproducibility of the 100 spectra of each sample is less than 1% and the corresponding value across all the samples is about 6%. With the laser working at 5 Hz, the typical time to conduct the measurements for each sample was 8.33 minutes (corresponding to collection of 2500 independent spectra). The ablation area was about 1 cm2, and only 16 μL whole blood sample was consumed for each test.
2.3 Data analysis
For qualitative discrimination applications, the LIBS spectra are usually normalized to offset the spectral fluctuations caused by the variation of experimental and matrix conditions. The normalization is often processed relative to a specific line [11, 14, 15, 18]. Here, the CN B-X (0,0) band head at 388.34 nm [19] was used for normalization. This normalization scheme was used because we found that the CN emission was mainly contributed by the filter paper and was stable among all the LIBS measurements.
After normalization, 16 emission lines were selected for the discrimination analysis, including atomic and ionic lines of calcium (Ca), iron (Fe), potassium (K), magnesium (Mg) and sodium (Na), see Table 1. Here, the emission lines from hydrogen (H), oxygen (O) and nitrogen (N) were not included to avoid the potential interference caused by the elements in the surrounding atmosphere (mainly affecting O and N emissions) and inhomogeneous drying of the filter papers (mainly affecting H emission). The intensities of the selected lines were determined, forming a spectral data matrix of 3300 × 16. The atomic emissions of the pure filter paper were not subtracted because their intensities were much weaker than those of the blood analyte, and were stable during the measurements. The advantage of multivariate analysis taking into accounting emissions of several different elements over univariate analysis is that the discrimination models can avoid the potential confounding effect caused by benign diseases if they induce increase or decrease of the specific emission used for discrimination.
Table 1. The emission lines selected for the discrimination analysis.
| Emitting species | Wavelength (nm) |
|---|---|
| Ca I | 422.67, 526.56 |
| Ca II | 393.36, 396.85 |
| Fe I | 371.99, 373.49, 374.56, 374.95, 438.35 |
| K I | 766.49, 769.90 |
| Mg I | 516.73, 517.27 |
| Na I | 568.82, 588.99, 589.59 |
The spectral data matrix was standardized to make the mean and variance of each column to zero and unity, respectively. The advantage of standardization is to avoid the dominance of strong line features in the discrimination analysis over weak line features which might be equally important. Screening of abnormal spectral data was performed on the standardized data matrix. Each row of the data matrix was treated as a feature vector, which could be viewed as a point in the 16 dimensional space. The centroid of these feature points was calculated based on a squared Euclidean distance measure. For each class (lymphoma or healthy control), the mean md and standard deviation σd of the distances of the spectral feature points relative to the centroid were calculated. The spectral data vectors with distances out of the range defined by md ± 3σd were removed as the abnormal data. After screening the abnormal data, the spectral data matrix was re-standardized. PCA was applied to the re-standardized data matrix to reduce the dimensionality. The spectral data matrix was transformed to the principal component (PC) space. The PC scores (representations of the original spectral data matrix in the PC space) were taken for the discrimination analysis.
Two classification models were applied for the discrimination analysis, i.e., LDA classification and kNN classification. LDA is a supervised classification method which has been widely used for discrimination in the literature [15, 16, 20–24]. It separates two or more classes of data based on the assumption that different classes have different multivariate normal distributions of the predictor features. To determine the membership of an unknown sample, the LDA model calculates the posterior probabilities that the sample belongs to different classes. The sample is assigned to the class which has the maximum posterior probability. The kNN classifier is a type of instance-based supervised classification method. It has been applied for discrimination of polymeric products and Sudan dye adulterated spices [25–27]. It treats the feature vector as a point in the high dimensional space. The membership of a data point is determined by the majority vote of its neighbors [28]. A sample is assigned to the class most common among its k nearest neighbors following a specific distance metric. In this work, the Euclidean distance metric was used.
The 10-fold cross validation was applied to evaluate the discrimination models. The PC scores were randomly divided into 10 parts: 9 parts were used to train the discrimination model, while the left one part was used for validation. The cross validation process was repeated 10 times until all the 10 parts had been used for validation. The performances of the discrimination models were evaluated using the cross validation accuracy, sensitivity and specificity. The accuracy is defined as the percentage of correct predictions made by the model. The sensitivity is defined as TP/(TP + FN), i.e., the proportion of true positives those were correctly identified by the model among the actual positive (lymphoma class) samples. The specificity is defined as TN/(TN + FP), i.e., the proportion of true negatives those were correctly identified by the model among the actual negative (healthy control class) samples.
3. Results and discussion
3.1 Spectral analysis
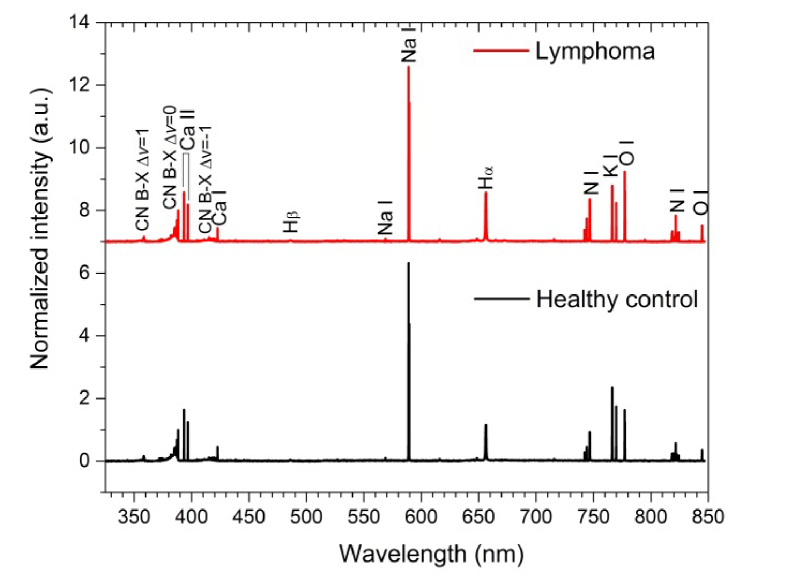
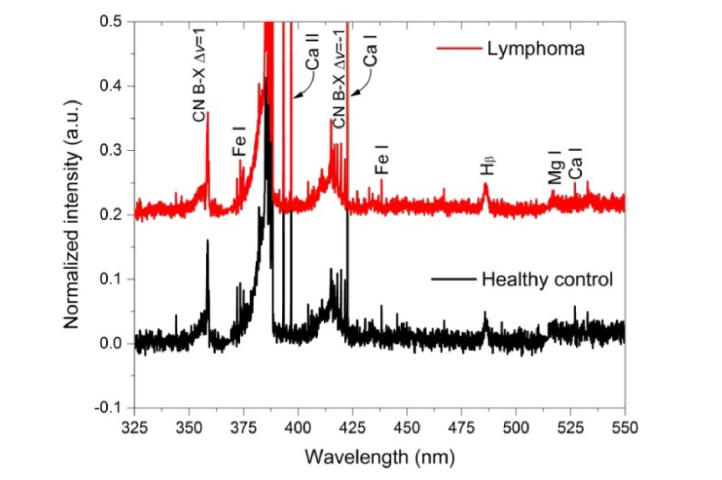
Shown in Fig. 2 are normalized average LIBS spectra of the whole blood samples of the lymphoma class and healthy control class in the spectral range 325-850 nm. It can be seen that the CN B-X band dominates the short wavelength region. Besides the CN B-X band, atomic line emissions can be observed. Strong emission lines are mainly from Ca, Na, K, H, O and N. Meanwhile, weak emission lines from Fe and Mg can also be observed (see the enlarged spectra shown in Fig. 3). Compared with the LIBS spectra of serum samples [17], more lines especially the Fe lines, are observed in the whole blood samples, providing more information for the discrimination analysis.
Fig. 2.
Normalized average LIBS spectra of the whole blood samples of the lymphoma class and healthy control class in the spectral range 325-850 nm.
Fig. 3.
Enlarged normalized average LIBS spectra of the whole blood samples of the lymphoma class and healthy control class in the spectral range 325-550 nm.
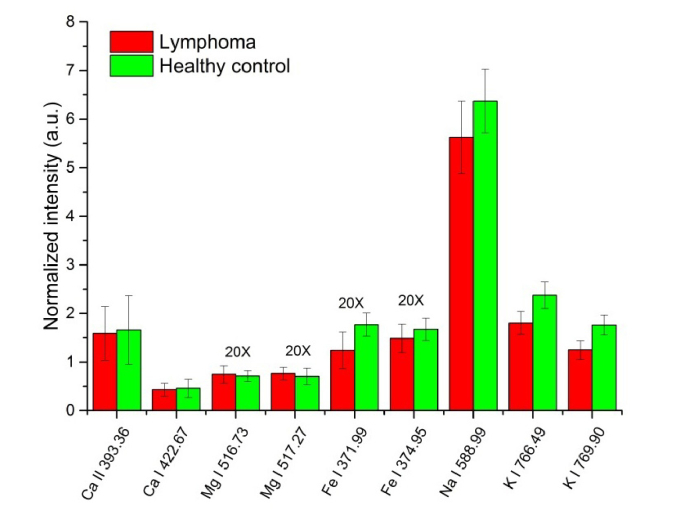
Shown in Fig. 4 is comparison of the normalized intensities of several LIBS emission lines of the whole blood samples of the lymphoma class and healthy control class. The shown intensities of Mg I 516.73 nm, Mg I 517.27 nm, Fe I 371.99 nm and Fe I 374.95 nm are multiplied by 20 folds. The error bars are the standard deviations of the intensities of independent spectra. It is shown that, the intensities of Fe I, Na I and K I lines of the lymphoma class are weaker than those of the healthy control class, indicating lower concentrations of these elements in the whole blood samples of the lymphoma class.
Fig. 4.
Comparison of the normalized intensities of several LIBS emission lines of the whole blood samples of the lymphoma class and healthy control class. The shown intensities of Mg I 516.73 nm, Mg I 517.27 nm, Fe I 371.99 nm and Fe I 374.95 nm are multiplied by 20 folds. The error bars are the standard deviations of the intensities of independent spectra.
The lower concentration of iron in the lymphoma class may be related with anemia suffered by these patients. Indeed, the laboratory tests showed that 10 of the 16 lymphoma patients were suffering anemia when the whole blood samples were collected. The exact reason for the lower concentrations of potassium and sodium in the whole blood samples of lymphoma patients is not clear. The lower potassium and sodium concentrations might be attributed to inadequate intake (due to poor nutrition and anorexia) or excessive gastrointestinal losses (due to vomiting and diarrhea) [29], which are common among cancer patients under chemotherapy. However, after a careful review of the clinical records, these patients only suffer minor anorexia and vomiting. The usage of bornelone and dexamethasone may lead to decrease of serum potassium. However, biochemistry tests showed that no electrolyte disorders including hyponatremia and hypokalemia were observed for these patients. The spectral intensities of the subject not receiving chemotherapy were comparable with those of the subjects receiving chemotherapy. In view of these facts, we thought that chemotherapy had limited effect on the element concentration changes. Higher calcium and magnesium concentrations have been reported by El-Hussein et al. [14] in breast and colorectal cancers tissues and by Han et al. [15] in melanoma tissues, which are attributed to increased cell proliferation in the malignant tissues. However, in this work, the intensities of Ca I and Mg I lines in the whole blood samples of the lymphoma class are comparable with those of the healthy control class. This may be because that the calcium and magnesium accumulation is only restricted to the solid malignant tissues, and is not manifest in the hematopoietic system.
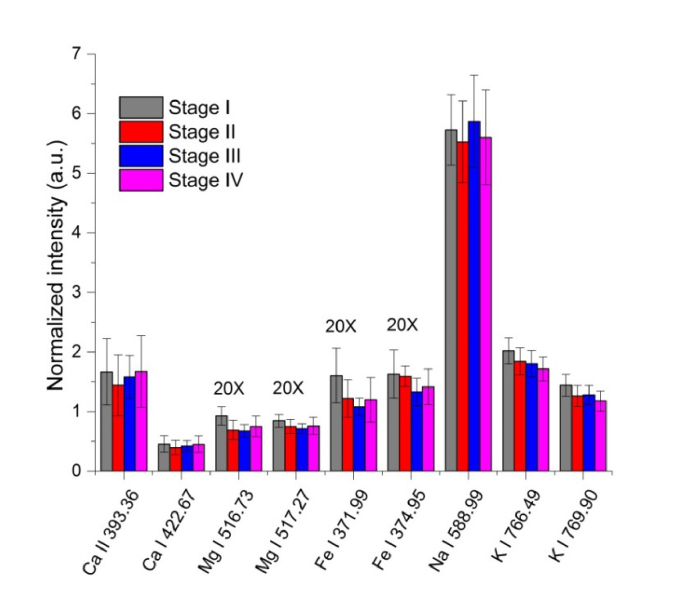
Shown in Fig. 5 is the correlation of normalized intensities of several LIBS emission lines of the whole blood samples of the lymphoma class with the cancer progression stages. The shown intensities of Mg I 516.73 nm, Mg I 517.27 nm, Fe I 371.99 nm and Fe I 374.95 nm lines are multiplied by 20 folds. The error bars are the standard deviations of the intensities of independent spectra. The intensities of Ca I and Na I lines are comparable among different cancer stages. However, it can be observed that the intensities of Mg I, Fe I and K I lines decrease loosely with the growing cancer stages. This demonstrates a clear correlation of the element concentration with the cancer stage, and indicates an underlying regulation mechanism of the element concentrations by the cancer.
Fig. 5.
Correlation of the normalized intensities of several LIBS emission lines of the whole blood samples of the lymphoma class with the cancer progression stages. The shown intensities of Mg I 516.73 nm, Mg I 517.27 nm, Fe I 371.99 nm and Fe I 374.95 nm are multiplied by 20 folds. The error bars are the standard deviations of the intensities of independent spectra.
The specific mechanism for the regulation of element concentrations in the blood by the cancer disease is still unclear, although many investigations have been reported on this topic [30–32]. Many research work indicates that trace elements play an important role in a number of biological processes by activating or inhibiting enzymes, by competing with other elements and metalloproteins for binding sites, or by affecting the permeability of cell membranes [30]. Since blood is the medium of transport of trace elements, it is generally believed that, any changes in the human body can trigger changes in the blood [31]. The variation of the trace element levels is either cause or the result of abnormal metabolism and proliferation of the cancers.
3.2 Principal component analysis
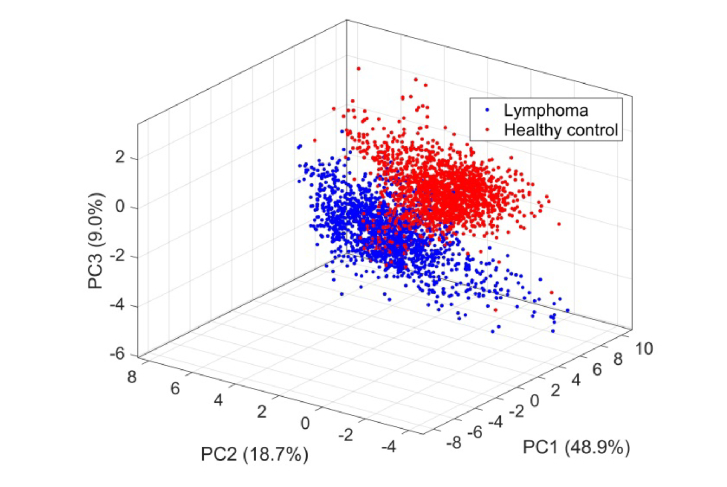
Due to the high similarities between the LIBS spectra of the lymphoma class and healthy control class, chemometric methods are applied to assist the discrimination analysis. After abnormal data screening, 60 spectra were removed as outliers. The left 3240 spectra, 1571 from the lymphoma class and 1669 from the healthy control class, were included for the discrimination analysis. PCA was performed on the 3240 × 16 spectral data matrix to reduce the dimensionality. The results showed that, the variance was mainly explained by the first several principal components (PCs). The first 4 PCs explained 85.1% of the total variance.
Shown in Fig. 6 is the scatter plot of the scores of the first 3 PCs for the lymphoma class and healthy control class. It can be seen that, although there is some overlapping between the data points of the two classes, the data points are generally separable.
Fig. 6.
Scatter plot of the scores of the first 3 PCs for the lymphoma class and healthy control class.
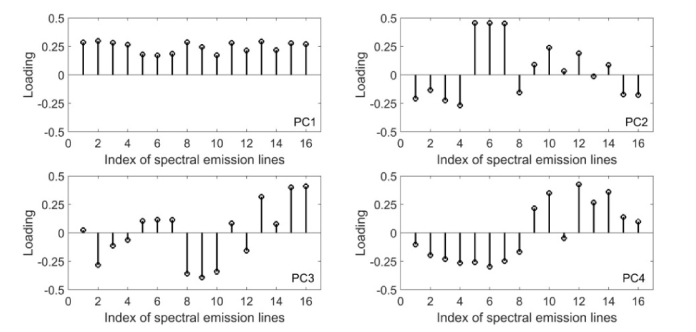
Shown in Fig. 7 are the loadings (coefficients) for PC1 to PC4 at different spectral lines. The spectral lines corresponding to the indices in the loading plots is shown in Table 2. It can be seen that the 4 PCs have different loading distributions. PC1 has equally important positive loadings at all the emission lines. PC2 is mainly determined by the positive loadings at Ca I and Ca II lines, and negative loadings at the Fe I lines. PC3 has large positive loadings at Na I 589.59 nm and K I lines, and large negative loadings at Fe I 438.35 nm and Mg I lines. PC4 is mainly contributed by the positive loadings of Na I and Mg I lines, and negative loadings of Fe I, Ca I and Ca II lines.
Fig. 7.
Loadings for PC1 to PC4 at different spectral emission lines. The spectral lines corresponding to the indices in the loading plots are shown in Table 2.
Table 2. The spectral lines corresponding to the indices in the loading plots.
| Index | Spectral lines | Index | Spectral lines | Index | Spectral lines | Index | Spectral lines |
|---|---|---|---|---|---|---|---|
| 1 | Fe I 371.99 nm | 5 | Ca II 393.36 nm | 9 | Mg I 516.73 nm | 13 | Na I 588.99 nm |
| 2 | Fe I 373.49 nm | 6 | Ca II 396.85 nm | 10 | Mg I 517.27 nm | 14 | Na I 589.59 nm |
| 3 | Fe I 374.56 nm | 7 | Ca I 422.67 nm | 11 | Ca I 526.56 nm | 15 | K I 764.49 nm |
| 4 | Fe I 374.95 nm | 8 | Fe I 438.35 nm | 12 | Na I 568.82 nm | 16 | K I 769.90 nm |
3.3 Discrimination analysis
LDA was used first to discriminate the lymphoma class from the healthy control class. The number of PCs retained for the discrimination analysis was determined based on the variances explained by the PCs. The PCs with variance greater than 1 were retained, corresponding to PC1 to PC4. The scores of PC1 to PC4 were used as predictor features for the discrimination analysis. Very good discrimination performances have been obtained using the LDA model. The 10-fold cross validation loss was 0.22%, and the corresponding accuracy was 99.78%. Shown in Table 3 is the confusion matrix of the LDA model. Only 5 out of 1571 observations of the lymphoma class, and 2 out of 1669 observations of the healthy control class were misclassified. The sensitivity and specificity for lymphoma were 0.9968 and 0.9988, respectively.
Table 3. Confusion matrix of the LDA model.
| True class | Lymphoma | 1566 | 5 |
| Healthy control | 2 | 1667 | |
| Lymphoma | Healthy control | ||
| Predicted class | |||
kNN classification was also used for the discrimination analysis. The scores of PC1 to PC4 were also used as predictor features. The k value was optimized to achieve the best discrimination performances. The best discrimination performances were obtained with k = 10. The 10-fold cross validation loss was 0.28% and the corresponding discrimination accuracy was 99.72%. Shown in Table 4 is the confusion matrix of the kNN model with k = 10. Only 4 out of 1571 observations of the lymphoma class, and 5 out of 1669 observations of the healthy control class were misclassified. The sensitivity and specificity for lymphoma were 0.9974 and 0.9970, respectively.
Table 4. Confusion matrix of the kNN model (k = 10).
| True class | Lymphoma | 1567 | 4 |
| Healthy control | 5 | 1664 | |
| Lymphoma | Healthy control | ||
| Predicted class | |||
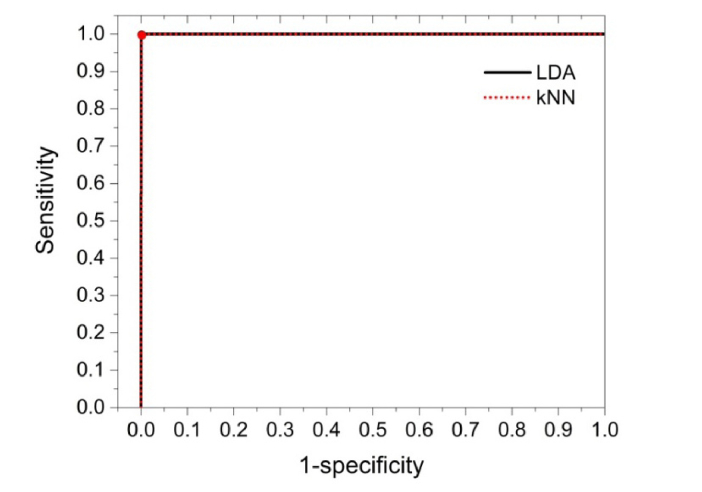
Shown in Fig. 8 are the receiver operating characteristic (ROC) curves obtained by the two models for discrimination of lymphoma. The working points of the models are indicated with the solid circles. The ROC curve plots sensitivity versus (1-specificity) with different discrimination thresholds. For an ideal discrimination model, both the sensitivity and specificity should approach 1, i.e., the working point should locate at the upper left corner of the ROC curve. It can be seen that, both discrimination models have shown almost ideal ROC properties, indicating good discrimination performances.
Fig. 8.
Receiver operating characteristic curves obtained by LDA and kNN models for discrimination of lymphoma. The working points of the models are indicated with the solid circles.
An interesting question is whether the whole-blood-based LIBS can discriminate the cancer patients at different stages to evaluate the progression of the disease. Discrimination analysis was then performed on the LIBS spectra of the cancer patients according to the stages of the cancer. The results showed that high discrimination losses up to 26.5% and 43.3% were obtained by the kNN model and LDA model, respectively. Therefore, for the subjects of this work, the discrimination ability for the progression of the cancer is limited. However, since the numbers of subjects in each stage are very limited, for example, only two at Stage I and Stage III, it deserves further investigation including more subjects in the model, and such investigations are currently in progress in our group.
4. Conclusion and perspective
In this work, discrimination of lymphoma using LIBS conducted on whole blood samples has been presented. The LIBS spectra of the whole blood samples of the lymphoma patients and healthy controls have been obtained and compared. Chemometric methods, including PCA, LDA classification and kNN classification, have been used for the discrimination analysis. Both LDA and kNN models have shown very good discrimination performances with accuracy of over 99.7%, sensitivity over 0.996, and specificity over 0.997. This technique can report the discrimination result within 9 min (could be further shortened with high repetition laser system) consuming only 16 μL whole blood samples. The results demonstrate that the whole-blood-based LIBS technique assisted by chemometric methods can serve as a quick and accurate tool for diagnosis of human malignancies.
The whole-blood-based LIBS technique has many advantages over the conventional pathology technique. Using the routine clinically-available whole blood as the analyte, this technique can realize quick and less invasive diagnosis of human malignancies. It is very suitable for fast screening of potential malignancies for a large number of subjects. Meanwhile, this technique may be used for diagnosis of early-stage malignancies with no specific symptoms (such as the patients at Stage I and II in this work), which are difficult to detect using conventional techniques. With these merits, we believe this technique may help to reduce the morbidity and mortality of cancers.
The discrimination ability of this technique for progression of cancers at different stages has been preliminarily tested. Although the results are not ideal, it deserves further investigation with enlarged subjects in the model. Finally, it is fair to point out that the discrimination model may be potentially confounded by benign diseases such as anemia, inadequate intake or gastrointestinal losses, which may cause variation of concentration of specific element in the whole blood. However, it is believed that the occurrence of cancer is not related with only one or two specific elements, rather it is related with many types of elements. By using the discrimination models built based on multivariate analysis instead of univariate analysis, the confounding effect by other benign diseases can be reduced to a limited level. Yet, including benign disease controls in the model will help to improve the robustness of the discrimination models.
Acknowledgements
We acknowledge all the cancer patients and healthy volunteers for participating in this protocol.
Funding
Health and Family Planning Commission of Heilongjiang Province (2016-088); Haiyan Foundation of Harbin Medical University Cancer Hospital (JJQN2017-02); National Natural Science Foundation of China (61505040).
Disclosures
The authors declare that there are no conflicts of interest related to this article.
References and links
- 1.F. L. M. Ervik, J. Ferlay, L. Mery, I. Soerjomataram, and F. Bray, “Cancer Today.,” (International Agency for Research on Cancer, 2016), http://gco.iarc.fr/today/home, Accessed August 2, 2017.
- 2.World Health Organization, “Global Health Estimates 2015: Global Deaths by Cause, Age and Sex, 2000-2015,” http://www.who.int/healthinfo/global_burden_disease/en/, Accessed August 2, 2017.
- 3.Hahn D. W., Omenetto N., “Laser-Induced Breakdown Spectroscopy (LIBS), Part I: Review of Basic Diagnostics and Plasma-Particle Interactions: Still-Challenging Issues Within the Analytical Plasma Community,” Appl. Spectrosc. 64(12), 335–366 (2010). 10.1366/000370210793561691 [DOI] [PubMed] [Google Scholar]
- 4.Cremers D. A., Radziemski L. J., Handbook of Laser-Induced Breakdown Spectroscopy (John Wiley & Sons, Ltd, 2006). [Google Scholar]
- 5.Baudelet M., Yu J., Bossu M., Jovelet J., Wolf J.-P., Amodeo T., Fréjafon E., Laloi P., “Discrimination of microbiological samples using femtosecond laser-induced breakdown spectroscopy,” Appl. Phys. Lett. 89(16), 163903 (2006). 10.1063/1.2361270 [DOI] [Google Scholar]
- 6.Manzoor S., Moncayo S., Navarro-Villoslada F., Ayala J. A., Izquierdo-Hornillos R., de Villena F. J. M., Caceres J. O., “Rapid identification and discrimination of bacterial strains by laser induced breakdown spectroscopy and neural networks,” Talanta 121, 65–70 (2014). 10.1016/j.talanta.2013.12.057 [DOI] [PubMed] [Google Scholar]
- 7.Rehse S. J., Diedrich J., Palchaudhuri S., “Identification and discrimination of Pseudomonas aeruginosa bacteria grown in blood and bile by laser-induced breakdown spectroscopy,” Spectrochim. Acta B At. Spectrosc. 62(10), 1169–1176 (2007). 10.1016/j.sab.2007.07.008 [DOI] [Google Scholar]
- 8.Rehse S. J., Salimnia H., Miziolek A. W., “Laser-induced breakdown spectroscopy (LIBS): an overview of recent progress and future potential for biomedical applications,” J. Med. Eng. Technol. 36(2), 77–89 (2012). 10.3109/03091902.2011.645946 [DOI] [PubMed] [Google Scholar]
- 9.Singh V. K., Rai A. K., “Prospects for laser-induced breakdown spectroscopy for biomedical applications: a review,” Lasers Med. Sci. 26(5), 673–687 (2011). 10.1007/s10103-011-0921-2 [DOI] [PubMed] [Google Scholar]
- 10.Samek O., Telle H. H., Beddows D. C. S., “Laser-induced breakdown spectroscopy: a tool for real-time, in vitro and in vivo identification of carious teeth,” BMC Oral Health 1(1), 1–9 (2001). 10.1186/1472-6831-1-1 [DOI] [PMC free article] [PubMed] [Google Scholar]
- 11.Kanawade R., Mehari F., Knipfer C., Rohde M., Tangermann-Gerk K., Schmidt M., Stelzle F., “Pilot study of laser induced breakdown spectroscopy for tissue differentiation by monitoring the plume created during laser surgery — An approach on a feedback Laser control mechanism,” Spectrochim. Acta B At. Spectrosc. 87, 175–181 (2013). 10.1016/j.sab.2013.05.012 [DOI] [Google Scholar]
- 12.Mehari F., Rohde M., Kanawade R., Knipfer C., Adler W., Klämpfl F., Stelzle F., Schmidt M., “Investigation of the differentiation of ex vivo nerve and fat tissues using laser-induced breakdown spectroscopy (LIBS): Prospects for tissue-specific laser surgery,” J. Biophotonics 9(10), 1021–1032 (2016). 10.1002/jbio.201500256 [DOI] [PubMed] [Google Scholar]
- 13.Kumar A., Yueh F.-Y., Singh J. P., Burgess S., “Characterization of malignant tissue cells by laser-induced breakdown spectroscopy,” Appl. Opt. 43(28), 5399–5403 (2004). 10.1364/AO.43.005399 [DOI] [PubMed] [Google Scholar]
- 14.El-Hussein A., Kassem A. K., Ismail H., Harith M. A., “Exploiting LIBS as a spectrochemical analytical technique in diagnosis of some types of human malignancies,” Talanta 82(2), 495–501 (2010). 10.1016/j.talanta.2010.04.064 [DOI] [PubMed] [Google Scholar]
- 15.Han J. H., Moon Y., Lee J. J., Choi S., Kim Y.-C., Jeong S., “Differentiation of cutaneous melanoma from surrounding skin using laser-induced breakdown spectroscopy,” Biomed. Opt. Express 7(1), 57–66 (2015). 10.1364/BOE.7.000057 [DOI] [PMC free article] [PubMed] [Google Scholar]
- 16.Melikechi N., Markushin Y., Connolly D. C., Lasue J., Ewusi-Annan E., Makrogiannis S., “Age-specific discrimination of blood plasma samples of healthy and ovarian cancer prone mice using laser-induced breakdown spectroscopy,” Spectrochim. Acta B At. Spectrosc. 123, 33–41 (2016). 10.1016/j.sab.2016.07.008 [DOI] [Google Scholar]
- 17.Chen X., Li X., Yu X., Chen D., Liu A., “Diagnosis of human malignancies using laser-induced breakdown spectroscopy in combination with chemometric methods,” Spectrochim. Acta B At. Spectrosc. 139, 63–69 (2018). 10.1016/j.sab.2017.11.016 [DOI] [Google Scholar]
- 18.Moncayo S., Rosales J. D., Izquierdo-Hornillos R., Anzano J., Caceres J. O., “Classification of red wine based on its protected designation of origin (PDO) using Laser-induced Breakdown Spectroscopy (LIBS),” Talanta 158, 185–191 (2016). 10.1016/j.talanta.2016.05.059 [DOI] [PubMed] [Google Scholar]
- 19.Pearse P., Gaydon A., The Identification of Molecular Spectra (Chapman and Hall Ltd., London, 1976). [Google Scholar]
- 20.Colao F., Fantoni R., Ortiz P., Vazquez M., Martin J., Ortiz R., Idris N., “Quarry identification of historical building materials by means of laser induced breakdown spectroscopy, X-ray fluorescence and chemometric analysis,” Spectrochim. Acta B At. Spectrosc. 65(8), 688–694 (2010). 10.1016/j.sab.2010.05.005 [DOI] [Google Scholar]
- 21.Goode S. R., Morgan S. L., Hoskins R., Oxsher A., “Identifying alloys by laser-induced breakdown spectroscopy with a time-resolved high resolution echelle spectrometer,” J. Anal. At. Spectrom. 15(9), 1133–1138 (2000). 10.1039/b002190n [DOI] [Google Scholar]
- 22.Vítková G., Novotný K., Prokeš L., Hrdlička A., Kaiser J., Novotný J., Malina R., Prochazka D., “Fast identification of biominerals by means of stand-off laser-induced breakdown spectroscopy using linear discriminant analysis and artificial neural networks,” Spectrochim. Acta B At. Spectrosc. 73, 1–6 (2012). 10.1016/j.sab.2012.05.010 [DOI] [Google Scholar]
- 23.Vítková G., Prokeš L., Novotný K., Pořízka P., Novotný J., Všianský D., Čelko L., Kaiser J., “Comparative study on fast classification of brick samples by combination of principal component analysis and linear discriminant analysis using stand-off and table-top laser-induced breakdown spectroscopy,” Spectrochim. Acta B At. Spectrosc. 101, 191–199 (2014). 10.1016/j.sab.2014.08.036 [DOI] [Google Scholar]
- 24.Kemsley E. K., Ruault S., Wilson R. H., “Discrimination between Coffea arabica and Coffea canephora variant robusta beans using infrared spectroscopy,” Food Chem. 54(3), 321–326 (1995). 10.1016/0308-8146(95)00030-M [DOI] [Google Scholar]
- 25.Aquino F. W. B., Pereira-Filho E. R., “Analysis of the polymeric fractions of scrap from mobile phones using laser-induced breakdown spectroscopy: Chemometric applications for better data interpretation,” Talanta 134, 65–73 (2015). 10.1016/j.talanta.2014.10.051 [DOI] [PubMed] [Google Scholar]
- 26.Di Anibal C., Rodriguez M. S., Albertengo L., “UV-visible spectroscopy and multivariate classification as a screening tool to identify adulteration of culinary spices with Sudan I and blends of Sudan I + IV dyes,” Food Anal. Methods 7(5), 1090–1096 (2014). 10.1007/s12161-013-9717-2 [DOI] [Google Scholar]
- 27.Godoi Q., Leme F. O., Trevizan L. C., Pereira Filho E. R., Rufini I. A., Santos D., Jr, Krug F. J., “Laser-induced breakdown spectroscopy and chemometrics for classification of toys relying on toxic elements,” Spectrochim. Acta B At. Spectrosc. 66(2), 138–143 (2011). 10.1016/j.sab.2011.01.001 [DOI] [Google Scholar]
- 28.Witten I. H., Frank E., Hall M. A., Data Mining: Practical Machine Tools and Techniques (Elsevier Inc., 2011). [Google Scholar]
- 29.Rosner M. H., Dalkin A. C., “Electrolyte disorders associated with cancer,” Adv. Chronic Kidney Dis. 21(1), 7–17 (2014). 10.1053/j.ackd.2013.05.005 [DOI] [PubMed] [Google Scholar]
- 30.Huang Y.-L., Sheu J.-Y., Lin T.-H., “Association between oxidative stress and changes of trace elements in patients with breast cancer,” Clin. Biochem. 32(2), 131–136 (1999). 10.1016/S0009-9120(98)00096-4 [DOI] [PubMed] [Google Scholar]
- 31.Pasha Q., Malik S. A., Shah M. H., “Statistical analysis of trace metals in the plasma of cancer patients versus controls,” J. Hazard. Mater. 153(3), 1215–1221 (2008). 10.1016/j.jhazmat.2007.09.115 [DOI] [PubMed] [Google Scholar]
- 32.Pories W. J., van Rij A. M., Mansour E. G., Flynn A., “Trace element profiles in cancer patients,” Biol. Trace Elem. Res. 1(3), 229–241 (1979). 10.1007/BF02783817 [DOI] [PubMed] [Google Scholar]


