Abstract
The optical clearing method has been widely used for different spectral ranges where it provides tissue transparency. In this work, we observed the enhanced penetration of the terahertz waves inside biological samples (skin, kidney, and cornea) treated with glycerol solutions inducing changes of optical and dielectric properties. It was supported by the observed trend of free-to-bound water ratio measured by the nuclear magnetic resonance (NMR) method. The terahertz clearing efficiency was found to be less for diabetic samples than for normal ones. Results of the numerical simulation proved that pulse deformation is due to bigger penetration depth caused by the reduction of absorption and refraction at optical clearing.
OCIS codes: 170.4580 Optical diagnostics for medicine, (300.6495) Spectroscopy, terahertz; (170.3660) Light propagation in tissues
1. Introduction
Optical clearing immersion method provides temporal and reversible tissue transparency for optical diagnostics and therapy. The immersion solution creates an osmotic pressure on the tissue collagen matrix and cells membranes, thus activates tissue dehydration and partial replacement of interstitial water and cell cytoplasm by a biocompatible agent. This technique has been widely used to improve different optical imaging and spectroscopic methods including optical coherent tomography, Raman and fluorescent spectroscopy, multiphoton tomography and others for more than two decades [1–3] and only few studies were done for terahertz (THz) waves [4–7].
The THz spectroscopy and tomography are prospective tools for imaging of the tissue structure at normal and pathological states [8]. However, the mechanism of optical clearing in the THz frequency range has still been little studied and it is evidently different from those in the visible or NIR. For instance, one of the most important mechanisms of optical clearing in the visible / NIR range is reduction of scattering while in the THz range, the main reason for shallow penetration is strong water absorption due to the strong polarity of water molecules, and a role of scattering is not so evident. Advanced and prospective applications of the THz technologies in the field of medical imaging stem from the facts that THz radiation is highly sensitive to bound and free water content, and that it has a low scattering in biological media [9,10]. On the other hand, sensitivity to water limits penetration depth of the THz waves inside biological tissues to a few microns below the surface, narrowing a useful range of the THz radiation application to the superficial medical imaging and spectroscopy [11,12].
Hence, in vivo THz imaging is focused on the studies of the accessible body parts, such as skin, eye cornea, and teeth [4,13]. For example, experiments on the characterization of the refractive indices and absorption coefficients of human tooth enamel showed sufficient signal sensitivity to the variations in sample’s structure. Future implementation of the THz imaging systems for diagnostics of dental lesions and defects can potentially rid us of the hazards of frequent X-ray screening [14–16].
THz technologies used in skin studies include characterization of the THz properties of the epidermis, melanoma diagnostic research, wound and diabetes studies - to name a few.
A convincing difference between carcinomas of various etiologies and normal skin suggests that the THz imaging can be an effective diagnostic method [17,18]. Thus, in the experimental studies, the THz method could demonstrate sufficient sensitivity in differentiating dysplastic nevi from a malignant tissue, in performing histological analysis on paraffin embedded brain glioma tissues, and in demarcating tumor margins [18–23]. The results can be attributed to the sensitivity of THz radiation to the different degree of tissue hydration that is characteristic of various pathologies and appears in spectral properties of dielectric permittivity, refractive index, and absorption coefficient [14,18,24,25].
Also, the skin water content shows differential dynamics in diabetic versus non-diabetic samples [26]. The injurious effects of hyperglycemia were separated into macrovascular complications (coronary artery disease, peripheral arterial disease, and stroke) and microvascular complications (diabetic nephropathy, neuropathy, and retinopathy) [27,28]. When glucose is bound to a protein, the elasticity of the walls of the vessels decreases, they become brittle and are prone to destruction. Glycation induced changes of structural proteins in the skin are linked to the changes of free-to-bound water ratio, affecting tissue hydration. Since the greater skin water content is reported for diabetics’ samples, application of the THz technology for diabetes diagnostics research may be useful.
Furthermore, application of terahertz-based systems to study burn wounds reported some promising results [29,30]. A possibility to design a noncontact diagnostic technique for a burn depth analysis without distressing a patient, providing a clinician with quantitative clinical parameters as well as with a treatment progress report are obvious advantages. Dermatology and cosmetics industries are interested in obtaining quantitative characteristics of the stratum corneum hydration levels for verification and monitoring of the effectiveness of their products [30,31].
Last but not least, developing experimental models and protocols, sample preparation techniques, and signal processing methods for more accurate image acquisition and interpretation of the acquired signal are the actively investigated areas of the THz research and development [32–36]. Extraction of parameters and classifiers often requires solution of inverse dielectric permittivity problem as well as an adaptation of new statistical algorithms, for example independent, or principal component analyses [33,37].
However, a strong water absorption property of the biological tissues in the THz range remains to be a hugely limiting factor for further expansion of this technology in biomedical domain, requiring an approach for mitigating the effect of the fundamental constraint. The method of optical clearing, based on the reversible dehydration of biological tissues by means of hyperosmotic agents has proven itself to be useful in achieving a deeper penetration of the THz radiation into biological samples [14,38]. The question remains as to how degree of tissue hydration, and imaging depth can be manipulated.
The aim of this study is to investigate dependence both experimentally and theoretically the propagation depth and deformation of the waveform of THz radiation in the soft tissues on the degree of their hydration which is controlled by application of a hyperosmotic agent. Glycerol was selected as the most common hyperosmotic agent used for soft tissue dehydration. Mouse and rat skin was used to prove the concept of controlled dehydration and THz waveform modification. To prove further this concept free/bound water was measured in skin, kidney and cornea from diabetic animals by the nuclear magnetic resonance (NMR) method. Understanding water dynamics in biological media in response to the changes in the osmotic pressure can be achieved with NMR method. NMR fundamental parameters (T2, spin-spin relaxation time; T1, spin-lattice relaxation time; and diffusion coefficient) related to the amount of hydrogen in a sample are significantly altered in response to the changes in water states [39].
2. Materials and methods
2.1 Experimental animals and THz clearing agents
All experimental protocols used in this investigation were reviewed and approved by the Animal Care and Use Commission of the Institute of Experimental Medicine (Almazov National Medical Research Centre, the Ministry of Health of the Russian Federation, Saint-Petersburg, Russia).
The study was carried out with Wistar rats with the body mass 270 – 290 g (diabetic and non-diabetic experimental groups) and BALB/c mice with the body mass 25 – 30 g (only non-diabetic experimental group). To provide experimental diabetes mellitus in rats, we used Streptozotocin as a drug. Before the administration of the Streptozotocin, rats were kept on a high-fat diet for 40 days. For induction of experimental diabetes, male adult rats, weight 250–300 grams, 30 mg/kg of Streptozotocin were injected intraperitoneally. After that rats were on a high-fat diet for another 10 days. After, a glucose tolerance test (intraperitoneal injection of glucose 2 g / kg, with blood taken from the tail at 0, 15, 30, 60 and 120 min to determine the level of glucose and insulin in the blood plasma) was carried out. Streptozotocin-diabetic rats showed signs of diabetes: glucose level in the blood of diabetic rats exceeded that of the non-diabetic control ones. The averaged blood glucose concentration was 19.6 ± 0.2 mmol/l in control animal group and up to 27.7 ± 0.3 mmol/l for the group after Streptozotocin administration. The microvascular complications were characterized by the damage to small vessels of organs and tissue-capillaries, arterioles and venules.
Immediately after the animals had been subjected to the isoflurane anesthesia and was sacrificed. A biopsy of the skin from the back, as well as the whole kidney and the eye cornea from the animals of control group and Streptozotocin-diabetic one were obtained. Prior to the extraction of the skin samples, the hairs had been plucked out with fingers to make the skin area cleared. To increase permeability of the skin samples to the agent, the subdermal lipid layer was removed. The skin was further cut with a box cutter into smaller samples with a similar square area of about 1x1 cm2.
Glycerol (“Vecton”, Russia) was selected as the most common optical clearing agent whose optical clearing efficiency strongly depends on concentration [40] as a dehydration agent. The glycerol was dissolved in the saline (NaCl-0.9% solution, “Renewal”, Russia) to obtain 30%, 50%, and 70% concentrations. The actual agent concentrations were estimated with an Abbe refractometer (Anton Paar ABBEMAT 200, Germany) via refractive index measurements on the wavelength 598 nm.
The weight and the thickness of each sample were measured before each experiment. The weight has been measured on the analytical balance (“Satories”, Germany). Using the micrometer with a precision of 1 µm, the sample thickness was measured by inserting them in-between two polystyrene plates with known thickness. The same measurements were applied during treatments. In the ideal situation, all samples must be sliced into sections with uniform thickness. Skin and cornea samples were used without slicing. Several thinner slices of kidney samples are possible due to handling issues. The thicknesses of the samples were about 0.4 mm, so the THz wave is able to interact with the sample sufficiently. One by one, the samples were placed in a plastic cuvette filled up with an agent in such a way that the agent impregnated the sample from all sides. After holding the samples in the agent for 5 min, they were wiped gently with a tissue and mounted in the THz spectrometer or in the magnetic resonance analyzer. So the time for the sample preparation after the agent treatment on average was around 5 min. The weight and the thickness of each sample were measured again.
The flow chart of sample preparation time-scale is presented in the Table 1. The duration time for the samples transportation from IEM to ITMO University was 60 min. During this time, the samples were accurately being kept in the saline solution (0.9% NaCl) in the thermostat at about 20 °C, at a normal humidity and atmospheric pressure. During the same time (60 min) and conditions the sample was kept before the experiments by the NMR method.
Table 1. Flow chart of sample preparation time.
| Location | Time before experiment | Weighting | Thickness measurement | Impregnation by Glycerol solution | Wiping + weighting + thickness measurement + holding in the spectrometer | EchoMRI | THz-spectrometer |
|---|---|---|---|---|---|---|---|
| IEM | 60 min | 1 min | 1 min | 5 min | 5 min | 6-7 min | - |
| ITMO | 60 min | 1 min | 1 min | 5 min | 5 min | - | 7-8 min |
2.2 Measurement of total water content of samples with NMR method
Body tissue composition of animals was determined by nuclear magnetic resonance (NMR) method (“EchoMRI500”, Echo Medical Systems, US). This method estimates the total lean tissue, fat tissue, and water content. The 5-Gauss continuous magnetic field (0.5 mT) is fully concentrated inside the device, which measures tissue properties of live animals from 7 up to 500 grams with a measuring time of 0.5 - 3.2 min, water content sensitivity of 0.001 gram, automatic save in Excel file system and Access database. The EchoMRI system does not create images. Alternative antenna / sensor is used for samples with a mass below 7 grams, up to 0.5 grams. NRM method is well described elsewhere [41], where animal skin and subcutaneous fat were analyzed separately from the rest of the body.
Each piece was scanned with NMR method before submerging in a respective concentration of the glycerol solution and, within two minutes after holding the sample in the clearing agent for 5 min.
2.3 Measurement of the THz optical properties and dielectric permittivity of the tissue samples
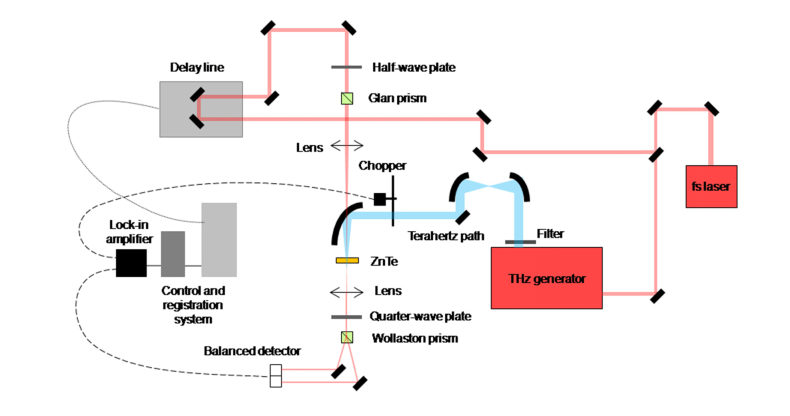
All measurements were carried out by using two terahertz time-domain spectrometer (THz-TDS) working in a transmission mode. By using two spectrometers, the authors intended to detect a possible divergence in the results obtained on the set-ups with different energies of the THz radiation. Prior to the experiments, calibration of both systems was performed using fluoropolymer. It was found that the absorption spectra measured independently were similar within a statistical error due to using of reference signal for calibration. One of the spectrometers used bulk InAs semiconductor in a constant magnetic field of 2.4 T as a generator [42,43]. The THz-TDS system pumped by femtosecond laser (“TeMa-100”, Avesta Ltd., Russia) with the active medium of Yb:KYW (ytterbium-doped potassium yttrium tungstate); λ = 1055 nm, pulse duration – 100 fs, repetition rate – 70 MHz, output power – 3.8 W). The THz radiation beam was collimated and focused on the electro-optical crystal by using a parabolic mirror. Polarization of probe beam has been fixed by Glan prism to be 45° to THz radiation polarization. Probe beam intersected with THz beam at electro-optical crystal – ZnTe (for 800 nm) or CdTe (for 1055 nm), where it’s polarization can be changed linearly by THz field, E, due to Pockels effect. Intersection point of the THz and short femtosecond pulses were regulated in time-domain by the optical delay line [44]. Induced change in polarization was measured out by the system of quarter-wave plate (λ/4), Wollaston prism, mirrors, and optical balanced detector (“Nirvana – 2017”, Newport Corp., USA). Lock-in amplification technique used to increase a signal-to-noise ratio. Amplified signal was transmitted to a computer via an analog-to-digital converter. Setup control was realized by the program environment LabVIEW from National Instruments. The parameters of the generated THz radiation were: spectral range from 0.010 to 1.500 THz with a maximum at 0.595 THz, average power – 30 µW, full width at half maximum (FWHM) – 0.45 ps. The power at the level of 10% was distributed between 0.075 and 0.098 THz. We called this setup “THz TDS 1” further in text.
By studying the kinetics of the dehydrated samples, it was found that the THz radiation was passing through non-dehydrated samples with a thickness about 0.5 mm very poorly. We have used a more powerful THz time-domain spectrometer (“THz TDS 2”) in the transmission regime for measuring optical and dielectric properties of the non-dehydrated samples with strong absorption which totally attenuated THz radiation of “THz TDS 1” setup. The mode-locked Ti:sapphire laser system with amplifier (“REUS-3m1k”, Avesta Ltd., Russia) was the optical source for THz generator for the “THz TDS 2”. Laser generated pulses with a central wavelength of 800 nm, pulse duration less than 35 fs, and pulse energy of 1 mJ at repetition rate of 1 kHz. Femtosecond pulses were directed onto the generator of THz radiation (“TERA-AX”, Avesta Ltd, Russia), which used an optical rectification of femtosecond radiation with tilted wave front in the MgO:LiNbO3 crystal. The THz radiation average power was 400 µW. The bandwidth of THz radiation covered the range from 0.1 to 2.0 THz.
The unified experimental scheme of the THz time-domain spectrometer is given in Fig. 1 . It includes following functional elements: a femtosecond laser source, a THz radiation generator, the sample, the detection system of THz pulses (electro-optical sampling detector consisting, quarter-wave plate, Wollaston prism, and optical balanced detector), and the delay line. The parameters for setups “THz TDS 1” and “THz TDS 2” are summarized in Table 2.
Fig. 1.
Experimental scheme of the THz time-domain spectrometer.
Table 2. The parameters for setups “THz TDS 1” and “THz TDS 2”.
| Parameter | THz TDS 1 | THz TDS 2 |
|---|---|---|
| Pump laser wavelength, nm | 1055 | 800 |
| Pump pulse duration, fs | 100 | 35 |
| Pump laser average power, W | 0.97 | 1.10 |
| Pulse repetition rate, kHz | 72 000 | 1 |
| THz source | InAs in 2.4 T magnet field | MgO:LiNbO3 |
| THz average power, µW | 48 | 400 |
| Pulse duration FWHM, ps | 0.51 | 0.33 |
| Spectral range at 10% level, THz | 0.08 ÷ 1.34 | 0.17 ÷ 1.66 |
| SNR | 32 | 38 |
| Dynamic range | 500 | 50 |
Both THz TDS spectrometers registered two THz pulses: one that passed through a sample and the other that did not and used as a reference signal without information about the sample. THz TDS spectrometers were able to measure similar optical properties of samples in a shared spectral range.
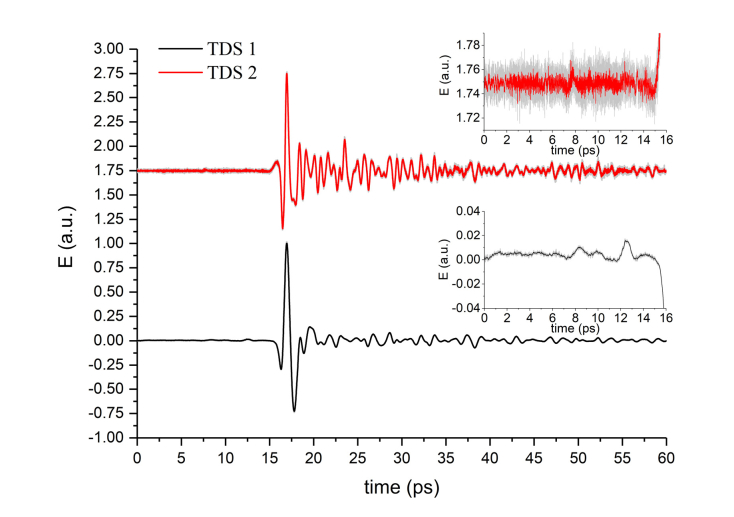
A high dynamic range “THz TDS 1” [see Fig. 2 ] system was used to detect the smallest changes of the THz pulse amplitude transmitted through the diabetic and non-diabetic rat kidney and cornea treated with glycerol (70%). However, the signal amplitude after passing the sample was too small for spectral analysis. Thus, a more powerful THz system – “THz TDS 2” – was needed to obtain a stronger time-domain THz signal for extraction of spectral properties. This was a trade-off between a less noisy and less powerful “THz TDS 1” and a high power and high noise “THz TDS 2” systems to obtain optical properties of a sample with a reasonable imprecision.
Fig. 2.
Reference THz signals in time-domain (setup TDS 1 with InAs generator – black line, setup TDS 2 with Mg:LiNbO3 generator – red line with offset to 1.75 level for convenience). Insets represent the enlarged area before THz pulses (zero amplitude area) to show the detection system noise.
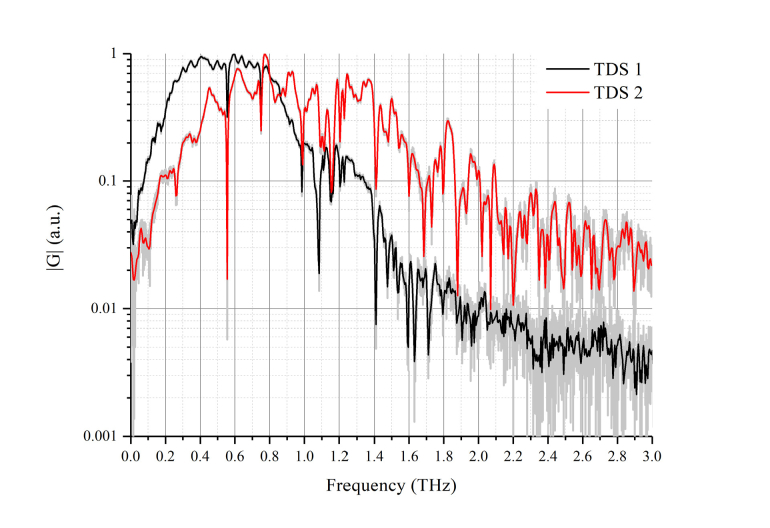
We could obtain the time dependence of the electric field Eref(t) [see Fig. 2] of the THz pulse to calculate the reference complex spectrum of the THz pulse Eref(ω) [see Fig. 3 ], by calculating the Fourier transform of the corresponding time sequence. By placing the required sample in the path of the THz radiation, it was possible to measure changes in the temporal form of the THz pulse, and complex spectrum of the transmitted through it radiation – Eobj(ω). The index of refraction, the absorption coefficient and the dielectric permittivity of the investigated samples could be calculated using two obtained complex spectra.
Fig. 3.
Reference THz signals in frequency-domain (setup TDS 1 with InAs generator – black line, setup TDS 2 with Mg:LiNbO3 generator – red line). Water vapor absorption lines are clearly seen at frequencies 0.56, 0.75, 0.99, 1.12, 1.17, 1.41 THz at both signals. Spectral amplitudes |G| are different due to different humidity at the measurement rooms. Range from 0.2 to 1.1 THz has high power spectral density |G| and low noise for both setups.
For the measurement of the optical and dielectric properties of samples, the sample under study was attached to a metal plate holder with a round hole of 5 mm in diameter through which it was irradiated with the THz radiation that was detected after passing the sample. Samples have been placed gently on the plates without any visible stretching and set vertically at the THz focal point with the radiation directed through the holes in the metal plates with sample. Samples awaiting imaging was kept in an air-tight container. Each of the samples was scanned four times. The measurements were performed at room temperature (≈20 °C) and the time of each measurement was about 7-8 min. Considering a THz wave as an optical wave, the most important property of material is the complex refractive index [45]. The index of refraction, nre, absorption coefficient, α, as well as real, εre, and imaginary, εim, part of dielectric permittivity was calculated by using the following formulas [46]:
| (1) |
| (2) |
| (3) |
| (4) |
| (5) |
where φS is the phase of a sample signal, φR is the phase of a reference signal, nim is the imaginary part of index of refraction, f is the frequency [Hz], d is the sample thickness [m], AR is the amplitude of a reference signal, AS is the amplitude of a sample signal.
3. Experimental results and discussion
3.1 Glycerol dehydration of skin samples studied by THz-TDS and NMR methods
Output parameters recorded with the EchoMRI (NMR) detector before and after immesion mouse sample into the dehydration agent are shown in Table 3. The results demonstrate that the Total Water (TW) readings in the excised skin samples decreased for all concentration of the glycerol agent. Also, it was observed that when a sample has already contained a low value of TW due to natural dryness, the dehydration efficiency was reduced, despite a relatively high glycerol concentration (up to 50%, see sample #2 in Table 3).
Table 3. Mouse normal skin sample parameters before (0%) and after glycerol treatment:
# is the sample number, Mg is the weight of the sample
LMg is the muscle tissue mass equivalent of all the sample parts containing water and excluding fat
LMg_corr is the dry substance of the sample
Fatg is the mass of all the fat molecules in the sample
FWg is the free water, TWg is the total water
TW,% is defined by Eq. (6)
TWchange is defined by Eq. (7)
H is the hydration ratio defined by Eq. (8).
| Registered parameters |
# / Glycerol solution |
||||||||
|---|---|---|---|---|---|---|---|---|---|
| #1/0% | #1/30% | #2/0% | #2/50% | #3/0% | #3/70% | #4/0% | #4/100% | ||
| Mg, g | 1.060 | 1.060 | 1.200 | 1.190 | 1.00 | 0.980 | 1.130 | 1.100 | |
| EchoMRI | LMg, g | 1.060 | 1.038 | 1.191 | 1.180 | 1.00 | 0.973 | 1.049 | 1.022 |
| LMg_corr, g | 0.352 | 0.400 | 0.763 | 0.543 | 0.371 | 0.412 | 0.300 | 0.530 | |
| Fatg, g | 0.000 | 0.000 | 0.000 | 0.046 | 0.000 | 0.012 | 0.000 | 0.000 | |
| FWg, g | 0.000 | 0.022 | 0.009 | 0.010 | 0.000 | 0.007 | 0.810 | 0.078 | |
| TWg, g | 0.764 | 0.675 | 0.544 | 0.490 | 0.705 | 0.492 | 0.789 | 0.574 | |
|
|
|||||||||
| Calculated parameters | |||||||||
| TW, % | 72.1 | 63.7 | 45.3 | 41.2 | 70.5 | 50.2 | 69.8 | 52.2 | |
| TWchange, % | - | 11.6 | - | 9.2 | - | 28.8 | - | 25.3 | |
| H % | 76.4 | 65.3 | 53.5 | 48.0 | 70.5 | 48.5 | 70.8 | 49.6 | |
| Mcal, g | 1.12 | 1.08 | 1.31 | 1.08 | 1.08 | 0.92 | 1.09 | 1.10 | |
The percentage of the TW value for each mouse normal skin sample was estimated using the following equation:
| (6) |
where TWg is the total water in a sample from the EchoMRI output datasheet, Mg is the sample weight registered on the balance. Calculated results for all samples are presented in the calculated parameters section of the Table 3. For evaluation of the intra-sample variation of the total water content as a result of the experimental manipulation, an equation descibing relative percent change was used:
| (7) |
where TWinitial is the total water reading in a sample before glycerol immersion, TWGlycerol is the total water registered after the glycerol application.
The hydration ratio (H) for inter-sample comparison of the water kinetics as a function of the immersion agent concentration is calculated using the following expression:
| (8) |
where FWg is the free water in the sample, LMg corresponds to the Lean value, estimated using the following: (TWg – FWg) + LMg_corr.
The weight of a mouse normal skin sample (Mcal) can be deduced from the sum of all output components from the EchoMRI results, and compared with a direct measurement of the weight on the scales. Combining all the contributing parameters, the formula for obtaining the weight of a sample in grams is:
| (9) |
where the undetectable substances such as bone mineral content, claws, hair, etc did not contribute to the NMR signal detected by the system. Systemic errors were considered negligible and discarded. Adding all the components together provided a sufficiently close match to the direct measurements of the samples’ weights (Mcal ≅ Mg) (Table 3).
The calculated data demonstrate that the Total Water, in %, and the hydration ratio (H) of the mouse skin sample decreased with glycerol treatment. The higher results have been achieved at 70% and 100% of glycerol concentrations.
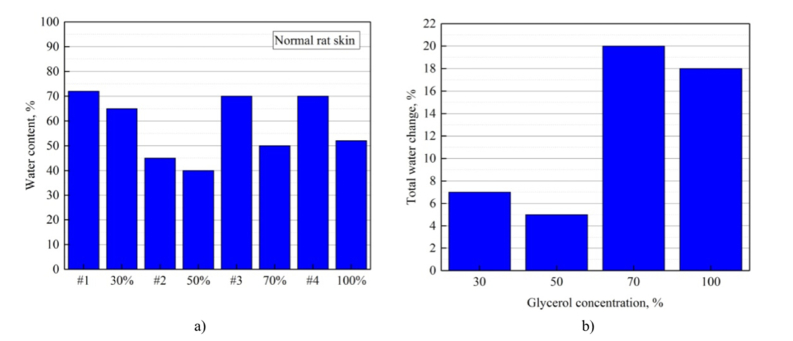
The data for the total water and the change of the total water in percentages TWchange (Eq. (7) from Table 3 are presented also in Fig. 4(a,b) . While the dehydration process was observed for all samples, and was especially effective for 70%- and 100%-agent concentrations. The water percent change for the sample #2 treated with 50% glycerol did not follow the predicted trend because of the initial over dryness (see Table 3).
Fig. 4.
The bar chart displaying percentage of the total water before and after each mouse normal skin sample was kept in glycerol for 5 min (a), the change of the total water in percentages TWchange (Eq. (7) (b). The data graphed from the Table 3.
In our experiments the thickness of the treated mouse skin samples increase systematically by 5μm (Table 4), which can be explained by the decrease of the transverse dimension [47], since the weight of the treated samples has been decreased as a result of water loss and overall tissue sample shrinkage (Table 3). The sample thickness increase did not depend on the glycerol concentration because the saturation was observed already at 30% of glycerol concentration during 5 min treatment [48].
Table 4. Mouse normal skin sample parameters before (0%) and after glycerol treatment.
# is sample number, D is the sample thickness.
| Registered parameters | # / Glycerol solution |
|||||||
|---|---|---|---|---|---|---|---|---|
| #1/0% | #1/30% | #2/0% | #2/50% | #3/0% | #3/70% | #4/0% | #4/100% | |
| D, mm | 0.490 | 0.495 | 0.510 | 0.515 | 0.430 | 0.435 | 0.450 | 0.455 |
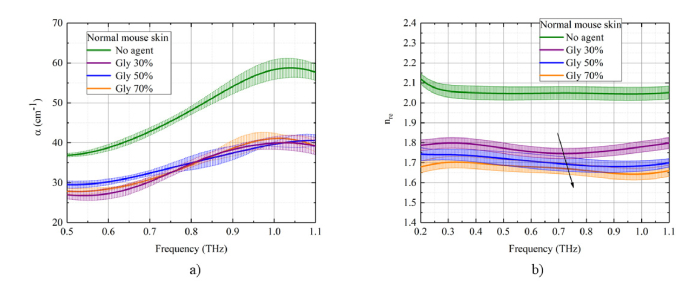
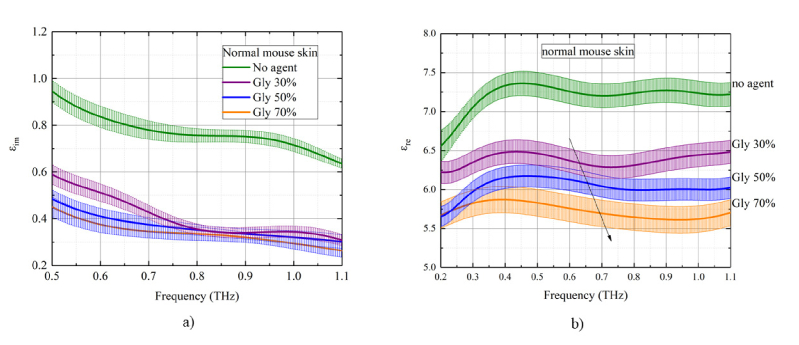
The index of refraction (real part), absorption coefficient, real and imaginary dielectric coefficients of the normal mouse skin plotted in Figs. 5 -6 for different concentrations of the glycerol in the solution as a function of THz frequency for transmission mode measurements. The values of coefficients are averaged and plotted against glycerol concentration. The most effective dependence on glycerol concentration is observed for the index of refraction and the real part of dielectric permittivity [Fig. 5(b), 6(b)]. There is a decrease of both nre and εre with increasing glycerol concentration in both measurement modes. The initial index of refraction for samples was in the range 2.0 ÷ 2.1. After treatment with glycerol solution, the index of refraction has decreased to 1.7 ÷ 1.8. Due to the osmotic pressure of the agent over the tissue sample, the dehydration process is induced with partial replacement of the interstitial water (or / and cell cytoplasm) diffusing outside by glycerol diffusing inside the sample. The glycerol presents almost the same index of refraction in the THz frequency range, 1.9 – 2.0 [7]. Therefore, we connected this effect to the decreasing of the total water in the sample on the background of the overall tissue sample shrinkage. The shrinkage is characterized by the densely packed organization of collagen fibers in the skin dermis that in its turn reduce scattering. The ability of the hyperosmotic agent to affect the free-to-bound water ratio translates into the concentration dependent change of the index of refraction, which, in its turn, results in the deeper penetration of the THz waves into the tissue due to the reduced back reflectance including Fresnel reflectance on the interfaces between the tissue layers. These results are confirmed by the observed trend in the measurements of the index of refraction obtained with the THz system.
Fig. 5.
The concentration dependence of optical and dielectric properties of the mouse skin samples (from the control mouse group) under the action of 30%-, 50%-, and 70%-glycerol solutions in the THz frequency range: a) absorption coefficient, b) index of refraction (real part). The standard deviation is shown as error bars.
Fig. 6.
The concentration dependence of optical and dielectric properties of the mouse skin samples (from the control mouse group) under the action of 30%-, 50%-, and 70%-glycerol solutions in the THz frequency range: a) imaginary and b) real part of dielectric permittivity. The standard deviation is shown as error bars.
It has been shown that the skin absorption coefficient decreases to about 10% - 30% after glycerol treatment [Fig. 5(a)]. This is also related to the total water loss by the skin samples, corresponding reduction of absorption coefficient and increase of tissue transmission for THz waves. From Fig. 5(a),6(a), it can be observed that the gradient of the magnitude of the absorption coefficient and the imaginary part of the dielectric coefficient with respect to a glycerol concentration is relatively low that can be connected to a short time of sample impregnation in glycerol which was 5 min.
3.2 Glycerol dehydration of kidney and cornea samples studied by THz-TDS and NMR
The total water content measurements performed on a biological sample using NMR detector, demonstrates the effect of the glycerol on the kinetics of water flux in a normal tissue (Table 2). Data from Table 5 indicates that water content of the rat kidney sample decreases with glycerol treatment in both diabetic and non-diabetic cases. Diabetic tissue has greater optical clearing efficiency because of the decreased initial transparency of glycated (diabetic) tissue. Structural modification of the tissue under pathological conditions induces the loss of the supporting axial fibrils, type I collagen, followed by the distortion of the extracellular matrix that, in turn, leads to the alteration of its optical properties [26].
Table 5. Rat non-diabetic and diabetic kidney sample parameters before (0%) and after glycerol treatment:
# is the sample number, M is the weight of the sample,
Lean is the muscle tissue mass equivalent of all the sample parts containing water and excluding fat;
Leancor is the is the dry substance of the sample
Fat is the is the mass of all the fat molecules in the sample,
FW is the free water, TW is the total water.
| Glycerol solution | EchoMRI |
|||||
|---|---|---|---|---|---|---|
| M, g | Lean, g | Leancor, g | Fat, g | FW, g | TW, g | |
| Non-diabetic | ||||||
| #1/0% | 0.053 | 0.062 | 0.014 | 0.00 | 0.052 | 0.048 |
| #2/100% | 0.051 | 0.050 | 0.049 | 0.00 | 0.047 | 0.045 |
| Diabetic | ||||||
| #3/0% | 0.062 | 0.172 | 0.122 | 0.00 | 0.000 | 0.050 |
| #4/70% | 0.043 | 0.022 | 0.022 | 0.03 | 0.000 | 0.029 |
In our experiments some increase of thickness of the treated rat kidney and cornea samples in diabetic and non-diabetic cases have been observed (Table 6), that can be explained by the tissue sample transverse shrinkage [26,47], since the weight of the treated samples has been decreased as a result of water loss.
Table 6. Rat diabetic and non-diabetic sample (kidney and cornea) parameters before (0%) and after glycerol treatment:
# is the sample number, D is the sample thickness.
| Registered parameters | # / Glycerol solution |
|||||||
|---|---|---|---|---|---|---|---|---|
| Kidney | Cornea | |||||||
| Non-diabetic | Diabetic | Non-diabetic | Diabetic | |||||
| #1/0% | #1/70% | #2/0% | #2/70% | #3/0% | #3/70% | #4/0% | #4/70% | |
| D, mm | 0.880 | 0.870 | 0.830 | 0.815 | 0.740 | 0.730 | 0.620 | 0.615 |
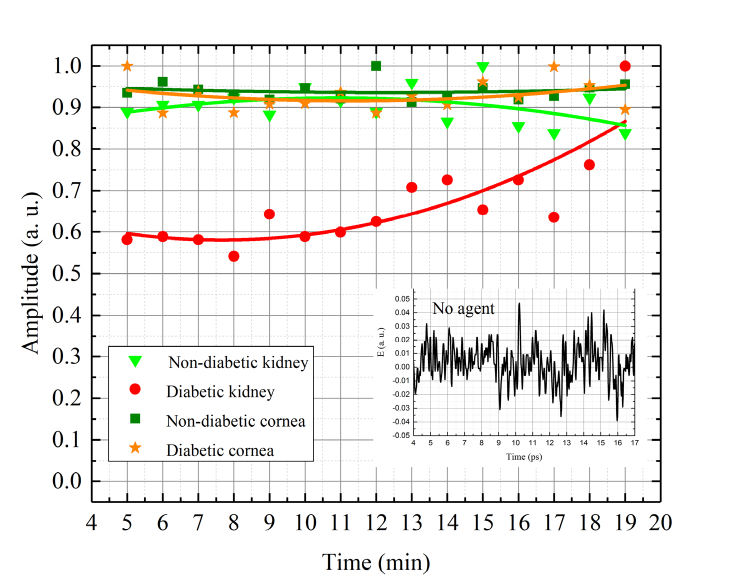
Figure 7 presents kinetics of the transmitted signal of the rat diabetic and non-diabetic kidney and cornea tissues treated with glycerol (70%) at the maximum of THz pulse. The time corresponds to that of THz irradiating the sample during 15 min. The time before irradiation was equal to 5 min of holding a sample in the agent, and 5 min of wiping the sample, and placing it in the THz spectrometer. Small graph on the Fig. 7 corresponds to the THz signal passing through samples that have not been treated with glycerol. In this case the signal level is equivalent to noises in the THz spectrometer. It is well seen that immersion treatments, as the tissue is submerged in the clearing solution, demonstrates a strong increase in the THz signal for all samples investigated. We have observed slower glucose diffusion in diabetic kidney sample compared to that for the non-diabetic one. Similar effect had been obtained in [26] and authors connected it to the changes of free and bound water content in diabetic tissue. After 12 min of our THz measurement the curve of diabetic kidney sample is increasing. This is due to the fact that a glycerol continues to diffuse into the tissue. At the same time, the curve of the non-diabetic kidney sample is decreasing after 12 min. It can be attributed to some tissue swelling and structural modification or dissociation of collagen. Structural modification of the collagen matrix and changes in the water fill factor can be achieved with glycerol optical clearing agent [26]. For diabetic and non-diabetic cornea, we have not seen any changes in the THz signal after the immersion treatment. It is assumed that the diffusion time for the glycerol treatment of the diabetic kidney is slower than that for the cornea and nondiabetic kidney because the diabetic kidney tissue is denser than all other studied tissues. Therefore, transmittance kinetics curves for the cornea (both nondiabetic and diabetic) and the nondiabetic kidney are already saturated (not showing temporal dependence) after the 5-minute glycerol treatment that balances the fluxes: water outside tissue and glycerol inside tissue. The diabetic kidney tissue instead showing increase of the transmittance from 0.6 to 1.0 for 5 to 19 min of treatment that confirms hindering of diffusion in glycated tissues in comparison with normal ones [48–50].
Fig. 7.
Kinetics of the transmitted signal of the rat diabetic and non-diabetic kidney and cornea tissues treated with glycerol (70%) at the maximum of THz pulse. The inset figure corresponds to the THz signal passed through the sample not to have been treated with glycerol (diabetic and non-diabetic kidney and cornea samples). Each symbol on the graph are the experimental measured data, lines are fitting curves.
4. Numerical simulation
The propagation dynamics of the pulsed THz radiation through a mouse skin was numerically simulated in the temporal and spectral domains. For the wavefront numerical propagation study we used THz Pulse Time Domain Holography method (THz PTDH) [51,52]. This technique allows the calculation of the THz complex field propagation to an arbitrary plane by the angular spectrum (AS) and Rayleigh-Sommerfeld convolution (RSC) method [53]. Moreover, optical parameters such as the index of refraction, nre(λ), absorption coefficient, α, and its dispersion behavior are also could be considered [54,55]. Thus, the angular spectrum method for the wavefront numerical propagation from the initial plane (x’,y’,0) to an arbitrary plane (x,y,z) is defined as follows:
| (10) |
where
| (11) |
is the angular spectrum in spatial frequencies (fx, fy).
Similarly, the field U(x,y,z) can be calculated using the Rayleigh-Sommerfeld convolution method:
| (12) |
where
| (13) |
where r is the distance between the object and registration planes:
| (14) |
The range of these methods application is determined by the inequality:
| (15) |
where ν is the frequency, c is the speed of light, N is the number of pixels in the discrete representation of the field, Δx is the pixel size. This equation establishes the relationship between the THz frequency and the distance z. According to this inequality, for v ≥ v0, the angular spectrum method is used, and for v < v0 the method of Rayleigh-Sommerfeld convolution is used. In the numerical simulation we used following parameters, determining critical cut-off frequency ν0: distance z was up to 435 µm, number of pixels N = 128, pixel size Δx = 390 µm, as soon as Δx is determined by screen size divided by N, where screen size is 50 mm. Estimating ν0 for average nre(λ)≈1.7 for 70%-glycerol we obtain ν0 ~0.004 THz. This indicates that in investigated frequency range 0.2-1.1 THz only the AS method is applied.
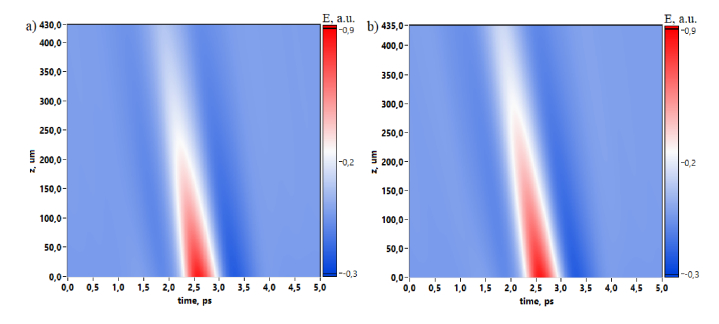
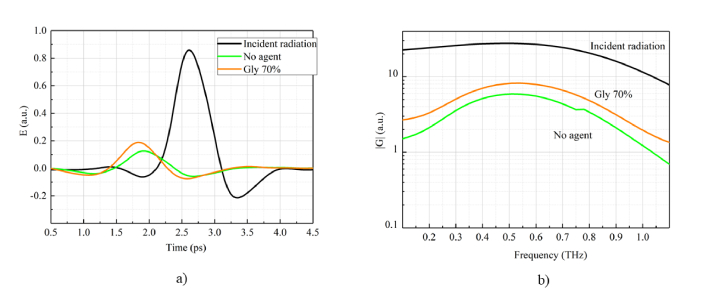
In numerical simulation we used experimentally registered reference THz pulse without interaction with the sample and we calculated its propagation through the mouse skin for two cases before and after the dehydration by glycerol. Figure 8 depicts the time-domain spatial evolution of the THz pulse, thus demonstrating the absorption influenced by dehydration. Pulse slope is caused by the phase shift on the temporal axis due to the wavefront propagation through the media.
Fig. 8.
2D spatial temporal evolution of THz pulse propagated through mouse skin before (a) and after (b) dehydration.
Considering THz pulses in 1D view for the incident and transmitted radiation one can see that dehydration [Fig. (9) , “Gly 70%”] leads to the absorption decrease and an additional phase shift due to the sample width increasing from 430 µm to 435 µm. This THz pulse behavior is also observed in the spectral domain, where spectral amplitude of the dehydrated skin exceeds non-dehydrated case in the spectral range 0.1-1.1 THz.
Fig. 9.
Numerically simulated incident and transmitted THz pulses before and after dehydration in temporal (a) and spectral (b) domain. “Incident radiation” (black line) corresponds to the cross-section at z = 0 mm in Fig. 8(a). “No agent” case (green line) corresponds to the cross-section at z = 430 µm in Fig. 8(a) and “Gly 70% (orange line)” is the cross-section at z = 435 µm in Fig. 8(b).
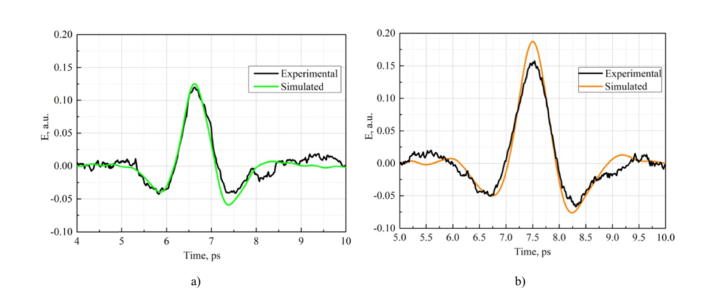
Simulation has provided a support that propagation distance increases from 430 µm to 435 µm due to sample shrinkage in transverse direction. We used experimentally obtained data about the thickness increasing of the sample after dehydration. We simulated the THz pulse behavior during propagation and we used a posteriori data about sample thickness: before dehydration it was 430 µm (see Table 4, sample #3/0%) and after dehydration it became 435 µm (see Table 4, sample #3/70%). Moreover, the index of refraction and absorption coefficient dependencies were also considered for non-glycerol and 70% glycerol cases. Thus, we can compare the simulated pulses after passing through the mouse skin with the experimentally measured data. Agreement between measured and simulated THz waveforms is confirmed by the comparison presented in Fig. 10 , where experimental and calculated pulses passed through the mouse skin coincide for both non-dehydrated (a) and dehydrated cases (b).
Fig. 10.
Experimental and numerically simulated THz pulses propagated through the mouse skin for non-dehydrated (a) and dehydrated (b) cases (70% glycerol solution).
5. Summary
Among the plethora of immersion agents, glycerol has been chosen as THz penetration-enhancing agent for this work. Various concentrations of glycerol in solutions (30%, 50%, 70%, and 100%) were used. It provides efficient tissue samples dehydration during 5 min of application. As a result, absorption coefficient of tissues in THz range decreases and transmittance increases. Therefore, a deeper penetration of THz waves into the tissue treated with the agent can be linked with the decrease of free-to-bound water ratio that decreases optical and dielectric properties of the tissue, including absorption coefficient and index of refraction. These results are confirmed by the observed trend in the measurements of the hydration ratio ((total water - free water) / lean) calculated for inter-sample comparisons of the water dynamics obtained with the NMR method.
The diabetic tissue, characterized by the protein glycation and, therefore, possesses weaker hydrogen bonds with water molecules has higher absorption property of the radiation in the THz frequency range then normal tissue. In this work, monitoring of diabetic tissue based on the differences of optical and kinetic properties as compared between normal and diabetic tissues treated with glycerol solution was conducted. The THz optical clearing efficiency is greater for non-diabetic sample than for diabetic one.
Experimental and numerical simulation results show a good agreement for both dehydrate and non-dehydrated tissues, proving that the pulse shape and amplitude change during propagation through the sample are due to decrease of sample absorption and refraction, and corresponding increase of radiation penetration depth. Pulse slope of the time-domain spatial evolution of a THz pulse is caused by the phase shift on the temporal axis due to the wavefront propagation through the sample.
Further studies directed to understand mechanisms interaction between normal / pathological tissues and immersion agents for improving terahertz biomedical imaging are desirable. The precise and safe concentration of an immersion agent is needed to be determined being applied to living tissues in vivo. Many of soft, liquid and hard tissues have not been studied yet for terahertz optical clearing, which can be prospective not only for diagnostics but also for terahertz thermal therapy. The ratio between tissue component concentrations, including cell nuclei and cytoplasm, as well as the changing of real and imaginary parts of refractive index, dielectric permittivity and Fresnel reflection on the tissue layer interfaces under the action of immersion agents are required to be clarified as well.
Funding
RFBR (17-00-00275 (17-00-00272)); Government of Russian Federation (074 – U01, project 5-100).
Disclosures
The authors declare that there are no conflicts of interest related to this article.
References and links
- 1.Tuchin V. V., Optical Clearing of Tissues and Blood (SPIE Press, 2006). [Google Scholar]
- 2.Zhu D., Larin K. V., Luo Q., Tuchin V. V., “Recent progress in tissue optical clearing,” Laser Photonics Rev. 7(5), 732–757 (2013). 10.1002/lpor.201200056 [DOI] [PMC free article] [PubMed] [Google Scholar]
- 3.Genina E. A., Bashkatov A. N., Sinichkin Yu. P., Yanina I. Yu., Tuchin V. V., “Optical clearing of biological tissues: prospects of application in medical diagnostics and phototherapy,” Jour. Biomed. Photon. En. 1(1), 22–58 (2015). 10.18287/JBPE-2015-1-1-22 [DOI] [Google Scholar]
- 4.Nazarov M., Shkurinov A., Tuchin V. V., Zhang X.-C., “Terahertz Tissue Spectroscopy and Imaging,” in Handbook of Photonics for Biomedical Science, Tuchin V. V., ed. (CRC Press, Taylor & Francis, 2010). [Google Scholar]
- 5.Nazarov M. M., Shkurinov A. P., Kuleshov E. A., Tuchin V. V., “Terahertz time-domain spectroscopy of biological tissues,” Quantum Electron. 38(7), 647–654 (2008). 10.1070/QE2008v038n07ABEH013851 [DOI] [Google Scholar]
- 6.Kolesnikov A. S., Kolesnikova E. A., Kolesnikova K. N., Tuchina D. K., Popov A. P., Skaptsov A. A., Nazarov M. M., Shkurinov A. P., Terentyuk A. G., Tuchin V. V., “THz monitoring of the dehydration of biological tissues affected by hyperosmotic agents,” Phys. Wave Phenom. 22(3), 169–176 (2014). 10.3103/S1541308X14030029 [DOI] [Google Scholar]
- 7.Kolesnikov A. S., Kolesnikova E. A., Popov A. P., Nazarov M. M., Shkurinov A. P., Tuchin V. V., “In vitro terahertz monitoring of muscle tissue dehydration under the action of hyperosmotic agents,” Quantum Electron. 44(7), 633–640 (2014). 10.1070/QE2014v044n07ABEH015493 [DOI] [Google Scholar]
- 8.Smolyanskaya O. A., Kravtsenyuk O. V., Panchenko A. V., Odlyanitskiy E. L., Guillet J. P., Cherkasova O. P., Khodzitsky M. K., “Study of blood plasma optical properties in mice grafted with Ehrlich carcinoma in the frequency range 0.1–1.0 THz,” Quantum Electron. 47(11), 1031–1040 (2017). 10.1070/QEL16383 [DOI] [Google Scholar]
- 9.Yang X., Zhao X., Yang K., Liu Y., Liu Y., Fu W., Luo Y., “Biomedical applications of terahertz spectroscopy and imaging,” Trends Biotechnol. 34(10), 810–824 (2016). 10.1016/j.tibtech.2016.04.008 [DOI] [PubMed] [Google Scholar]
- 10.Nazarov M. M., Cherkasova O. P., Shkurinov A. P., “Study of the dielectric function of aqueous solutions of glucose and albumin by THz time-domain spectroscopy,” Quantum Electron. 46(6), 488–495 (2016). 10.1070/QEL16107 [DOI] [Google Scholar]
- 11.Dhillon S. S., Vitiello M. S., Linfield E. H., Davies A. G., Hoffmann M. C., Booske J., Paoloni C., Gensch M., Weightman P., Williams G. P., Castro-Camus E., Cumming D. R. S., Simoens F., Escorcia-Carranza I., Grant J., Lucyszyn S., Kuwata-Gonokami M., Konishi K., Koch M., Schmuttenmaer C. A., Cocker T. L., Huber R., Markelz A. G., Taylor Z. D., Wallace V. P., Axel Zeitler J., Sibik J., Korter T. M., Ellison B., Rea S., Goldsmith P., Cooper K. B., Appleby R., Pardo D., Huggard P. G., Krozer V., Shams H., Fice M., Renaud C., Seeds A., Stöhr A., Naftaly M., Ridler N., Clarke R., Cunningham J. E., Johnston M. B., “The 2017 terahertz science and technology roadmap,” J. Phys. D Appl. Phys. 50(4), 043001 (2017). 10.1088/1361-6463/50/4/043001 [DOI] [Google Scholar]
- 12.Fan S., He Y., Ung B. S., Pickwell-MacPherson E., “The growth of biomedical terahertz research,” J. Phys. D Appl. Phys. 47(37), 374009 (2014). 10.1088/0022-3727/47/37/374009 [DOI] [Google Scholar]
- 13.Taylor Z. D., Garritano J., Sung S., Bajwa N., Bennett D. B., Nowroozi B., Tewari P., Sayre J. W., Hubschman J.-P., Deng S. X., Brown E. R., Grundfest W. S., “THz and mm-wave sensing of corneal tissue water content: In vivo sensing and imaging results,” IEEE Trans. Terahertz Sci. Technol. 5(2), 184–196 (2015). 10.1109/TTHZ.2015.2392628 [DOI] [PMC free article] [PubMed] [Google Scholar]
- 14.Nazarov M. M., Shkurinov A. P., Kuleshov E. A., Tuchin V. V., “Terahertz time-domain spectroscopy of biological tissues,” Quantum Electron. 38(7), 647–654 (2008). 10.1070/QE2008v038n07ABEH013851 [DOI] [Google Scholar]
- 15.Karagoz B., Altan H., Kamburoglu K., “Terahertz pulsed imaging study of dental caries,” in Proceedings of Medical Laser Applications and Laser-Tissue Interactions VII, 95420N (2015). [Google Scholar]
- 16.Zaytsev K. I., Kudrin K. G., Koroleva S. A., Fokina I. N., Volodarskaya S. I., Novitskaya E. V., Perov A. N., Karasik V. E., Yurchenko S. O., “Medical diagnostics using terahertz pulsed spectroscopy,” J. Phys. Conf. Ser. 486, 012014 (2014). 10.1088/1742-6596/486/1/012014 [DOI] [Google Scholar]
- 17.Pickwell E., Cole B. E., Fitzgerald A. J., Pepper M., Wallace V. P., “In vivo study of human skin using pulsed terahertz radiation,” Phys. Med. Biol. 49(9), 1595–1607 (2004). 10.1088/0031-9155/49/9/001 [DOI] [PubMed] [Google Scholar]
- 18.Yeo W. G., Nahar N. K., Hitchcock C. L., Park S., Gurel O., Sertel K., “Real-time THz imaging of human tissue characteristics and cancer margins,” in Proceedings of International Conference on Infrared, Millimeter, and Terahertz Waves, 1–2 (2013). 10.1109/IRMMW-THz.2013.6665781 [DOI] [Google Scholar]
- 19.Zaytsev K. I., Kudrin K. G., Karasik V. E., Reshetov I. V., Yurchenko S. O., “In vivo terahertz spectroscopy of pigmentary skin nevi: Pilot study of non-invasive early diagnosis of dysplasia,” Appl. Phys. Lett. 106(5), 053702 (2015). 10.1063/1.4907350 [DOI] [Google Scholar]
- 20.Meng K., Chen T. N., Chen T., Zhu L. G., Liu Q., Li Z., Li F., Zhong S. C., Li Z. R., Feng H., Zhao J. H., “Terahertz pulsed spectroscopy of paraffin-embedded brain glioma,” J. Biomed. Opt. 19(7), 077001 (2014). 10.1117/1.JBO.19.7.077001 [DOI] [PubMed] [Google Scholar]
- 21.Shi L., Shumyatsky P., Rodríguez-Contreras A., Alfano R., “Terahertz spectroscopy of brain tissue from a mouse model of Alzheimer’s disease,” J. Biomed. Opt. 21(1), 015014 (2016). 10.1117/1.JBO.21.1.015014 [DOI] [PMC free article] [PubMed] [Google Scholar]
- 22.Ji Y. B., Oh S. J., Kang S. G., Heo J., Kim S. H., Choi Y., Song S., Son H. Y., Kim S. H., Lee J. H., Haam S. J., Huh Y. M., Chang J. H., Joo C., Suh J. S., “Terahertz reflectometry imaging for low and high grade gliomas,” Sci. Rep. 6(1), 36040 (2016). 10.1038/srep36040 [DOI] [PMC free article] [PubMed] [Google Scholar]
- 23.Yamaguchi S., Fukushi Y., Kubota O., Itsuji T., Ouchi T., Yamamoto S., “Brain tumor imaging of rat fresh tissue using terahertz spectroscopy,” Sci. Rep. 6(1), 30124 (2016). 10.1038/srep30124 [DOI] [PMC free article] [PubMed] [Google Scholar]
- 24.Carneiro I., Carvalho S., Henrique R., Oliveira L., Tuchin V. V., “Simple multimodal optical technique for evaluation of free/bound water and dispersion of human liver tissue,” J. Biomed. Opt. 22(12), 1–10 (2017). 10.1117/1.JBO.22.12.125002 [DOI] [PubMed] [Google Scholar]
- 25.Zaytsev K. I., Gavdush A. A., Chernomyrdin N. V., Yurchenko S. O., “Highly Accurate in Vivo Terahertz Spectroscopy of Healthy Skin: Variation of Refractive Index and Absorption Coefficient Along the Human Body,” IEEE Trans. Terahertz Sci. Technol. 5(5), 817–827 (2015). 10.1109/TTHZ.2015.2460677 [DOI] [Google Scholar]
- 26.Tuchina D. K., Shi R., Bashkatov A. N., Genina E. A., Zhu D., Luo Q., Tuchin V. V., “Ex vivo optical measurements of glucose diffusion kinetics in native and diabetic mouse skin,” J. Biophotonics 8(4), 332–346 (2015). 10.1002/jbio.201400138 [DOI] [PubMed] [Google Scholar]
- 27.Fowler M. J., “Microvascular and macrovascular complications of diabetes,” Clin. Diabetes 26(2), 77–82 (2008). 10.2337/diaclin.26.2.77 [DOI] [Google Scholar]
- 28.Chawla A., Chawla R., Jaggi S., “Microvasular and macrovascular complications in diabetes mellitus: Distinct or continuum?” Indian J. Endocrinol. Metab. 20(4), 546–551 (2016). 10.4103/2230-8210.183480 [DOI] [PMC free article] [PubMed] [Google Scholar]
- 29.Dutta M., Bhalla A. S., Guo R., “THz Imaging of Skin Burn: Seeing the Unseen-An Overview,” Adv. Wound Care (New Rochelle) 5(8), 338–348 (2016). 10.1089/wound.2015.0685 [DOI] [PMC free article] [PubMed] [Google Scholar]
- 30.Taylor Z. D., Singh R. S., Bennett D. B., Tewari P., Kealey C. P., Bajwa N., Culjat M. O., Stojadinovic A., Lee H., Hubschman J. P., Brown E. R., Grundfest W. S., “THz medical imaging: In vivo hydration sensing,” IEEE Trans. Terahertz Sci. Technol. 1(1), 201–219 (2011). 10.1109/TTHZ.2011.2159551 [DOI] [PMC free article] [PubMed] [Google Scholar]
- 31.Png G. M., Choi J. W., Ng B. W.-H., Mickan S. P., Abbott D., Zhang X.-C., “The impact of hydration changes in fresh bio-tissue on THz spectroscopic measurements,” Phys. Med. Biol. 53(13), 3501–3517 (2008). 10.1088/0031-9155/53/13/007 [DOI] [PubMed] [Google Scholar]
- 32.Parrott E. P. J., Sy S. M. Y., Blu T., Wallace V. P., Pickwell-Macpherson E., “Terahertz pulsed imaging in vivo: measurements and processing methods,” J. Biomed. Opt. 16(10), 106010 (2011). 10.1117/1.3642002 [DOI] [PubMed] [Google Scholar]
- 33.Perraud J. B., Bou Sleiman J., Recur B., Balacey H., Simoens F., Guillet J. P., Mounaix P., “Liquid index matching for 2D and 3D terahertz imaging,” Appl. Opt. 55(32), 9185–9192 (2016). 10.1364/AO.55.009185 [DOI] [PubMed] [Google Scholar]
- 34.Sun Q., He Y., Parrott E. P. J., Macpherson E. P., “In vivo THz imaging of human skin: Accounting for occlusion effects,” in Proceedings of International Conference on Infrared, Millimeter, and Terahertz Waves, 1–2 (2016). 10.1109/IRMMW-THz.2016.7758883 [DOI] [Google Scholar]
- 35.He Y., Liu K., Au C., Sun Q., Parrott E. P. J., PickWell-MacPherson E., “Determination of terahertz permittivity of dehydrated biological samples,” Phys. Med. Biol. 62(23), 8882–8893 (2017). [DOI] [PubMed] [Google Scholar]
- 36.Bennett D. B., Li W., Taylor Z. D., Grundfest W. S., Brown E. R., “Stratified media model for Terahertz reflectometry of the skin,” IEEE Sens. J. 11(5), 1253–1262 (2011). 10.1109/JSEN.2010.2088387 [DOI] [Google Scholar]
- 37.Schelkanova I., Toronov V., “Analysis of independent components obtained from functional near infrared data,” Proc. SPIE 8222, 82220V (2012). 10.1117/12.908524 [DOI] [Google Scholar]
- 38.Löffler T., Siebert K., Czasch S., Bauer T., Roskos H. G., “Visualization and classification in biomedical terahertz pulsed imaging,” Phys. Med. Biol. 47(21), 3847–3852 (2002). 10.1088/0031-9155/47/21/324 [DOI] [PubMed] [Google Scholar]
- 39.Conlon T., Outhred R., “Water diffusion permeability of erythrocytes using an NMR technique,” Biochim. Biophys. Acta 288(2), 354–361 (1972). 10.1016/0005-2736(72)90256-8 [DOI] [PubMed] [Google Scholar]
- 40.Wen X., Mao Z., Han Z., Tuchin V. V., Zhu D., “In vivo skin optical clearing by glycerol solutions: mechanism,” J. Biophotonics 3(1-2), 44–52 (2010). 10.1002/jbio.200910080 [DOI] [PubMed] [Google Scholar]
- 41.Grillo C. A., Tamashiro K. L., Piroli G. G., Melhorn S., Gass J. T., Newsom R. J., Reznikov L. R., Smith A., Wilson S. P., Sakai R. R., Reagan L. P., “Lentivirus-mediated downregulation of hypothalamic insulin receptor expression,” Physiol. Behav. 92(4), 691–701 (2007). 10.1016/j.physbeh.2007.05.043 [DOI] [PMC free article] [PubMed] [Google Scholar]
- 42.Klatt G., Hilser F., Qiao W., Beck M., Gebs R., Bartels A., Huska K., Lemmer U., Bastian G., Johnston M. B., Fischer M., Faist J., Dekorsy T., “Terahertz emission from lateral photo-Dember currents,” Opt. Express 18(5), 4939–4947 (2010). 10.1364/OE.18.004939 [DOI] [PubMed] [Google Scholar]
- 43.Bespalov V. G., Gorodetskiĭ A. A., Denisyuk I. Yu., Kozlov S. A., Krylov V. N., Lukomskiĭ G. V., Petrov N. V., Putilin S. É., “Methods of generating superbroadband terahertz pulses with femtosecond lasers,” J. Opt. Technol. 75(10), 636–642 (2008). 10.1364/JOT.75.000636 [DOI] [Google Scholar]
- 44.Wu Q., Zhang X.-Ch., “Free-space electro-optic sampling of terahertz beams,” Appl. Phys. Lett. 67(24), 3523–3525 (1995). 10.1063/1.114909 [DOI] [Google Scholar]
- 45.Zhang X.-C., Xu J., Introduction to THz Wave Photonics, p. 246 (Academic, 2010). [Google Scholar]
- 46.Angeluts A. A., Balakin A. V., Evdokimov M. G., Esaulkov M. N., Nazarov M. M., Ozheredov I. A., Sapozhnikov D. A., Solyankin P. M., Cherkasova O. P., Shkurinov A. P., “Characteristic responses of biological and nanoscale systems in the terahertz frequency range,” Quantum Electron. 44(7), 614–632 (2014). 10.1070/QE2014v044n07ABEH015565 [DOI] [Google Scholar]
- 47.Tuchina D. K., Bashkatov A. N., Bucharskaya A. B., Genina E. A., Tuchin V. V., “Study of glycerol diffusion in skin and myocardium ex vivo under the conditions of developing alloxan-induced diabetes,” J Biomed Photonics Eng. 3(2), 020302 (2017). 10.18287/JBPE17.03.020302 [DOI] [Google Scholar]
- 48.Tuchina D. K., Bashkatov A. N., Genina E.A., Tuchin V.V., Biosensor for non-invasive optical monitoring of the pathology of biological tissues, Patent, Russian Federation No. 2633494, 12October2017.
- 49.Wolf G., Müller N., Busch M., Eidner G., Kloos C., Hunger-Battefeld W., Müller U. A., “Diabetic foot syndrome and renal function in type 1 and 2 diabetes mellitus show close association,” Nephrol. Dial. Transplant. 24(6), 1896–1901 (2009). 10.1093/ndt/gfn724 [DOI] [PubMed] [Google Scholar]
- 50.Wolf G., Müller N., Mandecka A., Müller U. A., “Association of diabetic retinopathy and renal function in patients with types 1 and 2 diabetes mellitus,” Clin. Nephrol. 68(08), 81–86 (2007). 10.5414/CNP68081 [DOI] [PubMed] [Google Scholar]
- 51.Petrov N. V., Kulya M. S., Tsypkin A. N., Bespalov V. G., Gorodetsky A. A., “Application of terahertz pulse time-domain holography for phase imaging,” IEEE Trans. Terahertz Sci. Technol. 6(3), 464–472 (2016). 10.1109/TTHZ.2016.2530938 [DOI] [Google Scholar]
- 52.Petrov N. V., Gorodetsky A. A., Bespalov V. G., “Holography and phase retrieval in terahertz imaging,” Proc. SPIE 8846, 88460S (2013). 10.1117/12.2023918 [DOI] [Google Scholar]
- 53.Balbekin N. S., Kulya M. S., Rogov P. Yu., Petrov N. V., “The modeling peculiarities of diffractive propagation of the broadband terahertz two-dimensional field,” Phys. Procedia 73, 49–53 (2015). 10.1016/j.phpro.2015.09.120 [DOI] [Google Scholar]
- 54.Kulya M. S., Balbekin N. S., Gredyuhina I. V., Uspenskaya M. V., Nechiporenko A. P., Petrov N. V., “Computational terahertz imaging with dispersive objects,” J. Mod. Opt. 64(13), 1283–1288 (2017). 10.1080/09500340.2017.1285064 [DOI] [Google Scholar]
- 55.Balbekin N. S., Kulya M. S., Petrov N. V., “Terahertz pulse time-domain holography in dispersive media,” Comput. Opt. 41(3), 348–355 (2017). 10.18287/2412-6179-2017-41-3-348-355 [DOI] [Google Scholar]


