Abstract
Chondroitin sulfate (CS), derived from cartilage tissues, is an important type of biomacromolecule. In this paper, the terahertz time-domain spectroscopy (THz-TDS) was investigated as a potential method for content detection of CS. With the increase of the CS content, the THz absorption coefficients of the CS/polyethylene mixed samples linearly increase. The refractive indices of the mixed samples also increase when the CS content increases. The extinction coefficient of CS demonstrates the THz frequency dependence to be approximately the power of 1.4, which can be explained by the effects of CS granular solids on THz scattering.
OCIS codes: (300.0300) Spectroscopy; (300.6495) Spectroscopy, terahertz
1. Introduction
Articular cartilage (AC) is a transparent connective tissue covering the articular connection surface. It is extremely important in all human activities involving bone joints. The change of chemical composition and structure is believed to be the major cause of cartilage degeneration and the related joint diseases [1, 2]. Therefore, the investigation of chemical composition of AC is essential. AC is mainly composed of type-II collagen, proteoglycan, water and a small amount of inorganic ions. Chondroitin sulfate (CS) is a sulfated glycosaminoglycan and an important structural component of AC. It is mostly living in combination with proteins, existed in the form of proteoglycan. The content and structure of chondroitin sulfate in different varieties, age and animal types is different [3]. As a kind of important biomacromolecules, CS has many important pharmacological and clinical applications [4]. For instance, it can decrease the blood lipids level and has a certain effect on preventing and treating cardiovascular diseases, so it is mainly used in clinical treatment of coronary heart disease, rheumatism, arthritis, nephritis etc [5, 6]. In addition, it can be used for adjuvant therapy of hearing impairment caused by streptomycin and hepatitis [7]. Therefore, the study and characterization of CS have drawn increasing attention of researchers. Conventional measurement technologies include chromatography [8], photometry [9], as well as infrared [10] and Raman spectroscopy [11].
Terahertz time-domain spectroscopy (THz-TDS) is a coherent and non-ionizing measurement technique that can measure the intensity and phase of the spectrum simultaneously. A remarkable advantage of THz-TDS over other techniques is its potential to provide spectral information and quantify the refractive index, absorption coefficient, dielectric constant of a sample under one test [12]. Many substances in the terahertz band show distinctive spectral signatures, which means terahertz spectrum could potentially be used to identify them. Moreover it can detect low frequency vibrational modes of biomolecules, and provide structural information of samples [13, 14]. All these features make THz-TDS particularly suited for spectroscopic investigations of AC.
To date, a variety of biomacromolecules (i.e. bovine serum albumin proteins and collagen) have been examined using THz-TDS, demonstrating that this technique is an excellent complement to conventional techniques [15]. However, no literature is available on the quantitative analysis of chondroitin sulfate content using THz-TDS. In this paper, the content detection of chondroitin sulfate by using THz-TDS was demonstrated, and the experimental results have shown that this technique can be applied to obtain spectral properties of CS.
2. Materials and methods
2.1 Sample preparation
Chondroitin Sulfate A powder was purchased from Sangon Biotech Co. Ltd (Shanghai, China) and the polyethylene powder (PE) was obtained from Sigma-Aldrich Group, China (Shanghai, China), whose purity are all above 99%. CS and PE powder was uniformly mixed in various proportions (1:0, 3:1, 1:1, 3:5, 1:3, 1:7, 0:1). The samples of each proportion were pressed by a tablet press into circular disk-shaped pellets, containing different quantities of the mixture (60mg, 80mg, 100mg, and 120mg). Each type was made into three samples, and each sample was measured at least three times. While all the circular pellets have a diameter of 13 mm, due to slight variations of the sample-making procedure, it is difficult to ensure that each group of samples has the same thickness. Therefore, each sample was measured at least ten times by a micrometer, whose accuracy is 1 um. The thickness parameter is shown in the Table 1. As polyethylene has a low and flat absorption spectrum in the terahertz band, it was employed as a passive filler and played a role of adhesion and dilution in the samples only.
Table 1. The mean thickness (mm) of nine pellet samples.
| Quality(mg) | Content Ratio(CS:PE) | ||||||
|---|---|---|---|---|---|---|---|
| 1:0 | 3:1 | 1:1 | 3:5 | 1:3 | 1:7 | 0:1 | |
| 60mg | 0.3176 | 0.3677 | 0.4397 | 0.4492 | 0.5133 | 0.5139 | 0.5949 |
| 80mg | 0.4313 | 0.5075 | 0.6024 | 0.6426 | 0.7087 | 0.7071 | 0.7762 |
| 100mg | 0.5051 | 0.5961 | 0.7308 | 0.7477 | 0.8289 | 0.8366 | 0.9625 |
| 120mg | 0.6156 | 0.7192 | 0.8765 | 0.9433 | 0.9664 | 1.0333 | 1.1442 |
2.2 Terahertz time-domain spectroscopy
THz-TDS were performed in transmission geometry using the T-Ray 5000 system (Advanced Photonix, Inc. USA). The THz pulse is generated by a biased photoconductive switch pumped by a femtosecond-pulsed laser beam with the center wavelength of 1064 nm. This femtosecond laser pulse has 80 fs duration and a 100 MHz repetition rate. The spectral bandwidth of the THz-TDS system is 0.1 to 3.5 THz, with a spectral resolution of 12.5 GHz, and its dynamic range can reach 70 dB. In the experiment, the sample was placed at the focal point of two high density polyethylene lenses. As water vapor has strong absorptions across the whole THz frequency range, the experimental apparatus including THz emitter, receiver as well sample frames were placed into a sealed container filled with dry nitrogen. The air humidity around the sample was controlled to 2%. The time domain waveforms of references and samples were acquired, and then the discrete Fourier transform was used to obtain the frequency-domain information of the terahertz transmission spectrum.
2.3 Data analysis method
The samples were studied by a terahertz time-domain spectroscopy system, which obtained the time-domain signal and the corresponding reference signal . The signal spectra and the reference spectra of the sample were obtained by Fourier transform of the time domain signal. In the experimental data analysis, the THz signals of empty sample holder and pure PE were both used as reference signal in the different processes. According to the THz optical parameters extraction model proposed by Duvillaret et al. [12, 16] (see Eqs. (1)-(3) below), the refractive index, absorption coefficient can be measured.
| (1) |
| (2) |
| (3) |
where and are amplitude ratio and phase difference between reference and sample THz electric fields, respectively. and are the refractive index and absorption coefficient of the sample. is the speed of light and is the thickness of sample.
3. Results and discussion
3.1 THz refractive index of CS
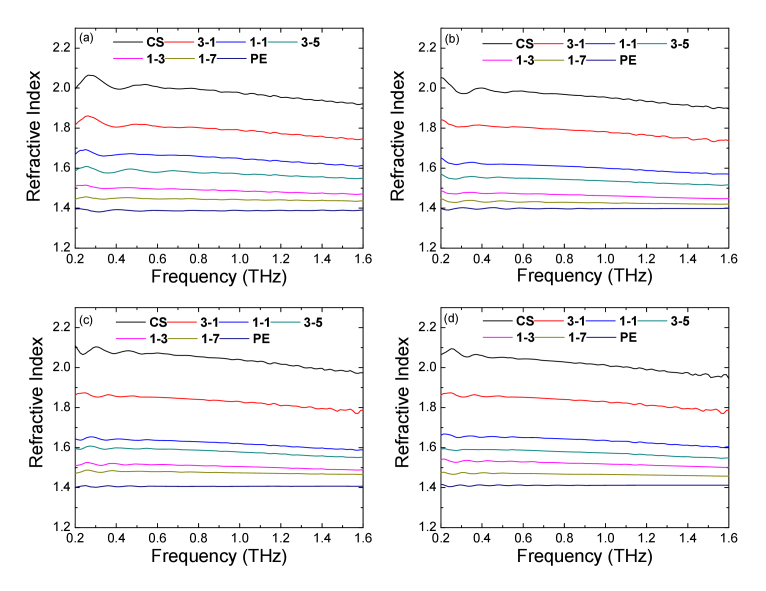
Figure 1 shows the refractive indices of samples with different CS concentrations. The THz signal of empty sample holder was used as reference signal. Samples containing different amounts of mixed powders are represented by Fig. 1(a), 1(b), 1(c), and 1(d). Within the frequency range of 0.2 THz-1.6 THz, the refractive index of pure CS is about 2.0 and the refractive index of pure PE is about 1.4, which shows good agreement with previous studies [17]. The mixed samples have the refractive indices between 1.4 and 2.0. In Fig. 1(c) and 1(d), the refractive indices of pure CS and 3-1 samples show some significant declines after 1.6 THz due to the strong THz signal attenuation in the thick samples.
Fig. 1.
Refractive indices for samples containing various amounts of the CS-PE mixed power. Total weight of pellet: (a) 60 mg, (b) 80 mg, (c)100 mg, and (d)120 mg.
3.2 THz absorption coefficient of CS
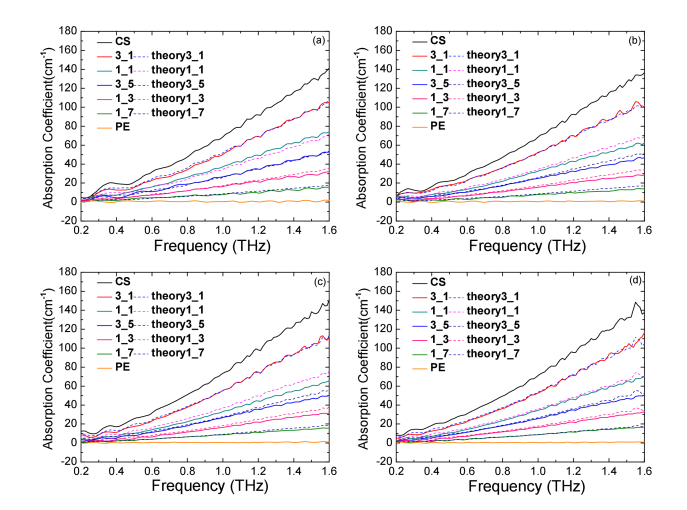
According to experimental measurements of the thickness and the spectral data of terahertz wave spectrum, the absorption coefficients of the samples were calculated. The THz signal of empty sample holder was applied as reference signal. Figure. 2 shows actual absorption coefficient curves (solid lines) and theoretical absorption coefficient curves (dotted lines) of seven samples. In order to obtain the theoretical absorption coefficient curves, we used the measured absorption coefficients of pure CS and PE powder as two references to calculate theoretical values for all mixtures following the linear relationship between the THz absorption coefficient and CS to PE ratio in the mixtures. All the legends in Fig. 1 represent the weight ratios of CS to PE. For example, 3-1 means the weight ratio of CS to PE is 3:1. The results demonstrate that the experimental absorption coefficient curves are in good agreement with the theoretical curves. Some errors may be caused by the nonuniformity of the powder mixture, or measurement errors [18]. The pure CS powder has an absorption coefficient of 140 cm−1 at 1.6 THz and the absorption coefficients of pure PE is close to 0 cm−1 over the whole THz frequency band considered here. The slopes of absorption coefficient curves of mixed samples gradually increase with increasing CS contents. The relationship between the slope of absorption coefficient curves and CS concentration is further discussed in the following section. The total weight of pellets has little effect on the THz absorption coefficients [Fig. 2(a)-2(d)]. The measurements on the samples with higher CS concentration and higher weight or larger thickness may have higher error at higher THz frequency range (i.e., beyond 1.6 THz) due to the strong THz signal attenuation.
Fig. 2.
Absorption coefficient in THz frequencies for samples containing various amounts of mixed PE and CS powder. Total weights of pellet: (a) 60 mg, (b) 80 mg, (c)100 mg, and (d)120 mg.
3.3 The relationship between the THz absorption coefficient and CS concentration at certain frequencies
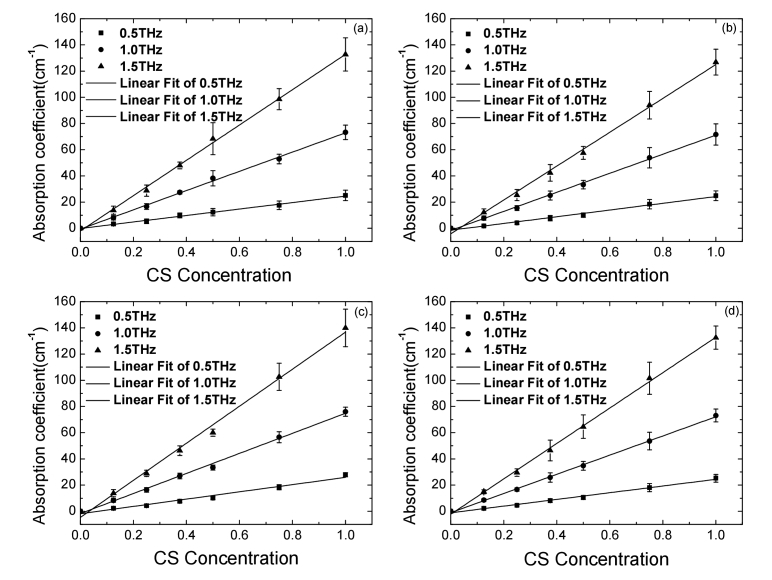
In order to investigate the relationship between THz absorption coefficient and CS concentration, the absorption coefficient of samples with different weight ratios of CS to PE at three selected frequencies (0.5, 1.0 and 1.5THz) were plotted. The THz signal of pure PE was applied as reference signal. The results show that the THz absorption coefficient of samples increases linearly as the CS concentration increases (see Fig. 3). The concentrations of CS and PE in the samples are given by:
| (4) |
where and are the weights of CS and PE in a given sample, and is the total weight of the pellet. and are the concentrations of CS and PE. The quantitative relationship between a material and its light absorption is governed by the basic law of light absorption (i.e. the Beer-Lambert-Bouguer Law). If the sample thickness is normalized, the absorption coefficient, , representing the material’s light absorption per unit thickness should be linearly proportional to the concentrations of attenuating species, which can be given by:
| (5) |
Where and represent the absorption coefficients of CS and PE; and represent the extinction coefficient of CS and PE, respectively. Compared to the CS, the THz attenuation contributed by PE is very low, so is assumed to be zero. Equation (5) is rewritten as:
Fig. 3.
THz absorption coefficient vs. CS concentration at 0.5 THz,1.0 THz and 1.5 THz. (a) 60 mg, (b) 80 mg, (c) 100 mg, and (d)120 mg.
| (6) |
Figure. 3 shows the relationship between the THz absorption coefficient and CS concentration in the mixed samples at three specific THz frequencies (i.e., 0.5 THz, 1.0 THz, and 1.5 THz). Linear curve-fittings are conducted to calculate the extinction coefficient in Eq. (6). The values of , and R2 of curve-fittings are listed in Table 2. The values of increase as the selected frequency increases. The values of R2 are all close to 1, thus affirming a linear relationship between absorption coefficient and CS concentration. The linear relationships between THz absorption coefficient and CS concentration at different THz frequencies can be utilized to quantitatively determine the CS concentration in the mixtures by using those “standard curves”.
Table 2. Values of and R2 at 0.5 THz, 1.0 THz, and 1.5 THz in different samples.
| Frequency | 60mg | 80mg | 100mg | 120mg | ||||
|---|---|---|---|---|---|---|---|---|
| R2 | R2 | R2 | R2 | |||||
| 0.5THz | 24.66 | 0.99 | 25.65 | 0.99 | 27.74 | 0.97 | 25.58 | 0.99 |
| 1.0THz | 73.41 | 1.00 | 72.66 | 1.00 | 76.58 | 1.00 | 73.17 | 1.00 |
| 1.5THz | 134.80 | 1.00 | 129.16 | 1.00 | 141.36 | 0.99 | 135.08 | 1.00 |
3.4 Relationship between the extinction coefficient of CS and the frequency from 0.2 THz to 1.6 THz
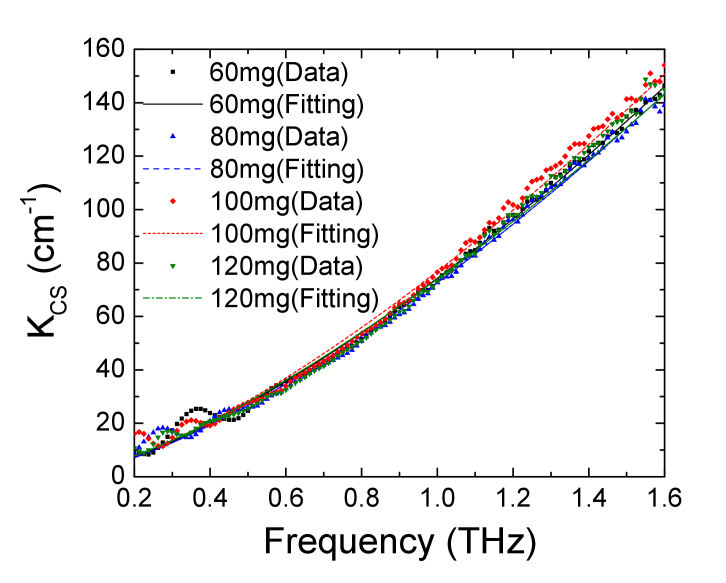
Actually, beside 0.5 THz, 1.0 THz and 1.5 THz, the linear relationship between the absorption coefficient and CS concentration exists at each frequency within range from 0.2 THz to 1.6 THz, and the values of R2 are all more than 0.95 (Data available but not shown). Figure 4 shows the curves of vs. frequency (0.2 THz~1.6 THz with spectrum resolution of 12.5 GHz) in different samples. The extinction coefficient is the result of the absorption coefficient divided by CS concentration. There are no clearly discernible peaks at any frequency in Fig. 4. The results may indicate that the THz attenuation caused by CS is mainly related to the scattering of THz radiation in the granular samples [19]. Several studies have been reported regarding the effects of granular solids on THz scattering [17, 20–23]. The equation below could be used to curve-fit the experimental data relating (unit: cm−1) and frequency f (unit: THz) [22]:
Fig. 4.
Relationship between and frequency from 0.2 THz to 1.6 THz.
| (7) |
The curve-fitting results are shown in Fig. 4 and Table 3. The extinction coefficient demonstrates the frequency dependence, among different samples, . Similar relationships between attenuation and terahertz frequency were found for other biomacromolecules, for example, THz attenuation in Cytoplex increases as [20].
Table 3. Curve-fitting results of and frequency.
| 60mg | 80mg | 100mg | 120mg | |
|---|---|---|---|---|
| p | 74.3071 | 72.6341 | 76.8685 | 74.0095 |
| q | 1.4378 | 1.4460 | 1.4314 | 1.4025 |
| R2 | 0.9976 | 0.9953 | 0.9948 | 0.9910 |
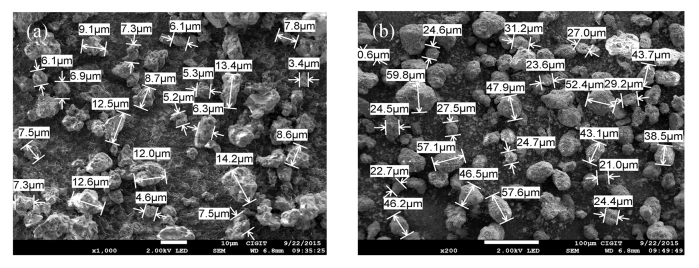
Actually, the particle size for CS and PE powders were measured by using scanning electron microscopy (SEM), and the grain sizes were approximately 10 μm and 40 μm for CS and PE, respectively (see Fig. 5). Theoretically, the Rayleigh scattering () could be the dominate mechanism for the terahertz scattering in the granular solids when the grain size is much less than the terahertz wavelength (e.g. 200 μm at 1.5 THz, 300 μm at 1 THz, and 600 μm at 0.5 THz). However, the curve-fitting results () show that the theory of Rayleigh scattering does not hold here. The possible reason could be that all the pellet samples were prepared by using 20 MPa pressure in the tablet press machines. So the pressing pressure may decrease the air voids and increase the effective CS grain sizes which may become comparable to terahertz wavelength. In this case, Mie’s scattering theory may be used to explain the attenuation intensity changing with frequency. Due to the relatively large THz detection range (wavelength ranging from 188 ~1500 μm) and non-uniform particle size distribution in the pellet samples, the relationship between the extinction coefficient and frequency is not quite Mie-like (, when the particle size is about the same as the wavelength) either, but close to it. The changes of CS grain size and air void content are primarily responsible for the complex THz scattering effects in the mixed pellet samples.
Fig. 5.
SEM images of CS and PE powders. (a) CS powder (particle diameter ≈8.2 ± 3.1μm), (b) PE powder (particle diameter ≈36.1 ± 13.4μm).
4. Conclusions
In this study, we have demonstrated that the THz absorption coefficient of the mixed CS/PE powder samples increases linearly as the CS content increases, and that the experimental and theoretical absorption coefficient curves are remarkably consistent. The pure CS powder has a large absorption in terahertz band whose absorption coefficient can reach about 140 cm−1 at 1.6 THz. All the absorption coefficients of samples gradually increase along with the frequencies. However, the refractive index decreases slightly with increasing frequency. The refractive index of pure CS is between 1.97 and 2.1. Furthermore, the ratio of the absorption coefficient and CS concentration (i.e., the extinction coefficient) increases with frequency. The extinction coefficient of CS can be modeled by a frequency dependent scattering process. However, due to the effective large size of the CS grains in the samples, such a process is not Rayleigh-like (where particle size is much smaller than the wavelength, and ), nor is it quite Mie-like (where particle size is about the same as the wavelength, with ), but close to the latter, having a frequency exponent of 1.4.
In summary, we have demonstrated experimentally that THz-TDS is very sensitive to the changes of CS content. And we have seen how this technique can be used to make a precise assessment of CS content in samples. We were able to obtain the substance content and its change accurately and quantitatively from the data of terahertz spectroscopy. In future work, we plan to measure other constituents in cartilage besides chondroitin sulfate using THz-TDS. Combined with different THz spectral and scattering analysis methods, we will study the other principal components in cartilage and its distribution expediently and precisely to accomplish rapid and efficient assessment of the state of health of articular cartilage and its degradation, in order to develop a novel clinical diagnostic method for joint diseases.
Acknowledgments
We would like to thank Drs. L. Yang, F. Wang, and J. Liu at the Southwest Hospital, Chongqing, China, for helpful discussions and technical assistance.
Funding
Natural Science Foundation of China (NSFC) (11504372); National Basic Research Program of China (Program 973) (2015CB755401).
Disclosures
The authors declare that there are no conflicts of interest related to this article.
References and links
- 1.James C. B., Uhl T. L., “A review of articular cartilage pathology and the use of glucosamine sulfate,” J. Athl. Train. 36(4), 413–419 (2001). [PMC free article] [PubMed] [Google Scholar]
- 2.Poole A. R., Kojima T., Yasuda T., Mwale F., Kobayashi M., Laverty S., “Composition and structure of articular cartilage: a template for tissue repair,” Clin. Orthop. Relat. Res., 391 ,Suppl, S26–S33 (2001). [DOI] [PubMed] [Google Scholar]
- 3.Sugahara K., Mikami T., Uyama T., Mizuguchi S., Nomura K., Kitagawa H., “Recent advances in the structural biology of chondroitin sulfate and dermatan sulfate,” Curr. Opin. Struct. Biol. 13(5), 612–620 (2003). 10.1016/j.sbi.2003.09.011 [DOI] [PubMed] [Google Scholar]
- 4.Lauder R. M., “Chondroitin sulphate: a complex molecule with potential impacts on a wide range of biological systems,” Complement. Ther. Med. 17(1), 56–62 (2009). 10.1016/j.ctim.2008.08.004 [DOI] [PubMed] [Google Scholar]
- 5.Uebelhart D., Malaise M., Marcolongo R., de Vathaire F., Piperno M., Mailleux E., Fioravanti A., Matoso L., Vignon E., “Intermittent treatment of knee osteoarthritis with oral chondroitin sulfate: a one-year, randomized, double-blind, multicenter study versus placebo,” Osteoarthritis Cartilage 12(4), 269–276 (2004). 10.1016/j.joca.2004.01.004 [DOI] [PubMed] [Google Scholar]
- 6.Kahan A., Uebelhart D., De Vathaire F., Delmas P. D., Reginster J. Y., “Long-term effects of chondroitins 4 and 6 sulfate on knee osteoarthritis the study on osteoarthritis progression prevention, a two-year, randomized, double-blind, placebo-controlled trial,” Arthritis Rheum. 60(2), 524–533 (2009). 10.1002/art.24255 [DOI] [PubMed] [Google Scholar]
- 7.Volpi N., “Quality of different chondroitin sulfate preparations in relation to their therapeutic activity,” J. Pharm. Pharmacol. 61(10), 1271–1280 (2009). 10.1211/jpp.61.10.0002 [DOI] [PubMed] [Google Scholar]
- 8.Zebrower M. E., Kieras F. J., Brown W. T., “Analysis by high-performance liquid-chromatography of hyaluronic-acid and chondroitin sulfates,” Anal. Biochem. 157(1), 93–99 (1986). 10.1016/0003-2697(86)90201-0 [DOI] [PubMed] [Google Scholar]
- 9.Gao G. Z., Jiao Q. C., Ding Y. L., Chen L., “Study on quantitative assay of chondroitin sulfate with a spectrophotometric method of azure A,” Guangpuxue Yu Guangpu Fenxi 23(3), 600–602 (2003). [PubMed] [Google Scholar]
- 10.Zheng J., Guan R. Z., Huang S. Y., “Comparative studies on the characteristics of the fourier-transform infrared spectra between sturgeon and shark chondroitin sulfates,” Guangpuxue Yu Guangpu Fenxi 28(1), 106–109 (2008). [PubMed] [Google Scholar]
- 11.Liu X. M., Li L., Zhao T., Dong H. P., “Determination of chondroitin sulfate in tablets by Raman spectroscopy and near-infrared spectroscopy combined with chemometric methods,” Anal. Methods-Uk 6(12), 4219–4227 (2014). 10.1039/C3AY41853G [DOI] [Google Scholar]
- 12.Duvillaret L., Garet F., Coutaz J.-L., “Highly precise determination of optical constants and sample thickness in terahertz time-domain spectroscopy,” Appl. Opt. 38(2), 409–415 (1999). 10.1364/AO.38.000409 [DOI] [PubMed] [Google Scholar]
- 13.Walther M., Plochocka P., Fischer B., Helm H., Uhd Jepsen P., “Collective vibrational modes in biological molecules investigated by terahertz time domain spectroscopy,” Biopolymers 67(4–5), 310–313 (2002). 10.1002/bip.10106 [DOI] [PubMed] [Google Scholar]
- 14.Son J. H., “Terahertz electromagnetic interactions with biological matter and their applications,” J. Appl. Phys. 105(10), 102033 (2009). 10.1063/1.3116140 [DOI] [Google Scholar]
- 15.Markelz A. G., Roitberg A., Heilweil E. J., “Pulsed terahertz spectroscopy of DNA, bovine serum albumin and collagen between 0.1 and 2.0 THz,” Chem. Phys. Lett. 320(1–2), 42–48 (2000). 10.1016/S0009-2614(00)00227-X [DOI] [Google Scholar]
- 16.Dorney T. D., Baraniuk R. G., Mittleman D. M., “Material parameter estimation with terahertz time-domain spectroscopy,” J. Opt. Soc. Am. A 18(7), 1562–1571 (2001). 10.1364/JOSAA.18.001562 [DOI] [PubMed] [Google Scholar]
- 17.Garet F., Hofman M., Meilhan J., Simoens F., Coutaz J. L., “Evidence of Mie scattering at terahertz frequencies in powder materials,” Appl. Phys. Lett. 105(3), 031106 (2014). 10.1063/1.4890732 [DOI] [Google Scholar]
- 18.Li Z., Zhang Z. H., Zhao X. Y., Su H. X., Yan F., “Extracting THz absorption coefficient spectrum based on accurate determination of sample thickness,” Guangpuxue Yu Guangpu Fenxi 32(4), 1043–1046 (2012). [PubMed] [Google Scholar]
- 19.Pearce J., Mittleman D. M., “Scale model experimentation: using terahertz pulses to study light scattering,” Phys. Med. Biol. 47(21), 3823–3830 (2002). 10.1088/0031-9155/47/21/321 [DOI] [PubMed] [Google Scholar]
- 20.Chan T. L. J., Bjarnason J. E., Lee A. W. M., Celis M. A., Brown E. R., “Attenuation Contrast between biomolecular and inorganic materials at terahertz frequencies,” Appl. Phys. Lett. 85(13), 2523–2525 (2004). 10.1063/1.1794858 [DOI] [Google Scholar]
- 21.Bandyopadhyay A., Sengupta A., Barat R. B., Gary D. E., Federici J. F., Chen M., Tanner D. B., “Effects of scattering on THz spectra of granular solids,” Int. J. Infrared Milli. 28(11), 969–978 (2007). 10.1007/s10762-007-9276-y [DOI] [Google Scholar]
- 22.Shen Y. C., Taday P. F., Pepper M., “Elimination of scattering effects in spectral measurement of granulated materials using terahertz pulsed spectroscopy,” Appl. Phys. Lett. 92(5), 051103 (2008). 10.1063/1.2840719 [DOI] [Google Scholar]
- 23.Kaushik M., Ng B. W. H., Fischer B. M., Abbott D., “Reduction of scattering effects in THz-TDS signals,” IEEE Photon. Tech. Lett. 24(2), 155–157 (2012). 10.1109/LPT.2011.2174980 [DOI] [Google Scholar]


