Abstract
In situ chemical measurements of solution/surface reactions during metal-organic framework (MOF) thin film growth can provide valuable information about the mechanistic and kinetic aspects of key reaction steps, and allow control over crystal quality and material properties. Here, we report a new approach to study the growth of MOF thin films in a flow cell using attenuated total reflectance Fourier transform infrared spectroscopy (ATR-FTIR). Real-time spectra recorded during continuous flow synthesis were used to investigate the mechanism and kinetics that govern the formation of (Zn, Cu) hydroxy double salts (HDSs) from ZnO thin films and the subsequent conversion of HDS to HKUST-1. We found that both reactions follow pseudo-first order kinetics. Real-time measurements also revealed that the limited mass transport of reactants may lead to partial conversion of ZnO to HDS and therefore leaves an interfacial ZnO layer beneath the HDS film providing strong adhesion of the HKUST-1 coating to the substrate. This in situ flow-cell ATR-FTIR method is generalizable for studying the dynamic processes of MOF thin film growth, and could be used for other solid/liquid reaction systems involving thin films.
Graphical abstract
Introduction
With their intrinsic porosity and a diversity of crystalline structures, metal-organic frameworks (MOFs) have attracted tremendous interest in the past few decades.1,2 Over 20 000 MOF structures have been reported,1 and these materials have been investigated for a wide array of applications, such as gas adsorption, separations, and catalysis.3–7 However, due to the difficulty in probing crystal growth in solutions,8 obtaining direct evidence to elucidate MOF growth mechanisms continues to be a challenge.9 As a result, dynamic processes that take place during MOF formation are still not well understood, and MOF synthesis often relies on trial and error.8 Understanding the mechanism of MOF nucleation and growth will enhance control over the material properties, morphology and defects,10 and allow the discovery of improved synthesis methods.9
Several in situ measurements have been previously reported to study how MOFs form, including atomic force microscopy (AFM),10,11 surface plasmon resonance (SPR) spectroscopy,12 quartz crystal microbalance (QCM),13 X-ray diffraction (XRD),14,15 small-angle and wide-angle X-ray scattering (SAXS/WAXS),16–18 and liquid cell transmission electron microscopy (LCTEM).19 Attfield et al. probed the surfaces of MOF crystals using in situ AFM during the growth of HKUST-1 and MOF-5.10,11 With sub-nanometer resolution, this technique can track the growth of crystal surfaces and identify defects present during crystallization. In situ SPR and QCM are powerful tools to analyze the kinetics for the formation of surface-mounted MOFs in real time.12,13 In situ XRD and SAXS/WAXS have been used to follow the transition of crystal structures during MOF synthesis and identify intermediate phases.14–18 Recently, Patterson et al. captured the dynamic processes during ZIF-8 growth using LCTEM, providing direct visual evidence for ZIF-8 formation from small constituents.19
While previous in situ methods have been mainly focused on the changes in crystal structure, crystal morphology, crystal size, and mass uptake on surfaces, these measurements do not directly reveal chemical information such as bond formation and ion/ligand exchange during the process of MOF growth. Here, we report for the first time the use of in situ time-resolved attenuated total reflectance (ATR) Fourier transform infrared (FTIR) spectroscopy in a continuous-flow reactor to study the mechanism and kinetics of MOF growth. The ATR technique relies on the total reflection of the IR beam in an internal reflection element (IRE), where surface enhancement is achieved by the evanescent wave formed perpendicular to the reflecting surface in the IRE.20,21 Compared to transmission FTIR spectroscopy, ATR-FTIR is advantageous for probing surfaces (rather than measuring the bulk) and particularly powerful for in situ analyses of chemisorption and reactions at solid/liquid interfaces when the liquid is highly absorbing.21 Although liquid-cell ATR measurements are commonly employed for the investigation of a wide variety of molecular adsorption and surface reactions,22–28 ATR-FTIR has not yet been explored for real-time monitoring of MOF growth.
Key challenges of using ATR-FTIR to study MOF growth are: i) the limited penetration depth of the evanescent wave to probe through the reagent solution; and ii) the lack of controlled MOF nucleation and growth on the IRE. For example, during common solvothermal syntheses, MOF crystals formed in the solution are often observed to fall onto the bottom of the reaction vessel. Consequently, it is difficult to distinguish between homogeneous nucleation (in the solution) and heterogeneous nucleation (on the IRE surface). Once the IRE is covered with a sufficiently thick layer (greater than 1 μm thick) of MOF crystals, the ATR configuration will no longer be able to probe the extent of reaction. After the IRE surface is overcoated with MOFs, it needs to be cleaned or replaced to carry out additional measurements.
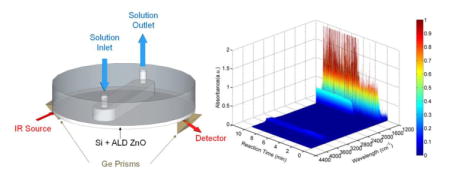
To deal with these challenges, we designed an ATR configuration to use 50 mm diameter Si wafers as the IRE as shown in Figure 1a (a detailed description of the ATR-FTIR setup is provided in Figure S1). This approach is advantageous because Si wafers are replaceable and less costly than common IREs (e.g. trapezoidal prisms and other geometries). As a test-case for our measurement, we focus on the recently reported processes that show controlled MOF nucleation and growth on or from surface metal oxides.29–36 We use atomic layer deposition (ALD) to prepare a metal oxide thin film on the Si wafer IRE as the starting material or nucleation layer for MOF growth (Figure 1b). In this work, we will use our custom-built flow-cell ATR-FTIR to study the mechanism and kinetics of a recently reported conversion of hydroxy double salt (HDS) to MOFs.33 In this two-step scheme, ZnO reacts with Cu(NO3)2 in solution to form (Zn, Cu) hydroxy nitrate, and this HDS intermediate is further converted to HKUST-1 MOF via anion exchange at room temperature within 1 min (Figure 1c). Previous work also confirms that this approach is generally applicable to other systems, including for example, Cu-BDC, IRMOF-3, ZIF-8 and other MOF materials.33 Ex situ characterization has been used in the previous report to investigate the reaction mechanism.33 Here, we show that in situ flow-cell ATR-FTIR can capture the dynamics of HDS formation and subsequent anion exchange in the HDS layer that ultimately leads to MOF formation.
Figure 1.
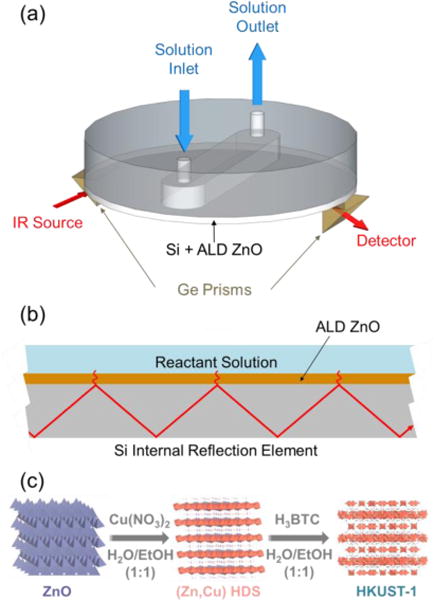
(a) Schematic of the in situ ATR-FTIR spectroscopy setup equipped with a liquid flow cell. An undoped silicon wafer is used as the internal reflection element. (b) Schematic of the solid-liquid interface for the surface reactions to form MOF thin films. A layer of ZnO deposited on Si using ALD is used as a templating material for rapid room-temperature synthesis of the HKUST-1 thin film.
Results and Discussion
We deposited 300 cycles of ALD ZnO (≈ 60 nm thickness) on the Si wafer as the initiation layer for HDS formation. In a typical room-temperature flow synthesis experiment, 300 mmol/L of Cu(NO3)2 solution in ethanol-water (ethanol volume fraction of 0.5) was first pumped into the liquid cell for 120 s, followed by a rinse step using the mixed solvent for 60 s. Subsequently, 10 mmol/L of 1,3,5-benzenetricarboxylic acid (H3BTC) solution in ethanol-water was pumped into the cell for 300 s. After the flow of H3BTC solution, the cell was further rinsed with the ethanol-water solvent mixture for 120 s. The flow rate was controlled at 100 mL/min during the entire process. We modified the previously published procedure33 to exclude dimethylformamide (DMF) from the solvent mixture, because the strong carbonyl band in DMF at ≈ 1680 cm−1 was found to overlap with the asymmetric stretching mode for the carboxylate groups (vas(OCO−)) in HKUST-1. Infrared absorbance spectra were recorded every 0.49 s and each spectrum was referenced against steady-state flow of the solvent mixture in the absence of reactants. Sets of spectra were analyzed by integrating the peaks for at ≈ 1420 cm−1, v(C=C) at ≈ 1588 cm−1 and vas (OCO−) at ≈ 1647 cm−1.33 We used peak areas to follow the extent of reaction during HDS formation from ALD ZnO as well as HDS conversion to HKUST-1.
Figure 2a shows time-resolved ATR-FTIR spectra for the surface reactions to form HKUST-1 thin films (corresponding 3D plot is shown in Figure S2). Two broad peaks at ≈ 1360 cm−1 and ≈ 1420 cm−1 appear after the ZnO coated IRE is exposed to Cu(NO3)2 solution in the flow cell. These two peaks are associated with vibrations of the groups mainly present in the (Zn, Cu) hydroxy nitrate double salt.33 The integrated peak area for at ≈ 1420 cm−1 (Figure 2b) increases dramatically and reaches saturation after 1 min, indicating the fast formation of (Zn,Cu) HDS from the ZnO thin film. Following the exposure of the ZnO surface to Cu(NO3)2 solution, ethanol-water solvent mixture was used to rinse the cell for 1 min. The absorbance of the peaks remains constant during the rinse step. When the H3BTC solution is dosed into the flow cell at t ≈ 3.5 min, four peaks appear (Figure 2a) which represent the symmetric and asymmetric stretching modes (1378 cm−1 and 1647 cm−1, respectively) of the carboxylate groups in HKUST-1,33 and the C=C vibration modes (1450 cm−1 and 1588 cm−1) associated with the aromatic ring in the BTC3−. The decreased peak area of and the increased peak area of vas(OCO−) and v(C=C) were observed simultaneously (Figures 2b–d), consistent with the anion exchange process reported for HDS conversion to MOFs.33 The vas(OCO−) and v(C=C) peaks reach their maximum area within 1 min, showing the rapid conversion of HDS to HKUST-1. SEM images and XRD patterns in the supporting information (Figure S3 and S4) confirm that the film formed on the surface is HKUST-1 MOF with crystal sizes of 571 nm ± 124 nm.
Figure 2.
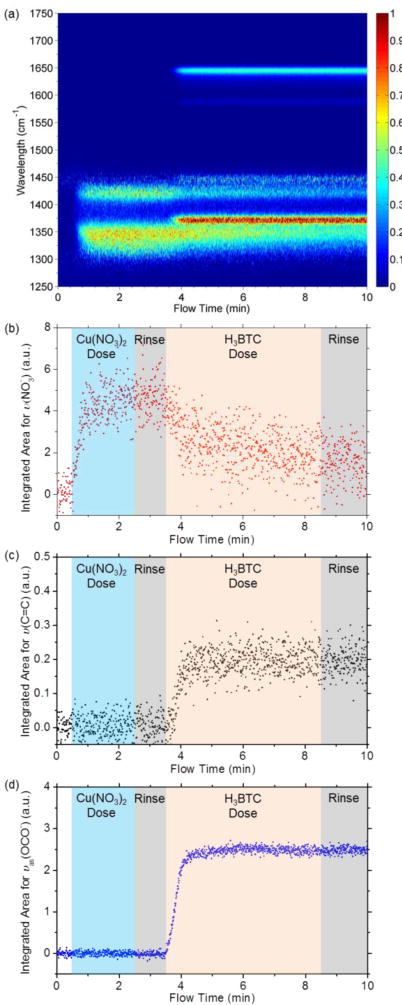
(a) Time-resolved ATR-FTIR spectra for surface reactions to form HKUST-1 thin films. (b–d) Integrated area for IR peaks representing at ≈ 1420 cm−1, v(C=C) at ≈ 1588 cm−1, and vas(OCO−) at ≈ 1647 cm−1.
Since the flow cell ATR-FTIR measurement can follow the extent of surface reactions, we investigated the kinetics for the formation of HDS from ZnO and the conversion of HDS to HKUST-1. Figure 3a shows the change of integrated IR peak area for at ≈ 1420 cm−1 as a function of reaction time when the initial ZnO layer (≈ 60 nm) is reacted with different concentrations of Cu(NO3)2 solution. For all concentrations tested for this reaction, peak area rises rapidly in the first 30 s of reaction and then slowly saturates as reaction reaches steady-state conditions. In order to correlate the IR absorbance (A) with the concentration of nitrate groups, we derived Equation 1 (full derivation provided in the SI) based on the differential form of the Beer-Lambert law and the exponential decay of the electric field strength for the evanescent wave.
Figure 3.
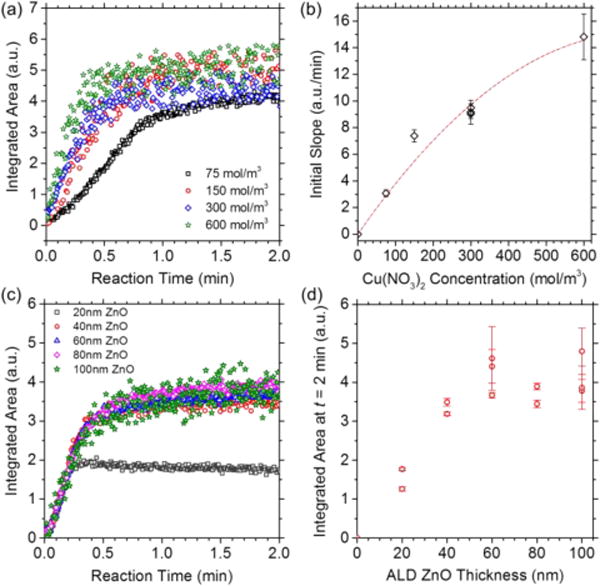
(a) Integrated IR peak area for at ≈ 1420 cm−1 as a function of reaction time during the flow of Cu(NO3)2 solutions with different concentrations (75 mmol/L to 600 mmol/L) on a fixed thickness of ALD ZnO (≈ 60 nm). (b) Initial slope (0 ≤ t ≤ 0.1 min) derived from the curves in (a). The dashed curve represents the fit to Equation 5. (c) Integrated peak area during the flow of 300 mmol/L Cu(NO3)2 on different thicknesses of ALD ZnO layers (≈ 20 nm to ≈ 100 nm). (d) Integrated peak area after HDS growth saturation (t = 2.0 min). Error bars in (b) and (d) represent standard deviation for each sample.
| (1) |
where N is the number of total reflections, CN, HDS and CN, Sol (in units of mmol/L) are the concentrations of nitrate groups in the HDS film and in the solution, respectively. CN, HDS and CN, Sol are both considered constant during the initial period of reaction. LHDS is the film thickness of (Zn, Cu) HDS and α, γ are defined in Equation 2 and Equation 3, respectively.
| (2) |
where ε is the molar attenuation coefficient for the nitrate groups (in units of m2/mol), I0 is the intensity of the incident evanescent wave at the IRE surface, dZnO is the distance from the IRE surface to the top surface of the ZnO film. γ is defined as the reciprocal of the penetration depth (dp), and depends on the refractive indices of the IRE (n1) and the thin film on top of the IRE (n2), the angle of incidence (θ), and the IR wavelength (λ).37,38
| (3) |
The chemical reactions possibly involved in the process to form HDS from ZnO are written as Reaction I and II.
| (I) |
| (II) |
Since it is non-trivial to identify all the elementary reactions and to determine a rate limiting step, we assume that the entire conversion process from ZnO to HDS follows pseudo-first order kinetics (Equation 4).
| (4) |
where r1 is the reaction rate for the overall reaction process, kapp is the apparent first order rate constant, CCu is the concentration of Cu2+. Equation 1 then becomes
| (5) |
where t is the reaction time (in units of min). The grouped kinetic parameter φ is given as
| (6) |
where V (m3) is the volume of Cu(NO3)2 solution involved in the reaction to form the HDS, and S (m2) is the geometric area of the HDS film, i.e. the planar surface area on the wafer exposed to reactants.
As indicated in Equation 5, absorbance is linearly related with the reaction time. This allows us to interpret the initial slope (0 ≤ t ≤ 0.1 min) of the curves in Figure 3a as an indication of reaction rate. Figure 3b shows that the initial slope increases with the Cu(NO3)2 concentration. Upon fitting the data with Equation 5, we find that the experimental results agree well with the model, confirming that the ZnO-to-HDS conversion can be described by pseudo-first order kinetics. Fitting of the initial slope using Equation 7 gives φ = (0.041 ± 0.004) m3∙mol−1∙min−1.
| (7) |
We also studied the effect of the starting thickness of the ZnO films on the kinetics of HDS formation. Figure 3c shows the integrated peak area during the flow of 300 mmol/L Cu(NO3)2 solutions on different thicknesses of ALD ZnO layers (100 cycles to 500 cycles, ≈ 20 nm to ≈100 nm). As expected, the initial slope of the curves in Figure 3c are comparable for all oxide thicknesses tested. To compare the amount of HDS formed at the end of Cu(NO3)2 flow, we plotted the final integrated peak area at t = 2 min as a function of the thicknesses of the ZnO films deposited on the Si IRE (Figure 3d). While the peak area shows a dependence on the initial ZnO thickness, for ZnO films ≥ 60 nm in thickness, peak area exhibits saturation. We calculated the dp of the ATR evanescent wave based on Equation 3 and compared this value with the HDS film thicknesses measured from cross sectional SEM images. In the wavenumber range (1250 cm−1 to 1750 cm−1) used to track the reaction that forms (Zn, Cu) HDS from ZnO, dp ranges from 0.62 μm to 0.88 μm. These dp values are larger than the thickest HDS layer (0.56 μm) converted from ≈ 100 nm thick ALD ZnO (Figure S5), confirming that surface changes during the ZnO-to-HDS conversion are within the information depth of the ATR-FTIR measurement. Transmission IR measurements also indicate that the film thicknesses of the HDS converted from thick ZnO layers (≥ 60 nm) are indeed very similar (Figure S6). These results reveal that full conversion is not achieved for thick ZnO starting layers during flow synthesis.
The partial conversion of thick ZnO layers to (Zn, Cu) HDS possibly stems from a diffusion-limited process. As shown in Figure 3c, for ZnO initial layers with thicknesses ≥ 60 nm, the rise in the peak area stops after 0.5 min. The dense HDS formed on the surface may impede reactant diffusion into the film, thus hindering mass transport (Figure 4). Consequently, the growth of HDS stops at a certain depth where the reactant is either depleted or is low in concentration, leaving an interfacial layer of ZnO in between the HDS film and the Si substrate. The XRD results in Figure S4 also confirm the existence of ZnO in the HDS films synthesized from thick ZnO initiation layers.
Figure 4.
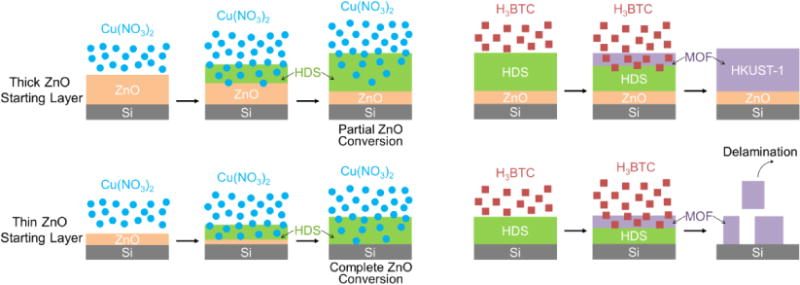
Schematic illustration of the reaction and diffusion processes for thick and thin ZnO starting layers during the formation of HDS and its subsequent conversion to HKUST-1.
We observed that the ZnO interfacial layer due to partial conversion to HDS plays a critical role in attaching the MOF thin films to the substrate during the conversion of as-synthesized (Zn, Cu) HDS to HKUST-1 films (Figure 4). To demonstrate this, we studied the formation of HKUST-1 films using 10 mmol/L of H3BTC solution and HDS prepared from different thicknesses of ZnO initial films. Time-resolved IR spectra confirm the formation of HKUST-1 from (Zn, Cu) HDS regardless of the thickness of the ZnO initial layers (Figure S7). In the cases where a ZnO interfacial layer remained beneath the MOF films (for ZnO thicknesses ≥ 60 nm), dense and uniform HKUST-1 films were obtained and found to be attached to the substrate as shown in the SEM images in Figure S8. In comparison, when a thin ZnO initial layer was used, the complete consumption of the ZnO film and the subsequent conversion of HDS into MOF resulted in the delamination and loss of the MOF layer.
We further investigated the kinetics for the conversion of (Zn, Cu) HDS to HKUST-1 by monitoring the vas(OCO−) peak at ≈ 1647 cm−1. HDS thin films with and without ZnO interfacial layers were synthesized from ≈ 60 nm and ≈ 20 nm thick ALD ZnO films, respectively. The concentration of H3BTC solution used in the experiments ranged from 1 mmol/L to 20 mmol/L. Figure 5a shows the formation of HKUST-1 from HDS with the presence of a ZnO interfacial layer. The area of the vas(OCO−) peak increases dramatically and then reaches a plateau which indicates maximum conversion of HDS. In comparison, the peak area of vas(OCO−) shown in Figure 5b drops after initial growth, indicating film delamination and loss during reactant flow in the cases without the ZnO interfacial layers. Indeed, we observed sparse islands of HKUST-1 crystals on these substrates by SEM (Figure S8).
Figure 5.
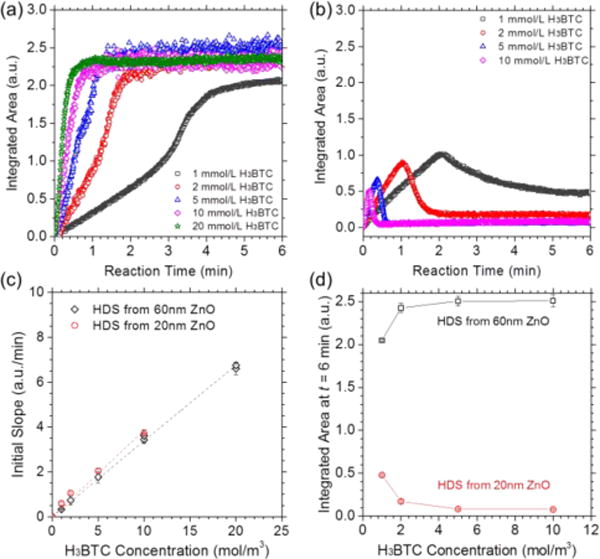
(a–b) Integrated IR peak area for vas(OCO−) at ≈ 1647 cm−1 as a function of reaction time during the flow of H3BTC solutions on (Zn, Cu) HDSs converted from (a) ≈ 60 nm and (b) ≈ 20 nm of ALD ZnO thin films. (c) Initial slope (0 ≤ t ≤ 0.1 min) de-rived from the curves in (a–b) as a function of H3BTC concentration. The dashed line represents linear fitting. (d) Integrated IR peak area for vas(OCO−) at ≈ 1647 cm−1 at t = 6 min, representing the final amount of HKUST-1 synthesized from HDS thin films with and without a ZnO interfacial layer. Error bars in (c) and (d) represent standard deviation for each sample.
The reaction associated with the HDS-to-MOF conversion is given in Reaction III.
| (III) |
With a derivation similar to Equation 1 and maintaining the assumption of pseudo-first order kinetics, we obtain Equation 8 (full derivation provided in SI) to correlate absorbance A′ for vas(OCO−) with reaction time.
| (8) |
where the grouped kinetic parameter φ′ for the HDS-to-MOF conversion is defined in Equation 9. CBTC is the concentration of H3BTC in the solution.
| (9) |
where α′, , V′ and S′ are similar to their counterparts in Equations 2 through 4, and defined in the SI.
Equation 8 establishes a linear relationship between absorbance and reaction time, so we can use the initial slope of the integrated vas(OCO−) curve to obtain φ′. The initial slope (0 ≤ t ≤ 0.1 min) obtained from the curves in Figure 5a–b exhibits a linear dependence on H3BTC concentration (Figure 5c). This is consistent with our model, and confirms that the conversion of HDS to HKUST-1 is also described by pseudo-first order kinetics. φ′ obtained from linear fitting gives a value of (0.338 ± 0.004) m3∙mol−1∙min−1 for the initial reaction on HDS layers synthesized from ≈ 60 nm thick ZnO, and (0.385 ± 0.017) m3∙mol−1∙min−1 for initial MOF formation on HDS converted from ≈ 20 nm thick ZnO films. The difference between these two φ′ values could be a result of different evanescent wave intensities at the top surfaces of thick and thin HDS films (Equation S4).
Figure 5d shows the integrated area for the vas(OCO−) peak after the termination of H3BTC flow, which represents the total amount of HKUST-1 remaining on the IRE surface. For HDS films obtained from ≈ 60 nm thick ZnO, the as-synthesized MOF layers were all found to be attached to the substrate regardless of the H3BTC concentration. Moreover, the integrated vas(OCO−) area increases as a function of H3BTC concentration. Compared with other concentrations tested, 1 mmol/L of H3BTC results in notably lower conversion of the HDS layer synthesized from ≈ 60 nm thick ZnO. This may be because the mass transport rate for H3BTC to diffuse into the HDS film is low due to the relatively small concentration gradient, while the reaction rate to form HKUST-1 with 1 mmol/L of H3BTC is high. The diffusion of H3BTC in the HKUST-1 growth front could be a secondary factor affecting HDS conversion, depending on the relative diffusivities of H3BTC in HDS and HKUST-1, respectively. Consequently, the diffusion-controlled process leads to limited conversion of the HDS film.
For HDS films grown from a thin ZnO layer (≈ 20 nm), the final integrated vas(OCO−) area for the reaction run with 1 mmol/L H3BTC is significantly higher than reactions run with ≥ 2 mmol/L H3BTC (Figure 5d). The lower effective conversion at increasing H3BTC concentrations can be explained by rapid delamination of the MOF layer. Therefore, when the H3BTC concentration is high and the starting ZnO layer is relatively thin, the reaction front quickly reaches the HDS/Si interface and results in the detachment of the MOF film. These results also indicate that film loss could be controlled by using low concentrations of H3BTC solution. Alternatively, limiting reaction time before delamination occurs when thin HDS films are to be employed (based on Figure 5b) could also be effective for achieving densely-covered thin (e.g., < 100 nm) HKUST-1 films using HDS conversion.
Conclusion
We have demonstrated a custom-designed flow-cell ATR-FTIR system capable of probing surface reactions in situ during MOF thin film synthesis. This system was used to investigate the conversion of ZnO to (Zn, Cu) HDS and the subsequent conversion of HDS to HKUST-1 MOF at room temperature. Time-revolved spectra show that both ZnO-to-HDS and HDS-to-MOF reactions reach maximum conversion in under 1 min. Combined experiment and modeling analyses reveal pseudo-first order kinetics for each conversion step. The thickness of the HDS and the resulting MOF film product is found to be tunable by adjusting the thickness of ALD ZnO initial layers. We found that partial conversion of the initial ZnO film due to diffusion-limited reaction leads to an interfa-cial ZnO layer that can enhance the adhesion of the MOF film to the substrate. Our results provide important insights into the reaction conditions needed to produce surface-bound ultra-thin MOF films. The flow reactor system with in situ ATR-FTIR described here is expected to aid the development and analysis of other thin film deposition processes as well.
Supplementary Material
Acknowledgments
The authors acknowledge funding from ECBC (grant no. W911SR-07-C-0075) and the Joint Science and Technology Office (Army Research Office grant no. W911NF-13-1-0173). We thank Christopher Oldham for helping with the ALD processes. The authors also acknowledge the use of the Analytical Instrumentation Facility at North Carolina State University, supported by the State of North Carolina and the National Science Foundation.
Footnotes
Supporting Information. Experimental conditions, derivation of ATR-FTIR kinetic model, schematic of flow-cell and optics, 3D and contour plots of representative MOF growth experiments, optical and electron micrographs, X-ray diffraction patterns, correlation between ATR and transmission FTIR. This material is available free of charge via the Internet at http://pubs.acs.org.
Notes
The authors declare no competing financial interest. Certain commercial equipment, instruments, and materials are identified in this publication to adequately specify the experimental procedure. Such identification in no way implies approval, recommendation, or endorsement by the National Institute of Standards and Technology, nor does it imply that the equipment, instruments, or materials identified are necessarily the best available for the purpose.
References
- 1.Furukawa H, Cordova KE, O’Keeffe M, Yaghi OM. The Chemistry and Applications of Metal-Organic Frameworks. Science. 2013;341:1230444. doi: 10.1126/science.1230444. [DOI] [PubMed] [Google Scholar]
- 2.Slater AG, Cooper AI. Function-led design of new porous materials. Science. 2015;348:aaa8075. doi: 10.1126/science.aaa8075. [DOI] [PubMed] [Google Scholar]
- 3.Li J-R, Kuppler RJ, Zhou H-C. Selective gas adsorption and separation in metal-organic frameworks. Chem Soc Rev. 2009;38:1477–1504. doi: 10.1039/b802426j. [DOI] [PubMed] [Google Scholar]
- 4.Murray LJ, Dinca M, Long JR. Hydrogen storage in metal-organic frameworks. Chem Soc Rev. 2009;38:1294–1314. doi: 10.1039/b802256a. [DOI] [PubMed] [Google Scholar]
- 5.Lee J, Farha OK, Roberts J, Scheidt KA, Nguyen ST, Hupp JT. Metal-organic framework materials as catalysts. Chem Soc Rev. 2009;38:1450–1459. doi: 10.1039/b807080f. [DOI] [PubMed] [Google Scholar]
- 6.Kreno LE, Leong K, Farha OK, Allendorf M, Van Duyne RP, Hupp JT. Metal–Organic Framework Materials as Chemical Sensors. Chem Rev. 2012;112:1105–1125. doi: 10.1021/cr200324t. [DOI] [PubMed] [Google Scholar]
- 7.Sumida K, Rogow DL, Mason JA, McDonald TM, Bloch ED, Herm ZR, Bae T-H, Long JR. Carbon Dioxide Capture in Metal-Organic Frameworks. Chem Rev. 2012;112:724–781. doi: 10.1021/cr2003272. [DOI] [PubMed] [Google Scholar]
- 8.Walton KS. Inorganic chemistry: Movies of a growth mechanism. Nature. 2015;523:535–536. doi: 10.1038/523535a. [DOI] [PubMed] [Google Scholar]
- 9.Morris RE. How Does Your MOF Grow? ChemPhysChem. 2009;10:327–329. doi: 10.1002/cphc.200800642. [DOI] [PubMed] [Google Scholar]
- 10.Shoaee M, Anderson MW, Attfield MP. Crystal Growth of the Nanoporous Metal–Organic Framework HKUST-1 Revealed by In Situ Atomic Force Microscopy. Angew Chem Int Ed. 2008;47:8525–8528. doi: 10.1002/anie.200803460. [DOI] [PubMed] [Google Scholar]
- 11.Cubillas P, Anderson MW, Attfield MP. Crystal Growth Mechanisms and Morphological Control of the Prototypical Metal–Organic Framework MOF-5 Revealed by Atomic Force Microscopy. Chem – Eur J. 2012;18:15406–15415. doi: 10.1002/chem.201202261. [DOI] [PubMed] [Google Scholar]
- 12.Shekhah O, Wang H, Zacher D, Fischer RA, Wöll C. Growth Mechanism of Metal–Organic Frameworks: Insights into the Nucleation by Employing a Step-by-Step Route. Angew Chem Int Ed. 2009;48:5038–5041. doi: 10.1002/anie.200900378. [DOI] [PubMed] [Google Scholar]
- 13.Stavila V, Volponi J, Katzenmeyer AM, Dixon MC, Allendorf MD. Kinetics and mechanism of metal-organic framework thin film growth: systematic investigation of HKUST-1 deposition on QCM electrodes. Chem Sci. 2012;3:1531–1540. [Google Scholar]
- 14.Millange F, Medina MI, Guillou N, Férey G, Golden KM, Walton RI. Time-Resolved In Situ Diffraction Study of the Solvothermal Crystallization of Some Prototypical Metal–Organic Frameworks. Angew Chem Int Ed. 2010;49:763–766. doi: 10.1002/anie.200905627. [DOI] [PubMed] [Google Scholar]
- 15.Wu Y, Moorhouse SJ, O’Hare D. Time-Resolved in Situ Diffraction Reveals a Solid-State Rearrangement During Solvothermal MOF Synthesis. Chem Mater. 2015;27:7236–7239. [Google Scholar]
- 16.Cravillon J, Schröder CA, Nayuk R, Gummel J, Huber K, Wiebcke M. Fast nucleation and growth of ZIF-8 nanocrys-tals monitored by time-resolved in situ small-angle and wide-angle X-ray scattering. Angew Chem Int Ed. 2011;50:8067–8071. doi: 10.1002/anie.201102071. [DOI] [PubMed] [Google Scholar]
- 17.Goesten M, Stavitski E, Pidko EA, Gücüyener C, Boshuizen B, Ehrlich SN, Hensen EJM, Kapteijn F, Gascon J. The Molecular Pathway to ZIF-7 Microrods Revealed by In Situ Time-Resolved Small- and Wide-Angle X-Ray Scattering, Quick-Scanning Extended X-Ray Absorption Spectroscopy, and DFT Calculations. Chem – Eur J. 2013;19:7809–7816. doi: 10.1002/chem.201204638. [DOI] [PubMed] [Google Scholar]
- 18.Saha S, Springer S, Schweinefuß ME, Pontoni D, Wiebcke M, Huber K. Insight into Fast Nucleation and Growth of Zeolitic Imidazolate Framework-71 by In Situ Time-Resolved Light and X-ray Scattering Experiments. Cryst Growth Des. 2016;16:2002–2010. [Google Scholar]
- 19.Patterson JP, Abellan P, Denny MS, Park C, Browning ND, Cohen SM, Evans JE, Gianneschi NC. Observing the Growth of Metal-Organic Frameworks by in Situ Liquid Cell Transmission Electron Microscopy. J Am Chem Soc. 2015;137:7322–7328. doi: 10.1021/jacs.5b00817. [DOI] [PubMed] [Google Scholar]
- 20.Hind AR, Bhargava SK, McKinnon A. At the solid/liquid interface: FTIR/ATR — the tool of choice. Adv Colloid Interface Sci. 2001;93:91–114. doi: 10.1016/s0001-8686(00)00079-8. [DOI] [PubMed] [Google Scholar]
- 21.Andanson J-M, Baiker A. Exploring catalytic solid/liquid interfaces by in situ attenuated total reflection infrared spectroscopy. Chem Soc Rev. 2010;39:4571–4584. doi: 10.1039/b919544k. [DOI] [PubMed] [Google Scholar]
- 22.Sabo M, Gross J, Wang J, Rosenberg I. Performance Liquid-Chromatography Fourier-Transform Infrared Spectrometry with Normal and Reverse Phases Using an Attenuated Total Reflectance Flow Cell. Anal Chem. 1985;57:1822–1826. [Google Scholar]
- 23.Taga K, Kellner R, Kainz U, Sleytr U. In-Situ Attenuated Total Reflectance Ft-Ir Analysis of an Enzyme-Modified Mid-infrared Fiber Surface Using Crystalline Bacterial Surface-Proteins. Anal Chem. 1994;66:35–39. [Google Scholar]
- 24.Borda MJ, Strongin DR, Schoonen MA. A novel vertical attenuated total reflectance photochemical flow-through reaction cell for Fourier transform infrared spectroscopy. Spectrochim Acta Part-Mol Biomol Spectrosc. 2003;59:1103–1106. doi: 10.1016/s1386-1425(02)00287-1. [DOI] [PubMed] [Google Scholar]
- 25.Delille A, Quiles F, Humbert F. In situ monitoring of the nascent Pseudomonas fluorescens Biofilm response to variations in the dissolved organic carbon level in low-nutrient water by attenuated total reflectance-fourier transform infrared spectroscopy. Appl Environ Microbiol. 2007;73:5782–5788. doi: 10.1128/AEM.00838-07. [DOI] [PMC free article] [PubMed] [Google Scholar]
- 26.Schlenoff JB, Rmaile AH, Bucur CB. Hydration contributions to association in polyelectrolyte multilayers and complexes: Visualizing hydrophobicity. J Am Chem Soc. 2008;130:13589–13597. doi: 10.1021/ja802054k. [DOI] [PubMed] [Google Scholar]
- 27.Heinen M, Jusys Z, Behm RJ. Ethanol, Acetaldehyde and Acetic Acid Adsorption/Electrooxidation on a Pt Thin Film Electrode under Continuous Electrolyte Flow: An in Situ ATR-FTIRS Flow Cell Study. J Phys Chem C. 2010;114:9850–9864. [Google Scholar]
- 28.Lin W, Li Z. Detection and Quantification of Trace Organic Contaminants in Water Using the FT-IR-Attenuated Total Reflectance Technique. Anal Chem. 2010;82:505–515. doi: 10.1021/ac901192d. [DOI] [PubMed] [Google Scholar]
- 29.Zhao J, Losego MD, Lemaire PC, Williams PS, Gong B, Atanasov SE, Blevins TM, Oldham CJ, Walls HJ, Shepherd SD, Browe MA, Peterson GW, Parsons GN. Highly Adsorptive, MOF-Functionalized Nonwoven Fiber Mats for Hazardous Gas Capture Enabled by Atomic Layer Deposition. Adv Mater Interfaces. 2014;1:1400040. [Google Scholar]
- 30.Khaletskaya K, Turner S, Tu M, Wannapaiboon S, Schneemann A, Meyer R, Ludwig A, Van Tendeloo G, Fischer RA. Self-Directed Localization of ZIF-8 Thin Film Formation by Conversion of ZnO Nanolayers. Adv Funct Mater. 2014;24:4804–4811. [Google Scholar]
- 31.Zhao J, Gong B, Nunn WT, Lemaire PC, Stevens EC, Sidi FI, Williams PS, Oldham CJ, Walls HJ, Shepherd SD, Browe MA, Peterson GW, Losego MD, Parsons GN. Conformal and highly adsorptive metal–organic framework thin films via layer-by-layer growth on ALD-coated fiber mats. J Mater Chem A. 2015;3:1458–1464. [Google Scholar]
- 32.Zhao Y, Kornienko N, Liu Z, Zhu C, Asahina S, Kuo T-R, Bao W, Xie C, Hexemer A, Terasaki O, Yang P, Yaghi OM. Mesoscopic constructs of ordered and oriented metal-organic frameworks on plasmonic silver nanocrystals. J Am Chem Soc. 2015;137:2199–2202. doi: 10.1021/ja512951e. [DOI] [PubMed] [Google Scholar]
- 33.Zhao J, Nunn WT, Lemaire PC, Lin Y, Dickey MD, Oldham CJ, Walls HJ, Peterson GW, Losego MD, Parsons GN. Facile Conversion of Hydroxy Double Salts to Metal-Organic Frameworks Using Metal Oxide Particles and Atomic Layer Deposition Thin-Film Templates. J Am Chem Soc. 2015;137:13756–13759. doi: 10.1021/jacs.5b08752. [DOI] [PubMed] [Google Scholar]
- 34.Lemaire PC, Zhao J, Williams PS, Walls HJ, Shepherd SD, Losego MD, Peterson GW, Parsons GN. Copper Benzenetricarboxylate Metal–Organic Framework Nucleation Mechanisms on Metal Oxide Powders and Thin Films formed by Atomic Layer Deposition. ACS Appl Mater Interfaces. 2016;8:9514–9522. doi: 10.1021/acsami.6b01195. [DOI] [PubMed] [Google Scholar]
- 35.Zhao J, Lee DT, Yaga RW, Hall MG, Barton HF, Woodward IR, Oldham CJ, Walls HJ, Peterson GW, Parsons GN. Ultra-Fast Degradation of Chemical Warfare Agents Using MOF-Nanofiber Kebabs. Angew Chem Int Ed. 2016;55:13224–13228. doi: 10.1002/anie.201606656. [DOI] [PubMed] [Google Scholar]
- 36.Stassen I, Styles M, Grenci G, Gorp HV, Vanderlin-den W, Feyter SD, Falcaro P, Vos DD, Vereecken P, Ame-loot R. Chemical vapour deposition of zeolitic imidazolate framework thin films. Nat Mater. 2016;15:304–310. doi: 10.1038/nmat4509. [DOI] [PubMed] [Google Scholar]
- 37.Harrick N. Electric Field Strengths at Totally Reflecting Interfaces. J Opt Soc Am. 1965;55:851–857. [Google Scholar]
- 38.Tompkins HG. The Physical Basis for Analysis of the Depth of Absorbing Species Using Internal Reflection Spectroscopy. Appl Spectrosc. 1974;28:335–341. [Google Scholar]
Associated Data
This section collects any data citations, data availability statements, or supplementary materials included in this article.


