

Abstract
Several studies provide information useful to our understanding of restless legs syndrome (RLS), using various imaging techniques to investigate different aspects putatively involved in the pathophysiology of RLS, although there are discrepancies between these findings.
The majority of magnetic resonance imaging (MRI) studies using iron-sensitive sequences supports the presence of a diffuse, but regionally variable low brain-iron content, mainly at the level of the substantia nigra, but there is increasing evidence of reduced iron levels in the thalamus. Positron emission tomography (PET) and single positron emission computed tomography (SPECT) findings mainly support dysfunction of dopaminergic pathways involving not only the nigrostriatal but also mesolimbic pathways. None or variable brain structural or microstructural abnormalities have been reported in RLS patients; reports are slightly more consistent concerning levels of white matter. Most of the reported changes were in regions belonging to sensorimotor and limbic/nociceptive networks. Functional MRI studies have demonstrated activation or connectivity changes in the same networks. The thalamus, which includes different sensorimotor and limbic/nociceptive networks, appears to have lower iron content, metabolic abnormalities, dopaminergic dysfunction, and changes in activation and functional connectivity. Summarizing these findings, the primary change could be the reduction of brain iron content, which leads to dysfunction of mesolimbic and nigrostriatal dopaminergic pathways, and in turn to a dysregulation of limbic and sensorimotor networks. Future studies in RLS should evaluate the actual causal relationship among these findings, better investigate the role of neurotransmitters other than dopamine, focus on brain networks by connectivity analysis, and test the reversibility of the different imaging findings following therapy.
Keywords: Restless legs syndrome, Imaging, MRI, Connectivity, Pathophysiology, Network
1. Introduction
In recent years, several imaging studies have focused on the evaluation of the central nervous structures in restless legs syndrome (RLS) patients. Different imaging techniques have been used to investigate different aspects putatively involved in the pathophysiology of the disorder, providing a plethora of information useful to our understanding of RLS, albeit with some discrepancies in the findings and divergence in the interpretations offered.
These studies include positron emission tomography (PET) and single positron emission computed tomography (SPECT) studies, mainly focusing on the dopaminergic pathway, and magnetic resonance imaging (MRI) studies, employing various techniques such as iron-sensitive MRI methods, voxel-based morphometry (VBM), magnetic resonance spectroscopy (MRS), diffusion weighted sequences, and functional magnetic resonance imaging (fMRI) using a task or during the resting state.
Our aim was to review these studies and to report their findings as completely as possible, emphasizing possible knowledge gaps and suggesting further imaging studies that can be undertaken in RLS patients. Accordingly, we also briefly overviewed the currently available imaging modalities, including techniques which have not yet been used in patients with RLS, but which could give further useful pathophysiological data. We summarized the methodological concepts underlining the different techniques to help the clinicians to better understand their potentialities and limitations.
2. Methodological concepts
2.1. PET and SPECT
PET and SPECT both use tracers labeled by radioactive isotopes to study the density of particular receptors or the metabolism and the regional cerebral blood flow (rCBF) in specific areas [1].
As for the brain metabolism, PET mainly uses [18F]-2-fluoro-2-deoxy-D-glucose ([18F]FDG), which is radiolabeled glucose, as the brain metabolizes glucose as a major source of energy [1]. In contrast, SPECT imaging can only indirectly study the brain metabolism, measuring blood flow to the brain by injecting radiolabeled chemicals, such as 99mTc- hexamethylpropyleneamine oxime (HMPAO) or 99mTc-ethyl cysteinate dimer (ECD) ECD [2]. As for specific receptor density evaluation, a number of tracers are available for both PET and SPECT to study the different neurotransmitter pathways [1–7]. Most nuclear medicine studies in neurologic diseases, mainly in parkinsonism, have focused on the dopaminergic system, using radiotracers for both the presynaptic compartment (eg, ([123I] 2β-carbomethoxy-3β-(4-iodophenyl)tropane ([123I] βCIT), [123I]N-(3-iodopropen-2-yl)-2β-carbomethoxy-3β-(4-chlorophenyl)tropane ([123I]IPT) or [99mTc]TRODAT-1 in SPECT studies and [18F]dopa and [11C](+)-dihydrotetrabenazine ([11C]-DTBZ) in PET studies), and the postsynaptic compartment (eg, [123I] iodobenzamide ([123I]IBZM) in SPECT studies and [11C]raclopride or [11C]FLB 457 in PET studies) [1–6]. Furthermore, radiotracers for cholinergic, adrenergic, serotoninergic, γ-aminobutyric acid (GABA)-ergic, glutamatergic and opioidergic systems are available [1,5–10].
2.2. Iron-sensitive MRI methods
Currently, several MRI techniques have been used to measure non-heme iron content in brain tissue [11], including the commonly used relaxometry methods measuring R1, R2, R2* or R2′ [11–13], mapping of field-dependent transverse relaxation rate increase (FDRI) [14,15], magnetic field correlation (MFC) [16,17], phase imaging [18], susceptibility weighted imaging (SWI) [11,19], direct saturation imaging [20], and the recently developed quantitative susceptibility mapping (QSM) [21,22].
While each technique has its own limitations – R2 relaxation is affected by water content changes not related to iron, FDRI has to scan at two different field strengths, R2*/R2′ has possible contaminations from background field gradient, SWI is not quantitative, and phase imaging is a nonlocal measure, etc. [11,23] – previous studies have demonstrated strong linear correlations between tissue iron concentration in gray matter (GM) derived from literature [24] or measured directly [25] with those proposed iron-sensitive MRI methods [11]. Such correlation with tissue iron is usually low in white matter (WM) due to other possible contrast mechanisms including tissue microstructures or myelin lipids. Among all the proposed methods, the best-established and validated methods are the R2* or R2′ relaxometry which have been shown to be more sensitive to tissue iron concentration than R2 relaxometry [11,25]. Recent studies on QSM have also demonstrated its high sensitivity and specificity to ferritin bound tissue iron in cerebral GM [26–28]. Note that QSM images can be obtained from the MR phase data acquired using the same multi-echo gradient echo (GRE) sequences for deriving R2* measurement and have minimum contaminations from the background field gradient, thus combined use of QSM and R2* might give more information about tissue iron in the future [29].
2.3. MRS
MRS is a noninvasive method that permits measurement of the concentration of specific biochemical compounds in the brain in precisely defined regions guided by MR imaging [30]. MR spectroscopy provides a spectrum rather than an image, and can quantify spectra of many biologically important metabolites. Proton (1H)-MRS is the most used in clinical practice [31]. 1H-MRS can detect a number of metabolites including N-acetyl-aspartate-containing compounds (NAA) (markers for neuronal health, viability and number), choline-containing compounds (Cho) (major constituents of the membranes), creatine-phosphocreatine (Cr) (whose peak is relatively stable and commonly used as a concentration reference), glutamate and glutamine (Glx) (linked to excitatory neurotransmission), myo-inositol (mI) (a glial marker), scyllo-inositol (closely coupled with mI amount), lactate (the end product of anaerobic glycolysis) and lipids [32]. Using field strengths of 3.0 T and higher, it is possible to detect additional metabolites at short TEs, as the inhibitory neurotransmitter GABA and the antioxidant glutathione, and to separate glutamate (Glu) and glutamine (Gln). Up to 18 metabolites can be quantified at field strengths of 7.0 or 9.4 T [31,33–35].
2.4. Volumetric MRI
Progressive brain atrophy is an important and well-known feature of many central nervous system (CNS) disorders, including not only neurodegenerative diseases but also inflammatory conditions. A number of methods have been developed in the last decade to measure brain atrophy on high-resolution 3D T1-weighted MRI scans. Voxel based morphometry (VBM) [36] is able to detect subtle volume changes in the human brain by performing a voxel-by-voxel comparison of the regional attenuation of brain GM and WM intensity across groups of subjects. VBM strengths in comparison to older approaches are the reliability and reproducibility of the results as well as time saving. Furthermore, VBM does not require a priori hypothesis on the location of group differences and thus allows the exploration of the entire brain as a whole. An alternative method to measure subtle cortical changes in the human brain is the estimation of cortical thickness on T1-weighted images. This method requires the identification of the inner and outer cortical boundaries or surfaces in order to measure the cortical thickness. One of the most popular methods used to perform these calculations is provided by the Freesurfer software package (https://surfer.nmr.mgh.harvard.edu, Center for Biomedical Imaging, Charlestown, MA), which reconstructs a representation of the GM and WM surfaces and provides a measure of GM thickness using the distance between corresponding points on the two surfaces. To investigate differences in cortical thickness across subjects, Freesurfer employs non-rigid high-dimensional spherical averaging to align cortical folding patterns, brings all subjects to the same space, and makes them comparable [37]. The different cortical areas are then labeled on the basis of several atlases that are included in the software [38,39].
2.5. Diffusion tensor MRI and structural connectivity
Diffusion tensor MRI (DT MRI) is sensitive to the random thermal movement of water molecules (Brownian motion) in neural tissues and provides quantitative measurements of brain microstructure. Such diffusion properties can be measured using the tensor model, which allows calculation of the absolute magnitude of water diffusion, measured by mean diffusivity (MD), and the degree of anisotropy of such diffusion, represented by fractional anisotropy (FA). WM, which physically connects different brain regions, is characterized by an anisotropic diffusion of water molecules due to the linear structure of WM tracts, which allows the water molecules to diffuse freely along the axons but impedes their diffusion perpendicularly to the axonal main direction because of myelin [40]. Several methods can be used to explore brain WM integrity and structural connectivity. The first procedures to analyze DT MRI data employed region of interest (ROI)-based approaches, which require an examiner to select the areas of the brain of interest and then extract DT MRI metrics from those areas. More recently, voxel-wise, a priori hypothesis free approaches have been implemented for the analysis of DT MRI data. Tract-based spatial statistics (TBSS) [41], currently the most used procedure for performing voxel-wise DT MRI analyses, addresses the issue by introducing carefully tuned non-linear registration of FA images, followed by projection onto an alignment-invariant tract representation (skeleton). Another way to study DT MRI data is to reconstruct the WM tracts that physically connect the different regions of the brain. A number of DT MRI tractography algorithms have been developed to perform such studies. Their strength compared to a voxel-wise approach is the ability to resolve specific connections between different brain regions, their weakness, however, is that like ROI-based approaches, they require an a priori hypothesis and previous anatomical knowledge to position the seeds that are needed to create the tracts [42].
2.6. fMRI and functional connectivity
fMRI is able to measure neuronal activity by detecting modifications of the transverse magnetization relaxation time (either T2* in a gradient echo sequence, or T2 in a spin echo sequence) associated to the blood oxygenation level-dependent (BOLD) mechanism [43]. Brain activations can be studied by fMRI in two ways. First, the subject has to perform a task during the fMRI acquisition eliciting the activation of task specific areas (eg, motor, sensitive, visual, etc.). This approach is called ‘task-based fMRI’ and is useful to explore specific activation pattern changes due to the presence of different conditions (or diseases) in relation to a specific task. Second, neural activations can be measured on awake patients not performing any particular task. This is called ‘resting-state fMRI.’ Resting state fMRI is the most-used technique to explore functional connectivity by MRI. Particularly interesting are the low frequency oscillations (~0.01–0.1 Hz) of resting-state fMRI time-series, which are thought to originate from the spontaneous neuronal activation patterns that are measured by the BOLD effect. Functional connectivity can be explored by measuring the level of co-activation of resting-state fMRI time-series between brain regions. Several methods can be used to process resting-state fMRI data. Such methods can be divided into model-dependent and model free [44]. Model-dependent functional connectivity requires an ROI, which is also called a seed. The seed can be chosen according to an a priori hypothesis or based on a traditional task-based activation map. The results would be a functional connectivity map providing information about which brain regions are functionally linked to the ROI and the strength of such connection. The advantage of this approach resides in the simplicity of its application and the straightforwardness of the results. The disadvantage is the dependence on a priori hypotheses and the difficulty of exploring functional connectivity patterns at the whole brain scale. Model-free methods allow exploring brain functional connectivity without an a priori hypothesis and are thus suited to performing whole brain connectivity analyses. Different from seed-based methods, model-free methods are able to investigate general patterns of connectivity across all brain regions [45–49]. The most popular of these approaches, likely because of its high level of consistency, is independent component analysis (ICA) [46]. ICA is a mathematical method that maximizes the statistical independence between its components and can be applied to brain voxel-wise data without a priori assumptions. The main disadvantages are that this method requires the user to manually select the important components distinguishing noise from signal and that interpretation of results is more difficult [44].
2.7. Connectomics
The newest advances in MRI analysis techniques have offered the chance of investigating the overall structure and function of the brain network using graph analytical methods. Considering the complexity of the brain, the overall investigation of the brain network could provide novel highlights on how it actually works, revealing important information about both its structural and functional organization at the local and global levels [50]. Graph theory techniques can be applied on both functional and structural MRI (Fig. 1). The first step, for both imaging modalities, consists of the definition of the nodes of the brain network, which are the brain regions composing such a network; the connections between such regions are called edges. The most straightforward way to obtain brain nodes is by selecting an atlas which labels the brain regions and then registering it to the fMRI or DT MRI data [38,51,52]. With resting-state fMRI data, the connectivity between each pair of nodes is defined as the correlation coefficient of their BOLD fluctuations. With DT MRI data, whole-brain tractography is usually performed and WM tracts linking each pair of nodes are reconstructed. The number of streamlines of each tract or the DT MRI metrics of the tract are used as measures of structural connectivity. Structural and functional connectivity measurements can then be entered in connectivity matrices and used to build graphs describing brain networks (see Fig. 1).
Fig.1.
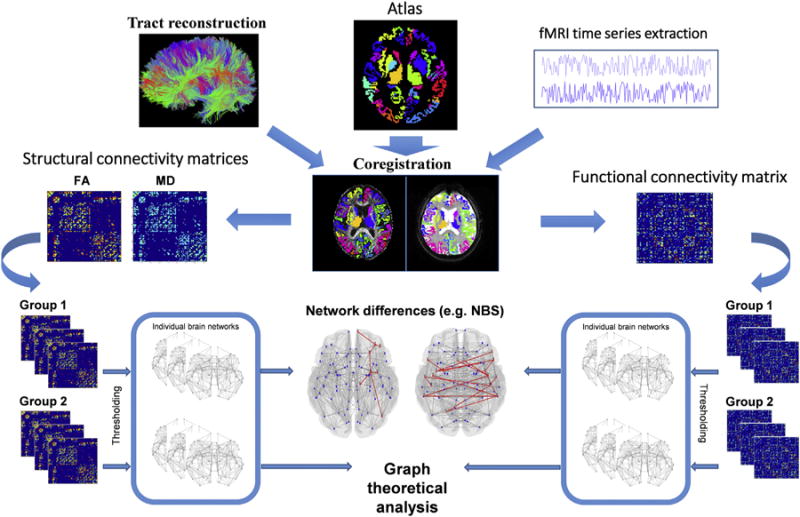
Schematic representation of the structural and functional connectome processing pipeline. The left half of the picture describes an example of pipeline required to perform the analysis of structural connectome. The right half of the picture summarizes the pipeline to process functional connectome data. ‘Network differences’ section: the red lines represent the significantly different connections across two groups, in terms of structural and functional connectivity. FA, fractional anisotropy; MD, mean diffusivity; NBS, network-based statistics. (For interpretation of the reference to color in this figure legend, the reader is referred to the web version of this article.)
Such graphs exhibit various organizational and topological properties that can be studied, such as centrality, clustering, efficiency, hierarchy, hubs, modularity, robustness, small-worldness, synchronizability [53]. Graph analysis has also been valuable in identifying functional or structural connections associated with a contrast of interest, like a group difference in a case–control comparison [54,55]. The characterization of network dysfunction in neurological conditions may be of fundamental importance for the characterization of the most vulnerable networks and to model the pathways of pathology spreading.
3. Imaging findings in RLS patients
3.1. PET and SPECT findings
A number of studies used PET or SPECT imaging in RLS patients. Only one study has used [18F]fluorodeoxyglucose PET to measure cerebral metabolism in six RLS patients without seeing abnormal regional metabolic uptake, although all patients were free of RLS symptoms during the PET scan examination [56]. Conversely, a SPECT study investigated rCBF in two patients with familial painful RLS during the state of pain induced by immobility, using [99mTc] HMPAO, finding reduced rCBF in the caudate nuclei and increased rCBF in the thalami and anterior cingulate with increasing pain [57].
The remaining part of the studies focused on the dopaminergic system at the level of both presynaptic and postsynaptic compartments. As for the presynaptic compartment, SPECT studies evaluated binding of dopamine to their specific transporters (DAT) located in the presynaptic terminals of the neurons [58–64], detecting no changes in most cases [58–62]. Conversely, two studies reported DAT dysfunction, a significantly decreased striatal [99mTc]TRODAT-1 binding in patients with early RLS [63], while an increased striatal DAT density in moderately severe old RLS patients at the level of the caudate and posterior putamen by using [123I] βCIT [64]. Three PET studies evaluated the presynaptic dopaminergic compartment by using [18F]dopa [56,65,66], disclosing no change in one [56] and a mild reduction of caudate and putamen uptake in the other two [65,66]. A further study used a PET ligand for DAT, [11C]-d-threo-methylphenidate, to scan patients for 90 min straight after tracer infusion in order to evaluate membrane-bound DAT rather than total cellular DAT as in the SPECT studies (which employ scans after a 24-h delay) [67]. A decreased binding potential in putamen and caudate but not in the ventral striatum of RLS subjects was detected [67].
As for postsynaptic dopamine (D2) receptors, three old SPECT studies [68–70] in ‘nocturnal myoclonus syndrome’ patients, in the majority associated with RLS, detected reduced [123I]IBZM striatal binding as well as one study on RLS patients [60]. No change in [123I]IBZM binding was detected by the other three studies [58,59,64]. PET studies mainly used [11C]raclopride to study post-synaptic D2 receptors in RLS patients. Two studies reported a reduced striatal uptake [66,71]. In one case, values were calculated not only for the striatal D2 receptor binding potentials per se, which were reduced, but also for the density of receptors on the membrane (βmax) and the receptor–ligand dissociation constant or receptor affinity (Kd), which were unchanged, together interpreted as increased synaptic dopamine [71]. A third PET study reported a significantly lower mean magnitude of [11C]raclopride binding potential in the mesolimbic dopamine region, ie, nucleus accumbens and caudate, but not in the nigrostriatal dopamine region, ie, putamen, in the RLS group [72]. The binding correlated negatively with clinical severity scores and positively with the degree of improvement after dopaminergic treatment [72]. The results of a further study supported a limbic dopaminergic impairment in RLS, although with opposite results, disclosing a higher [11C]raclopride binding potential in limbic and associative striatal subregions, and higher [11C] FLB 457 (a higher affinity D2 radioligand) binding potential in medial and posterior thalamus, anterior cingulate cortex and insulae [73]. All these brain structures serve the medial nociceptive system, involved in the affective-motivational component of pain. A negative correlation between RLS severity and the binding levels of the non-selective opioid receptor radioligand [11C] diprenorphine in orbitofrontal and anterior cingulate cortex was also found [74].
Finally, SPECT with [123I]βCIT tracer was used to study serotonergic neurotransmission in RLS, evaluating the availability of serotonin transporter (SERT) in the pons and medulla [75]. SERT availability was similar in both RLS and control groups, but negatively correlated with disease severity in RLS patients [75].
3.2. Iron-sensitive MRI findings
Iron-sensitive MRI methods have been used to quantify brain iron levels in RLS patients. The results support the hypothesis of reduced iron content in several regions of the brain of RLS patients, although with some discrepancies. Some authors have assessed regional brain iron concentration in RLS patients by R2′ measurement, defined as ‘iron index’, and reported lower iron content of the substantia nigra in the early-onset RLS patients (<45 years) [76,77]. Others evaluated the T2 relaxation time of the substantia nigra, and found low iron content in the pars compacta, but not in the pars reticulata, in patients with late-onset RLS [78]. Recently, the iron index in the substantia nigra was detected as significantly lower in patients with late-onset RLS than in controls, but not in patients with early-onset RLS, in a study using R2′ measurement by 3T MRI [79]. Another group, without differentiating between early-onset and late-onset cases, reported higher mean T2 values, suggesting lower iron content, of multiple regions (caudate head and medial, dorsal, and ventral thalamus) in RLS patients [80].
The findings of a phase imaging study also support reduced brain iron content in RLS patients [81]. Significantly higher phase values were present in the patients compared with healthy controls at the level of the substantia nigra, putamen, pallidum, and particularly the thalamus, indicating diffuse but regionally variable low brain iron content in idiopathic RLS patients [81].
During a very recent 7T MRI study, QSM has been applied to assess possible brain iron deficiency in RLS [82]. Example QSM images of a normal control and an age-matched RLS patient (both 69 years old) at the level of substantia nigra are shown in Fig. 2. Initial results from this study have shown significantly decreased iron levels as measured by magnetic susceptibility in the thalamus and dentate nucleus in the RLS patient group as compared to healthy controls [83].
Fig. 2.
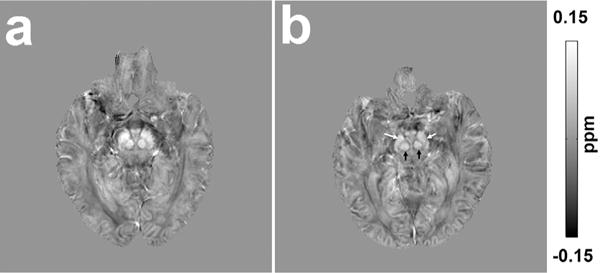
Quantitative susceptibility maps of a 69-year-old normal control (a) and a 69-year-old restless legs syndrome patient (b) showing the substantia nigra and red nucleus. Presented imaging data were acquired at 7T with 0.8-mm isotropic resolution using a single echo gradient echo sequence (TE/TR = 12/20 ms, flip angle 10°, bandwidth 169 Hz/px). Quantitative susceptibility values were estimated using the acquired magnetic resonance phase data (Laplacian-based phase unwrapping, V-SHARP for background phase removal and LSQR for quantitative susceptibility mapping (QSM) dipole inversion) and used to assess possible brain iron deficiency in restless legs syndrome. Higher intensity in the image indicates more paramagnetic thus higher iron content. Note the lower intensity of substantia nigra (white arrows) and red nucleus (black arrows) of a restless legs syndrome patient (b) compared to a normal control (a).
Discordant results are also present in the literature and specifically in two studies [84,85]. One study using T2* gradient echo MRI sequences did not find significant differences in regional signal intensity in levels of 12 regions of interest (substantia nigra, pallidum, caudate head, thalamus, occipital WM, and frontal WM bilaterally) [84]. A second study showed an unexpectedly decreased T2 relaxation time in the right internal globus pallidus and the subthalamic nucleus of untreated patients with early-onset RLS, indicating increased iron content, without any change in the substantia nigra [85]. Discordances could be explained by clinical inhomogeneity or by technical considerations. We have such an example from a study aimed at assessing the relationship between the different relaxometry methods and different ROI approaches using each of these methods on a single population of controls and RLS subjects [86]. Although detecting a lower iron content in several brain regions of the patients, such involvement changed with the different methods applied [86].
Support of the low brain iron content hypothesis in RLS has been obtained using a different technique, transcranial B-mode sonography. Indeed, some authors have reported hypoechogenicity of the substantia nigra [80,87–90], red nucleus, and brainstem raphe [89] of RLS patients. Substantia nigra hypoechogenicity inversely correlated with T2 values [80] and was interpreted as secondary to iron deficiency.
3.3. MRS findings
Two studies have used 1H-MRS in RLS patients by 1.5T MRI scanners [91,92]. Both studies evaluated the thalamus, although with a different localization of the volume of interest [91,92]. The aim of the first study was to evaluate the metabolism of the medial portion of the thalamus, as a part of the limbic and nociceptive system, in idiopathic RLS patients [91]. 1H-MRS revealed a significantly reduced NAA/Cr ratio and NAA concentrations in patients with RLS compared with healthy controls. Lower NAA concentrations were significantly associated with a family history of RLS. As for diffusion tensor imaging (DTI), VBM and volumetric and shape analysis of the thalami in the same subjects did not show differences between the two groups, the 1H-MRS findings suggested an involvement of medial thalamic nuclei of a functional nature rather than a neuronal loss. These results support the hypothesis that dysfunction of the limbic system plays a role in the pathophysiology of idiopathic RLS [91].
The second study investigated the whole right thalamus of RLS patients, disclosing an increase of the Glx/Cr ratio in patients compared to controls [92]. The Glx/Cr ratio correlated with the wake time during the sleep period and all other RLS-related polysomnographic sleep variables except for periodic limb movements (PLMs) per hour [92]. The findings supported the general hypothesis of increased glutamatergic activity in RLS, which together with dopaminergic dysfunction may lead to dual mechanisms potentially underlying the clinical abnormalities seen in RLS. Indeed, the authors suggested that glutamatergic pathology in RLS could underlie the arousal sleep disturbance and not the PLMs, more strongly related to the dopaminergic system [92].
A more recent 1H-MRS study used a high field (4T) MRI scanner and localized the volumes of interest not only in the thalamus but also in the dorsal anterior cingulate cortex and the cerebellum of RLS patients and controls subjects [93]. Levels of metabolites were no different between two groups in the thalamus and the cerebellum. However, GABA levels positively correlated with both PLM indices and RLS severity in the thalamus and negatively with both of these measures in the cerebellum in RLS subjects, suggesting that cerebellar–thalamic interactions may modulate the intensity of RLS sensory and motor symptoms [93]. As for the anterior cingulate cortex, NAA levels were higher in RLS than in controls, interpreted as being due to an overactivation of this structure possibly associated with the affective components of the painful symptoms in this disorder [93].
3.4. Structural MRI findings
Magnetic resonance studies using advanced techniques such as VBM and DTI have searched for subtle structural changes but report discordant results. The first VBM study in RLS patients detected bilateral GM increases in the pulvinar, interpreted as a consequence of a chronic increase in afferent input of behaviorally relevant information [94].
Subsequent VBM studies did not confirm these findings [78,95–102]. Most studies reported no changes [78,95–98]. The remaining studies showed small and variable abnormalities: (i) regional decreases of GM volume in the bihemispheric primary somatosensory cortex and left-sided primary motor areas [99]; (ii) a slight increase in GM density in the ventral hippocampus and middle orbitofrontal gyrus [100]; (iii) reductions in WM volumes in small areas of the genu of the corpus callosum, anterior cingulum, and precentral gyrus [101]; (iv) regional decreases of GM volume in the left hippocampal gyrus, both parietal lobes, medial frontal areas, and cerebellum [102].
DTI studies using a voxel-based or tract-based approach also reported variable abnormalities at the level of the WM of RLS patients. The finding included: (i) multiple bilateral subcortical areas of significantly reduced fractional anisotropy, mainly close to the primary and associated motor and somatosensory cortices [103], (ii) decreased FA in the genu of the corpus callosum and the inferior frontal gyrus WM [104], (iii) altered FA in subcortical WM, mainly in the temporal regions, the internal capsule, the pons, and the cerebellum [98]. A further study did not detect changes using a significance threshold corrected for multiple comparisons [97]. However, applying an uncorrected threshold the analyses revealed subtle abnormalities, ie, reduced FA and increased RD in the right peridentate WM, a correlation between IRLSSGRS score and MD and AD in the splenium of corpus callosum and the left sensory-motor WM, and a correlation between disease duration and MD, AD, and RD values in the right prefrontal WM [97].
Methodological differences in the analysis, the different significance threshold used, heterogeneity in terms of size, and clinical features of the samples studied contribute to the discrepant results obtained in the various structural studies. The findings of these studies could represent subtle and hard-to-detect primary changes or variable secondary alterations, the most part belonging to specific brain networks, as sensorimotor and limbic networks.
A more recent DTI study, restricting the analysis to the brainstem, showed significant FA alterations in two clusters in the midbrain bilaterally, along with a trend for lower FA values at the level of the second and third vertebra area in the patient sample (not significant after correction) [105]. The authors have hypothesized that such FA changes could involve the projections of the hypothalamic A11 neurons, which spread to the midbrain/brainstem and lead to spinal pathways [105].
3.5. Functional MRI findings
The first fMRI study in RLS investigated the patients under four different conditions: (i) during a symptom-free period, (ii) during sensory symptoms of the legs, (iii) during the occurrence of PLMs and sensory symptoms, (iv) while mimicking PLMs. An activation of the thalamus was associated with leg discomfort, activation of red nuclei and brainstem with PLMs, and activation of the cerebellum to both conditions [106]. A second study simultaneously used electromyography (EMG) and fMRI in seven RLS patients instructed not to move voluntarily [107]. The tonic EMG activity, negatively correlated with the degree of sensory leg discomfort, was associated with activation in motor and somatosensory areas such as precentral and postcentral gyri and the cerebellum, but was also correlated positively with activation of the posterior cingulate gyrus and negatively with the anterior cingulate gyrus [107]. Another fMRI study used a motor paradigm consisting of alternating active plantar flexion and dorsiflexion, showing an activation in primary motor cortex, primary somatosensory cortex, somatosensory association cortex, and the middle cerebellar peduncles in both RLS patients and controls, and in the thalamus, putamen, middle frontal gyrus, and anterior cingulate gyrus of the RLS patients only [85]. A further fMRI study was performed on RLS patients during the night, using a different paradigm, ie, random active asymmetric self-initiated movements of the feet to relieve their familiar uncomfortable sensations related to the RLS [78]. Patients activated the primary motor and somatosensory cortex, the thalamus, pars opercularis, the ventral anterior cingulum, the striatum, the inferior and superior parietal lobules, the dorsolateral prefrontal cortex, the cerebellum, the midbrain, and the pons [78]. The authors suggested that striatofrontolimbic activation could underlie the repetitive compulsive movements seen in RLS [78].
The intrinsic functional architecture in RLS can be better understood using a resting-state fMRI, which reflects spontaneous neuronal activity [108]. The DMN (default mode network) is a type of resting-state fMRI showing a network of brain regions that is active when an individual is not focused on the outside world and the brain is at a wakeful rest [109]. The DMN changes are usually observed in people who have brain dysfunctions that cause difficulties in being able to maintain a resting state, such as RLS. We can determine the presence of altered resting state brain connectivity, which may underlie RLS, by making an assessment during the asymptomatic period.
The typical discomfort of RLS symptoms is induced by rest or a low arousal state, but the threshold for induction has a circadian variation, lowest at night and highest in the morning [110]. The emergence of RLS symptoms may be related to altered brain functions dealing with internally generated stimuli.
In a previous study including comparison with healthy controls, RLS/WED patients during asymptomatic periods showed alterations in the resting state functional connectivity, which are associated with their symptoms [111]. All the connection changes in brain regions related to the thalamus observed in the study indicate that these regions may be associated with sensory monitoring and perception processing. It would be interesting to see the effect of dopaminergic drugs on modulation of pathologic circuits in the future. Additional research that examined the amplitude of low-frequency fluctuations (ALFF) before and after providing rTMS in the primary motor cortex reported intrinsic changes in the brain of an individual with RLS/WED during the resting state and showed that modulating these changes leads to improvement of the symptoms [112].
These resting-state fMRI results indicate that RLS subjects have abnormalities in network functions dealing with internal stimuli in the resting state even during a symptom-free period [111]. In another study using a resting-state functional MRI, significantly increased connectivities were observed in the sensory thalamic, ventral and dorsal attention, basal ganglia–thalamic, and cingulate networks in RLS patients [113]. These altered functional networks may be associated with altered attentional control of sensory inputs. A DMN study in RLS subjects during the asymptomatic resting state showed disturbances of the DMN [114]. These weaker extinction processes of the DMN may allow survival of undesirable sensations generated somewhere in the brain. The study also showed increased activity of the thalamic circuit. The authors hypothesized that this may come from the ‘resting-keeper’ circuit, which is necessary to keep the resting state so RLS patients can deal with the actual generation of discomfort [114]. These studies indicate that RLS patients may have deficits in controlling and managing sensory information. They may provide a basis for many of the perceptual changes observed in RLS patients and support the hypothesis that RLS is a disorder of somatosensory processing.
4. Discussion
Imaging studies in RLS patients have provided a number of findings useful for improving our understanding of the disease, although there are some discordances likely related to clinical differences in the studied samples and to different methodological approaches and technical parameters used.
The majority of the MRI studies using iron-sensitive sequences [76–83,86–90] support the presence of lower-brain iron content in RLS patients. Globally, these results are consistent with a diffuse but regionally variable low brain iron content, mainly at the level of substantia nigra, but with increased evidence of reduced iron level in the thalamus. PET and SPECT studies consistently support a dysfunction of dopaminergic pathways, involving not only the nigrostriatal pathway but also the mesolimbic pathway [60,63–73]. This is in agreement with the hypothesis linking iron and dopamine [115], as supported by pathological data and animal models [116]. Regarding the type of dopaminergic dysfunction, overall the D2 receptors and dopamine transporters (mostly the membrane-bound transporters) in the striatum are decreased in most of the nuclear medicine studies. These findings are compatible with an increase in synaptic dopamine [60,63,65–72], which does not seem to be compatible with efficacy of dopaminergic drugs in RLS patients. Different explanations could justify this apparent contradiction. First, the very low dosage of dopaminergic drugs used in the clinical practice can lead to a preferential binding to the dopaminergic autoreceptors, which have higher affinity for dopamine than heteroreceptors, resulting in a pre-synaptic feedback inhibition of dopamine release [117]. A different interpretation can be that increased dopaminergic stimulation produces a post-synaptic receptor down-regulation that, despite the overall dopamine increase, led to a relative evening and nighttime dopamine deficit, because of circadian dopaminergic activity pattern decreasing in the evening and night and increasing in the morning [118]. However, a more complex dopaminergic change remains possible, with different dopamine levels according to disease duration or clinical severity, or with some brain regions presenting hyperdopaminergic and others presenting hypodopaminergic activity.
None or variable brain structural or microstructural abnormality has been reported in RLS patients [94–105], slightly more consistent at the level of WM. These findings could reflect subtle primary changes if we take into account the results of genome-wide association studies reporting association of RLS with variants in genes also involved in developmental processes [119], or if we consider that myelin synthesis depends on iron, and brain iron deficiency in animals reduces myelin proteins [120,121]. In this scenario, the myelin deficit involving specific WM tracts could affect the connectivity among brain regions that are part of specific brain networks in RLS patients. Indeed, most of these changes were in regions belonging to sensory-motor and limbic/nociceptive networks. Accordingly, the fMRI studies have demonstrated activation or connectivity changes of cerebral areas belonging to the sensorimotor network and to the limbic/nociceptive network [78,85,106,107,111–114]. Conversely, they may be due to random or brain modifications secondary to chronic hypo- or hyperactivation of these brain networks. Future studies should better investigate the relationship between such structural changes and connectivity modifications.
An involvement of the limbic structures in RLS patients is also supported by metabolic alteration in the medial thalami and ACC disclosed by H1-MRS [91,93], by [99mTc]-HMPAO-SPECT [57], and by the limbic dopamine and opioid receptor evaluation by PET studies [73,74]. The limbic system involvement may underlie RLS patients’ compulsive urge to move. The overlap of the limbic with the nociceptive systems, and its role in the affective-motivational sensory-motor processing of the painful sensory inputs [122] fits well with the similarities of the sensory descriptors in RLS to those of neuropathic pain [123]. Furthermore, limbic dysfunction could explain the greater propensity of RLS patients to develop depressive and anxiety disorders [124–127], mild cognitive deficits [127–130], and sympathetic overactivity [131]. The involvement of the A11 diencephalospinal pathway, supported by the data from a single DTI study [105], could be included in the context of a multilevel demodulation of pain stimuli perception. The DMN circuit of RLS subjects may have differences compared to healthy control groups. The alterations of the DMN in RLS patients could be a putative basis for the sensory symptoms of RLS, which may be present to some degree even during the daytime asymptomatic period. Therefore, the analysis of the resting brain in the RLS patients could possibly give us more insight into RLS pathophysiology. Increasing evidence support the notion that RLS represents a complex network disorder, with involvement of specific brain networks dynamically interacting with each other, due to a metabolic/functional dysfunction. Accordingly, future connectivity studies may allow us to better understand which network is primarily or mainly affected, the relationship between function of different networks and dopaminergic activity, the possible changes of activation, and connectivity of different brain regions according to disease duration and clinical severity. In this field, more useful information could be obtained by connectomic analysis that evaluates the interaction among different networks or the specific functional involvement of brain regions being crucial for specific networks. Such regions, defined as hubs, represent nodes with high numbers of connections and an overall central position in a network’s topological organization. A crucial node of different networks, including sensory-motor and limbic/nociceptive, is the thalamus, which appears to have lower iron content [80,81,83], metabolic abnormalities [91–93], dopaminergic dysfunction [73], and changes in activation and functional connectivity [78,85,111]. This could reflect the dysfunction of the networks passing through the thalamus or suggest a specific role in an abnormal sensory-motor integration. Furthermore, the increased thalamic glutamate level reported by a 1H-MRS study is in line with the possible scenario of RLS as an arousal disorder, which deserves further investigations.
5. Conclusion
Imaging findings in RLS patients have provided evidence of low brain iron content, dopaminergic dysfunction, and involvement of specific brain networks. It may be hypothesized that the primary change is the reduction of brain iron content, likely due to decreased acquisition of iron by cells in the brain [132], which leads to a dysfunction of mesolimbic and nigrostriatal dopaminergic pathways, and in turn to a dysregulation of limbic network and sensorimotor networks resulting in the signs and symptoms of RLS (Fig. 3). However, imaging studies evaluating the actual causal relationship among these findings are still lacking. Furthermore, studies better investigating the role of neurotransmitters other than dopamine and further MRI studies focused on brain networks in RLS, eg, by structural and functional connectivity analysis, are needed.
Fig. 3.
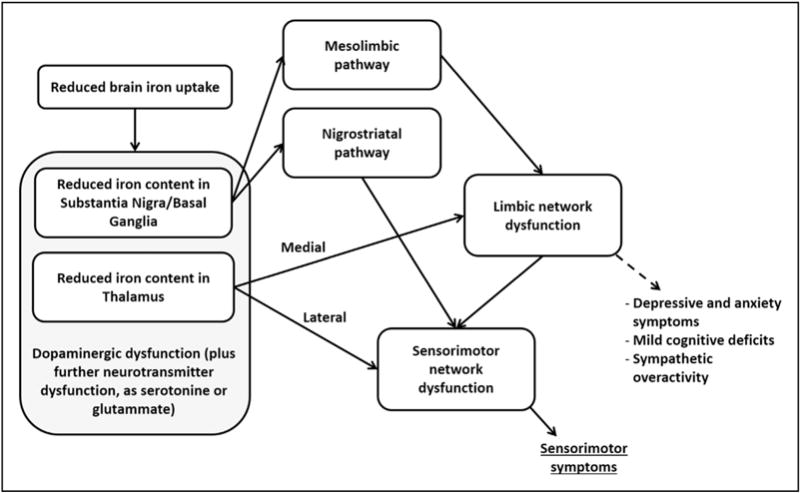
Schematic illustration of the possible pathophysiological integration of the currently available imaging findings in restless legs syndrome patients.
Future imaging studies in RLS patients may add further useful pathophysiologic information. Nuclear medicine studies should investigate possible neurotransmitter changes involving non-dopaminergic systems such as cholinergic, adrenergic, serotoninergic, GABAergic, and glutamatergic. We need studies using a multimodality approach to correlate the different findings, eg, iron levels with metabolic and functional abnormalities. Network analyses should be increased evaluating both structural and functional connectivity. Furthermore, studies testing the reversibility of the different imaging findings after therapy are required.
Acknowledgments
Part of Dr. Xu Li’s salary was supported by NIH/NIBIB: P41 EB015909 and Philips Healthcare.
Footnotes
Conflict of interest
The authors declare that there are no conflicts of interest.
The ICMJE Uniform Disclosure Form for Potential Conflicts of Interest associated with this article can be viewed by clicking on the following link: http://dx.doi.org/10.1016/j.sleep.2016.07.018.
References
- 1.Lu FM, Yuan Z. PET/SPECT molecular imaging in clinical neuroscience: recent advances in the investigation of CNS diseases. Quant Imaging Med Surg. 2015;5:433–47. doi: 10.3978/j.issn.2223-4292.2015.03.16. [DOI] [PMC free article] [PubMed] [Google Scholar]
- 2.Camargo EE. Brain SPECT in neurology and psychiatry. J Nucl Med. 2001;42:611–23. [PubMed] [Google Scholar]
- 3.Zhu L, Ploessl K, Kung HF. PET/SPECT imaging agents for neurodegenerative diseases. Chem Soc Rev. 2014;43:6683–91. doi: 10.1039/c3cs60430f. [DOI] [PMC free article] [PubMed] [Google Scholar]
- 4.Shen LH, Liao MH, Tseng YC. Recent advances in imaging of dopaminergic neurons for evaluation of neuropsychiatric disorders. J Biomed Biotechnol. 2012;2012:259349. doi: 10.1155/2012/259349. [DOI] [PMC free article] [PubMed] [Google Scholar]
- 5.Brooks DJ, Pavese N. Imaging biomarkers in Parkinson’s disease. Prog Neurobiol. 2011;95:614–28. doi: 10.1016/j.pneurobio.2011.08.009. [DOI] [PubMed] [Google Scholar]
- 6.Pappatà S, Salvatore E, Postiglione A. In vivo imaging of neurotransmission and brain receptors in dementia. J Neuroimaging. 2008;18:111–24. doi: 10.1111/j.1552-6569.2007.00194.x. [DOI] [PubMed] [Google Scholar]
- 7.Ametamey SM, Treyer V, Streffer J, et al. Human PET studies of metabotropic glutamate receptor subtype 5 with 11C-ABP688. J Nucl Med. 2007;48:247–52. [PubMed] [Google Scholar]
- 8.McConathy J, Kilts CD, Goodman MM. Radioligands for PET and SPECT imaging of the central noradrenergic system. CNS Spectr. 2001;6:704–9. doi: 10.1017/s1092852900001401. [DOI] [PubMed] [Google Scholar]
- 9.Lehto J, Hirvonen MM, Johansson J, et al. Validation of [(11)C]ORM-13070 as a PET tracer for alpha2c -adrenoceptors in the human brain. Synapse. 2015;69:172–81. doi: 10.1002/syn.21798. [DOI] [PubMed] [Google Scholar]
- 10.Nahimi A, Jakobsen S, Munk OL, et al. Mapping α2 adrenoceptors of the human brain with 11C-yohimbine. J Nucl Med. 2015;56:392–8. doi: 10.2967/jnumed.114.145565. [DOI] [PubMed] [Google Scholar]
- 11.Haacke EM, Cheng NY, House MJ, et al. Imaging iron stores in the brain using magnetic resonance imaging. Magn Reson Imaging. 2005;23:1–25. doi: 10.1016/j.mri.2004.10.001. [DOI] [PubMed] [Google Scholar]
- 12.Schenck JF. Imaging of brain iron by magnetic resonance: T2 relaxation at different field strengths. J Neurol Sci. 1995;134(Suppl):10–8. doi: 10.1016/0022-510x(95)00203-e. [DOI] [PubMed] [Google Scholar]
- 13.Graham JM, Paley MN, Grunewald RA, et al. Brain iron deposition in Parkinson’s disease imaged using the PRIME magnetic resonance sequence. Brain. 2000;123:2423–31. doi: 10.1093/brain/123.12.2423. [DOI] [PubMed] [Google Scholar]
- 14.Bartzokis G, Aravagiri M, Oldendorf WH, et al. Field dependent transverse relaxation rate increase may be a specific measure of tissue iron stores. Magn Reson Med. 1993;29:459–64. doi: 10.1002/mrm.1910290406. [DOI] [PubMed] [Google Scholar]
- 15.Bartzokis G, Tishler TA. MRI evaluation of basal ganglia ferritin iron and neurotoxicity in Alzheimer’s and Huntingon’s disease. Cell Mol Biol (Noisy-Le-Grand) 2000;46:821–33. [PubMed] [Google Scholar]
- 16.Jensen JH, Chandra R, Ramani A, et al. Magnetic field correlation imaging. Magn Reson Med. 2006;55:1350–61. doi: 10.1002/mrm.20907. [DOI] [PubMed] [Google Scholar]
- 17.Jensen JH, Szulc K, Hu C, et al. Magnetic field correlation as a measure of iron-generated magnetic field inhomogeneities in the brain. Magn Reson Med. 2009;61:481–5. doi: 10.1002/mrm.21823. [DOI] [PMC free article] [PubMed] [Google Scholar]
- 18.Ogg RJ, Langston JW, Haacke EM, et al. The correlation between phase shifts in gradient-echo MR images and regional brain iron concentration. Magn Reson Imaging. 1999;17:1141–8. doi: 10.1016/s0730-725x(99)00017-x. [DOI] [PubMed] [Google Scholar]
- 19.Haacke EM, Xu Y, Cheng YC, et al. Susceptibility weighted imaging (SWI) Magn Reson Med. 2004;52:612–8. doi: 10.1002/mrm.20198. [DOI] [PubMed] [Google Scholar]
- 20.Smith SA, Bulte JW, van Zijl PC. Direct saturation MRI: theory and application to imaging brain iron. Magn Reson Med. 2009;62:384–93. doi: 10.1002/mrm.21980. [DOI] [PMC free article] [PubMed] [Google Scholar]
- 21.Wang Y, Liu T. Quantitative susceptibility mapping (QSM): decoding MRI data for a tissue magnetic biomarker. Magn Reson Med. 2015;73:82–101. doi: 10.1002/mrm.25358. [DOI] [PMC free article] [PubMed] [Google Scholar]
- 22.Liu C, Li W, Tong KA, et al. Susceptibility-weighted imaging and quantitative susceptibility mapping in the brain. J Magn Reson Imaging. 2015;42:23–41. doi: 10.1002/jmri.24768. [DOI] [PMC free article] [PubMed] [Google Scholar]
- 23.Langkammer C, Ropele S, Pirpamer L, et al. MRI for iron mapping in Alzheimer’s disease. Neurodegener Dis. 2014;13:189–91. doi: 10.1159/000353756. [DOI] [PubMed] [Google Scholar]
- 24.Hallgren B, Sourander P. The effect of age on the non-haemin iron in the human brain. J Neurochem. 1958;3:41–51. doi: 10.1111/j.1471-4159.1958.tb12607.x. [DOI] [PubMed] [Google Scholar]
- 25.Langkammer C, Krebs N, Goessler W, et al. Quantitative MR imaging of brain iron: a postmortem validation study. Radiology. 2010;257:455–62. doi: 10.1148/radiol.10100495. [DOI] [PubMed] [Google Scholar]
- 26.Langkammer C, Schweser F, Krebs N, et al. Quantitative susceptibility mapping (QSM) as a means to measure brain iron? A post mortem validation study. Neuroimage. 2012;62:1593–9. doi: 10.1016/j.neuroimage.2012.05.049. [DOI] [PMC free article] [PubMed] [Google Scholar]
- 27.Lim IA, Faria AV, Li X, et al. Human brain atlas for automated region of interest selection in quantitative susceptibility mapping: application to determine iron content in deep gray matter structures. Neuroimage. 2013;82:449–69. doi: 10.1016/j.neuroimage.2013.05.127. [DOI] [PMC free article] [PubMed] [Google Scholar]
- 28.Zheng W, Nichol H, Liu S, et al. Measuring iron in the brain using quantitative susceptibility mapping and X-ray fluorescence imaging. Neuroimage. 2013;78:68–74. doi: 10.1016/j.neuroimage.2013.04.022. [DOI] [PMC free article] [PubMed] [Google Scholar]
- 29.Stuber C, Morawski M, Schafer A, et al. Myelin and iron concentration in the human brain: a quantitative study of MRI contrast. Neuroimage. 2014;93:95–106. doi: 10.1016/j.neuroimage.2014.02.026. [DOI] [PubMed] [Google Scholar]
- 30.Rizzo G, Tonon C, Manners D, et al. Imaging brain functional and metabolic changes in restless legs syndrome. Curr Neurol Neurosci Rep. 2013;13:372. doi: 10.1007/s11910-013-0372-1. [DOI] [PubMed] [Google Scholar]
- 31.Oz G, Alger JR, Barker PB, et al. Clinical proton MR spectroscopy in central nervous system disorders. Radiology. 2014;270:658–79. doi: 10.1148/radiol.13130531. [DOI] [PMC free article] [PubMed] [Google Scholar]
- 32.Govindaraju V, Young K, Maudsley AA. Proton NMR chemical shifts and coupling constants for brain metabolites. NMR Biomed. 2000;13:129–53. doi: 10.1002/1099-1492(200005)13:3<129::aid-nbm619>3.0.co;2-v. [DOI] [PubMed] [Google Scholar]
- 33.Mekle R, Mlyn arik V, Gambarota G, et al. MR spectroscopy of the human brain with enhanced signal intensity at ultrashort echo times on a clinical platform at 3T and 7T. Magn Reson Med. 2009;61:1279–85. doi: 10.1002/mrm.21961. [DOI] [PubMed] [Google Scholar]
- 34.Tkác I, Oz G, Adriany G, et al. In vivo 1H NMR spectroscopy of the human brain at high magnetic fields: metabolite quantification at 4T vs. 7T. Magn Reson Med. 2009;62:868–79. doi: 10.1002/mrm.22086. [DOI] [PMC free article] [PubMed] [Google Scholar]
- 35.Deelchand DK, Van de Moortele PF, Adriany G, et al. In vivo 1H NMR spectroscopy of the human brain at 9.4 T: initial results. J Magn Reson. 2010;206:74–80. doi: 10.1016/j.jmr.2010.06.006. [DOI] [PMC free article] [PubMed] [Google Scholar]
- 36.Ashburner J, Friston KJ. Voxel-based morphometry – the methods. Neuroimage. 2000;11:805–21. doi: 10.1006/nimg.2000.0582. [DOI] [PubMed] [Google Scholar]
- 37.Fischl B, Sereno MI, Tootell RB, et al. High-resolution intersubject averaging and a coordinate system for the cortical surface. Hum Brain Mapp. 1999;8:272–84. doi: 10.1002/(SICI)1097-0193(1999)8:4<272::AID-HBM10>3.0.CO;2-4. [DOI] [PMC free article] [PubMed] [Google Scholar]
- 38.Desikan RS, Segonne F, Fischl B, et al. An automated labeling system for subdividing the human cerebral cortex on MRI scans into gyral based regions of interest. Neuroimage. 2006;31:968–80. doi: 10.1016/j.neuroimage.2006.01.021. [DOI] [PubMed] [Google Scholar]
- 39.Destrieux C, Fischl B, Dale A, et al. Automatic parcellation of human cortical gyri and sulci using standard anatomical nomenclature. Neuroimage. 2010;53:1–15. doi: 10.1016/j.neuroimage.2010.06.010. [DOI] [PMC free article] [PubMed] [Google Scholar]
- 40.Beaulieu C. The basis of anisotropic water diffusion in the nervous system – a technical review. NMR Biomed. 2002;15:435–55. doi: 10.1002/nbm.782. [DOI] [PubMed] [Google Scholar]
- 41.Smith SM, Jenkinson M, Johansen-Berg H, et al. Tract-based spatial statistics: voxelwise analysis of multi-subject diffusion data. Neuroimage. 2006;31:1487–505. doi: 10.1016/j.neuroimage.2006.02.024. [DOI] [PubMed] [Google Scholar]
- 42.Jbabdi S, Johansen-Berg H. Tractography: where do we go from here? Brain Connect. 2011;1:169–83. doi: 10.1089/brain.2011.0033. [DOI] [PMC free article] [PubMed] [Google Scholar]
- 43.Ogawa S, Menon RS, Tank DW, et al. Functional brain mapping by blood oxygenation level-dependent contrast magnetic resonance imaging. A comparison of signal characteristics with a biophysical model. Biophys J. 1993;64:803–12. doi: 10.1016/S0006-3495(93)81441-3. [DOI] [PMC free article] [PubMed] [Google Scholar]
- 44.van den Heuvel MP, Hulshoff Pol HE. Exploring the brain network: a review on resting-state fMRI functional connectivity. Eur Neuropsychopharmacol. 2010;20:519–34. doi: 10.1016/j.euroneuro.2010.03.008. [DOI] [PubMed] [Google Scholar]
- 45.Friston KJ. The disconnection hypothesis. Schizophr Res. 1998;30:115–25. doi: 10.1016/s0920-9964(97)00140-0. [DOI] [PubMed] [Google Scholar]
- 46.Calhoun VD, Adali T, Pearlson GD, et al. A method for making group inferences from functional MRI data using independent component analysis. Hum Brain Mapp. 2001;14:140–51. doi: 10.1002/hbm.1048. [DOI] [PMC free article] [PubMed] [Google Scholar]
- 47.Cordes D, Haughton V, Carew JD, et al. Hierarchical clustering to measure connectivity in fMRI resting-state data. Magn Reson Imaging. 2002;20:305–17. doi: 10.1016/s0730-725x(02)00503-9. [DOI] [PubMed] [Google Scholar]
- 48.Thirion B, Dodel S, Poline JB. Detection of signal synchronizations in resting-state fMRI datasets. Neuroimage. 2006;29:321–7. doi: 10.1016/j.neuroimage.2005.06.054. [DOI] [PubMed] [Google Scholar]
- 49.van den Heuvel M, Mandl R, Hulshoff Pol H. Normalized cut group clustering of resting-state FMRI data. PLoS ONE. 2008;3:e2001. doi: 10.1371/journal.pone.0002001. [DOI] [PMC free article] [PubMed] [Google Scholar]
- 50.Fornito A, Zalesky A, Breakspear M. The connectomics of brain disorders. Nat Rev Neurosci. 2015;16:159–72. doi: 10.1038/nrn3901. [DOI] [PubMed] [Google Scholar]
- 51.Tzourio-Mazoyer N, Landeau B, Papathanassiou D, et al. Automated anatomical labeling of activations in SPM using a macroscopic anatomical parcellation of the MNI MRI single-subject brain. Neuroimage. 2002;15:273–89. doi: 10.1006/nimg.2001.0978. [DOI] [PubMed] [Google Scholar]
- 52.Fornito A, Zalesky A, Bullmore ET. Network scaling effects in graph analytic studies of human resting-state FMRI data. Front Syst Neurosci. 2010;4:22. doi: 10.3389/fnsys.2010.00022. [DOI] [PMC free article] [PubMed] [Google Scholar]
- 53.Bullmore E, Sporns O. Complex brain networks: graph theoretical analysis of structural and functional systems. Nat Rev Neurosci. 2009;10:186–98. doi: 10.1038/nrn2575. [DOI] [PubMed] [Google Scholar]
- 54.Zalesky A, Fornito A, Bullmore ET. Network-based statistic: identifying differences in brain networks. Neuroimage. 2010;53:1197–207. doi: 10.1016/j.neuroimage.2010.06.041. [DOI] [PubMed] [Google Scholar]
- 55.Filippi M, van den Heuvel MP, Fornito A, et al. Assessment of system dysfunction in the brain through MRI-based connectomics. Lancet Neurol. 2013;12:1189–99. doi: 10.1016/S1474-4422(13)70144-3. [DOI] [PubMed] [Google Scholar]
- 56.Trenkwalder C, Walters AS, Hening WA, et al. Positron emission tomographic studies in restless legs syndrome. Mov Disord. 1999;14:141–5. doi: 10.1002/1531-8257(199901)14:1<141::aid-mds1024>3.0.co;2-b. [DOI] [PubMed] [Google Scholar]
- 57.San Pedro EC, Mountz JM, Mountz JD, et al. Familial painful restless legs syndrome correlates with pain dependent variation of blood flow to the caudate, thalamus, and anterior cingulate gyrus. J Rheumatol. 1998;25:2270–5. [PubMed] [Google Scholar]
- 58.Eisensehr I, Wetter TC, Linke R, et al. Normal IPT and IBZM SPECT in drug-naive and levodopa-treated idiopathic restless legs syndrome. Neurology. 2001;57:1307–9. doi: 10.1212/wnl.57.7.1307. [DOI] [PubMed] [Google Scholar]
- 59.Tribl GG, Asenbaum S, Klosch G, et al. Normal IPT and IBZM SPECT in drug naive and levodopa-treated idiopathic restless legs syndrome. Neurology. 2002;59:649–50. doi: 10.1212/wnl.59.4.649. [DOI] [PubMed] [Google Scholar]
- 60.Michaud M, Soucy JP, Chabli A, et al. SPECT imaging of striatal pre and postsynaptic dopaminergic status in restless legs syndrome with periodic leg movements in sleep. J Neurol. 2002;249:164–70. doi: 10.1007/pl00007859. [DOI] [PubMed] [Google Scholar]
- 61.Linke R, Eisensehr I, Wetter TC, et al. Presynaptic dopaminergic function in patients with restless legs syndrome: are there common features with early Parkinson’s disease? Mov Disord. 2004;19:1158–62. doi: 10.1002/mds.20226. [DOI] [PubMed] [Google Scholar]
- 62.Mrowka M, Jobges M, Berding G, et al. Computerized movement analysis and beta-CIT-SPECT in patients with restless legs syndrome. J Neural Transm. 2005;112:693–701. doi: 10.1007/s00702-004-0217-9. [DOI] [PubMed] [Google Scholar]
- 63.Lin CC, Fan YM, Lin GY, et al. 99mTc-TRODAT-1 SPECT as a potential neuroimaging biomarker in patients with restless legs syndrome. Clin Nucl Med. 2016;4:e14–17. doi: 10.1097/RLU.0000000000000916. [DOI] [PubMed] [Google Scholar]
- 64.Kim KW, Jhoo JH, Lee SB, et al. Increased striatal dopamine transporter density in moderately severe old restless legs syndrome patients. Eur J Neurol. 2012;19:1213–8. doi: 10.1111/j.1468-1331.2012.03705.x. [DOI] [PubMed] [Google Scholar]
- 65.Ruottinen HM, Partinen M, Hublin C, et al. An FDOPA PET study in patients with periodic limb movement disorder and restless legs syndrome. Neurology. 2000;54:502–4. doi: 10.1212/wnl.54.2.502. [DOI] [PubMed] [Google Scholar]
- 66.Turjanski N, Lees AJ, Brooks DJ. Striatal dopaminergic function in restless legs syndrome. 18F-dopa and 11C-raclopride PET studies. Neurology. 1999;52:932–7. doi: 10.1212/wnl.52.5.932. [DOI] [PubMed] [Google Scholar]
- 67.Earley CJ, Kuwabara H, Wong DF, et al. The dopamine transporter is decreased in the striatum of subjects with restless legs syndrome. Sleep. 2011;34:341–7. doi: 10.1093/sleep/34.3.341. [DOI] [PMC free article] [PubMed] [Google Scholar]
- 68.Staedt J, Stoppe G, Kögler A, et al. Dopamine D2 receptor alteration in patients with periodic movements in sleep (nocturnal myoclonus) J Neural Transm. 1993;93:71–4. doi: 10.1007/BF01244940. [DOI] [PubMed] [Google Scholar]
- 69.Staedt J, Stoppe G, Kögler A, et al. Nocturnal myoclonus syndrome (periodic movements in sleep) related to central dopamine D2-receptor alteration. Eur Arch Psychiatry Clin Neurosci. 1995;245:8–10. doi: 10.1007/BF02191538. [DOI] [PubMed] [Google Scholar]
- 70.Staedt J, Stoppe G, Kögler A, et al. Single photon emission tomography (SPET) imaging of dopamine D2-receptors in the course of dopamine replacement therapy in patients with nocturnal myoclonus syndrome (NMS) J Neural Transm. 1995;99:187–93. doi: 10.1007/BF01271478. [DOI] [PubMed] [Google Scholar]
- 71.Earley CJ, Kuwabara H, Wong DF, et al. Increased synaptic dopamine in the putamen in restless legs syndrome. Sleep. 2013;36:51–7. doi: 10.5665/sleep.2300. [DOI] [PMC free article] [PubMed] [Google Scholar]
- 72.Oboshi Y, Ouchi Y, Yagi S, et al. In vivo mesolimbic D2/3 receptor binding predicts post therapeutic clinical responses in restless legs syndrome: a positron emission tomography study. J Cereb Blood Flow Metab. 2012;32:654–62. doi: 10.1038/jcbfm.2011.201. [DOI] [PMC free article] [PubMed] [Google Scholar]
- 73.Cervenka S, Pålhagen SE, Comley RA, et al. Support for dopaminergic hypoactivity in restless legs syndrome: a PET study on D2-receptor binding. Brain. 2006;129:2017–28. doi: 10.1093/brain/awl163. [DOI] [PubMed] [Google Scholar]
- 74.von Spiczak S, Whone AL, Hammers A, et al. The role of opioids in restless legs syndrome: an [11C]diprenorphine PET study. Brain. 2005;128:906–17. doi: 10.1093/brain/awh441. [DOI] [PubMed] [Google Scholar]
- 75.Jhoo JH, Yoon IY, Kim YK, et al. Availability of brain serotonin transporters in patients with restless legs syndrome. Neurology. 2010;74:513–8. doi: 10.1212/WNL.0b013e3181cef824. [DOI] [PubMed] [Google Scholar]
- 76.Allen RP, Barker PB, Wehrl F, et al. MRI measurement of brain iron in patients with restless legs syndrome. Neurology. 2001;56:263–5. doi: 10.1212/wnl.56.2.263. [DOI] [PubMed] [Google Scholar]
- 77.Earley CJ, B Barker P, Horska A, et al. MRI-determined regional brain iron concentrations in early- and late-onset restless legs syndrome. Sleep Med. 2006;7:458–61. doi: 10.1016/j.sleep.2005.11.009. [DOI] [PubMed] [Google Scholar]
- 78.Margariti PN, Astrakas LG, Tsouli SG, et al. Investigation of unmedicated early onset restless legs syndrome by voxel-based morphometry, T2 relaxometry, and functional MR imaging during the night-time hours. AJNR Am J Neuroradiol. 2012;33:667–72. doi: 10.3174/ajnr.A2829. [DOI] [PMC free article] [PubMed] [Google Scholar]
- 79.Moon HJ, Chang Y, Lee YS, et al. T2 relaxometry using 3.0-tesla magnetic resonance imaging of the brain in early- and late-onset restless legs syndrome. J Clin Neurol. 2014;10:197–202. doi: 10.3988/jcn.2014.10.3.197. [DOI] [PMC free article] [PubMed] [Google Scholar]
- 80.Godau J, Klose U, Di Santo A, et al. Multiregional brain iron deficiency in restless legs syndrome. Mov Disord. 2008;23:1184–7. doi: 10.1002/mds.22070. [DOI] [PubMed] [Google Scholar]
- 81.Rizzo G, Manners D, Testa C, et al. Low brain iron content in idiopathic Restless Legs Syndrome patients detected by phase imaging. Mov Disord. 2013;28:1886–90. doi: 10.1002/mds.25576. [DOI] [PubMed] [Google Scholar]
- 82.Li X, Liu H, Allen RP, et al. Assessment of brain iron deficiency in restless legs syndrome (RLS) using quantitative susceptibility mapping at 7T. Milan, Italy: ISMRM; 2014. p. 3270. [Google Scholar]
- 83.Li X, Liu H, Allen RP, et al. Quantitative susceptibility mapping (QSM) indicates possible iron deficiency in the thalamus and dentate nucleus in restless legs syndrome (RLS) Toronto, Canada: ISMRM; 2015. p. 1736. [Google Scholar]
- 84.Knake S, Heverhagen JT, Menzler K, et al. Normal regional brain iron concentration in restless legs syndrome measured by MRI. Nat Sci Sleep. 2009;2:19–22. [PMC free article] [PubMed] [Google Scholar]
- 85.Astrakas LG, Konitsiotis S, Margariti P, et al. T2 relaxometry and fMRI of the brain in late-onset restless legs syndrome. Neurology. 2008;71:911–6. doi: 10.1212/01.wnl.0000325914.50764.a2. [DOI] [PubMed] [Google Scholar]
- 86.Moon HJ, Chang Y, Lee YS, et al. A comparison of MRI tissue relaxometry and ROI methods used to determine regional brain iron concentrations in restless legs syndrome. Med Devices (Auckl) 2015;8:341–50. doi: 10.2147/MDER.S83629. [DOI] [PMC free article] [PubMed] [Google Scholar]
- 87.Schmidauer C, Sojer M, Seppi K, et al. Transcranial ultrasound shows nigral hypoechogenicity in restless legs syndrome. Ann Neurol. 2005;58:630–4. doi: 10.1002/ana.20572. [DOI] [PubMed] [Google Scholar]
- 88.Godau J, Schweitzer KJ, Liepelt I, et al. Substantia nigra hypoechogenicity: definition and findings in restless legs syndrome. Mov Disord. 2007;22:187–92. doi: 10.1002/mds.21230. [DOI] [PubMed] [Google Scholar]
- 89.Godau J, Wevers AK, Gaenslen A, et al. Sonographic abnormalities of brainstem structures in restless legs syndrome. Sleep Med. 2008;9:782–9. doi: 10.1016/j.sleep.2007.09.001. [DOI] [PubMed] [Google Scholar]
- 90.Ryu JH, Lee MS, Baik JS. Sonographic abnormalities in idiopathic restless legs syndrome (RLS) and RLS in Parkinson’s disease. Parkinsonism Relat Disord. 2011;17:201–3. doi: 10.1016/j.parkreldis.2010.11.014. [DOI] [PubMed] [Google Scholar]
- 91.Rizzo G, Tonon C, Testa C, et al. Abnormal medial thalamic metabolism in patients with idiopathic restless legs syndrome. Brain. 2012;135:3712–20. doi: 10.1093/brain/aws266. [DOI] [PubMed] [Google Scholar]
- 92.Allen RP, Barker PB, Horská A, et al. Thalamic glutamate/glutamine in restless legs syndrome: increased and related to disturbed sleep. Neurology. 2013;80:2028–34. doi: 10.1212/WNL.0b013e318294b3f6. [DOI] [PMC free article] [PubMed] [Google Scholar]
- 93.Winkelman JW, Schoerning L, Platt S, et al. Restless legs syndrome and central nervous system gamma-aminobutyric acid: preliminary associations with periodic limb movements in sleep and restless leg syndrome symptom severity. Sleep Med. 2014;15:1225–30. doi: 10.1016/j.sleep.2014.05.019. [DOI] [PubMed] [Google Scholar]
- 94.Etgen T, Draganski B, Ilg C, et al. Bilateral thalamic gray matter changes in patients with restless legs syndrome. Neuroimage. 2005;24:1242–7. doi: 10.1016/j.neuroimage.2004.10.021. [DOI] [PubMed] [Google Scholar]
- 95.Celle S, Roche F, Peyron R, et al. Lack of specific gray matter alterations in restless legs syndrome in elderly subjects. J Neurol. 2010;257:344–8. doi: 10.1007/s00415-009-5320-2. [DOI] [PubMed] [Google Scholar]
- 96.Comley RA, Cervenka S, Palhagen SE, et al. A comparison of gray matter density in restless legs syndrome patients and matched controls using voxel-based morphometry. J Neuroimaging. 2012;22:28–32. doi: 10.1111/j.1552-6569.2010.00536.x. [DOI] [PubMed] [Google Scholar]
- 97.Rizzo G, Manners D, Vetrugno R, et al. Combined brain voxel-based morphometry and diffusion tensor imaging study in idiopathic restless legs syndrome patients. Eur J Neurol. 2012;19:1045–9. doi: 10.1111/j.1468-1331.2011.03604.x. [DOI] [PubMed] [Google Scholar]
- 98.Belke M, Heverhagen JT, Keil B, et al. DTI and VBM reveal white matter changes without associated gray matter changes in patients with idiopathic restless legs syndrome. Brain Behav. 2015;5:e00327. doi: 10.1002/brb3.327. [DOI] [PMC free article] [PubMed] [Google Scholar]
- 99.Unrath A, Juengling FD, Schork M, et al. Cortical grey matter alterations in idiopathic restless legs syndrome: an optimized voxel-based morphometry study. Mov Disord. 2007;22:1751–6. doi: 10.1002/mds.21608. [DOI] [PubMed] [Google Scholar]
- 100.Hornyak M, Ahrendts JC, Spiegelhalder K, et al. Voxel-based morphometry in unmedicated patients with restless legs syndrome. Sleep Med. 2007;9:22–6. doi: 10.1016/j.sleep.2006.09.010. [DOI] [PubMed] [Google Scholar]
- 101.Connor JR, Ponnuru P, Lee BY, et al. Postmortem and imaging based analyses reveal CNS decreased myelination in restless legs syndrome. Sleep Med. 2011;12:614–9. doi: 10.1016/j.sleep.2010.10.009. [DOI] [PMC free article] [PubMed] [Google Scholar]
- 102.Chang Y, Chang HW, Song H, et al. Gray matter alteration in patients with restless legs syndrome: a voxel-based morphometry study. Clin Imaging. 2015;39:20–5. doi: 10.1016/j.clinimag.2014.07.010. [DOI] [PubMed] [Google Scholar]
- 103.Unrath A, Müller HP, Ludolph AC, et al. Cerebral white matter alterations in idiopathic restless legs syndrome, as measured by diffusion tensor imaging. Mov Disord. 2008;23:1250–5. doi: 10.1002/mds.22074. [DOI] [PubMed] [Google Scholar]
- 104.Chang Y, Paik JS, Lee HJ, et al. Altered white matter integrity in primary restless legs syndrome patients: diffusion tensor imaging study. Neurol Res. 2014;36:769–74. doi: 10.1179/1743132814Y.0000000336. [DOI] [PubMed] [Google Scholar]
- 105.Lindemann K, Müller HP, Ludolph AC, et al. Microstructure of the midbrain and cervical spinal cord in idiopathic restless legs syndrome: a diffusion tensor imaging study. Sleep. 2016;39(2):423–8. doi: 10.5665/sleep.5456. pii: sp-00170-15; Epub ahead of print. [DOI] [PMC free article] [PubMed] [Google Scholar]
- 106.Bucher SF, Seelos KC, Oertel WH, et al. Cerebral generators involved in the pathogenesis of the restless legs syndrome. Ann Neurol. 1997;41:639–45. doi: 10.1002/ana.410410513. [DOI] [PubMed] [Google Scholar]
- 107.Spiegelhalder K, Feige B, Paul D, et al. Cerebral correlates of muscle tone fluctuations in restless legs syndrome: a pilot study with combined functional magnetic resonance imaging and anterior tibial muscle electromyography. Sleep Med. 2008;9:177–83. doi: 10.1016/j.sleep.2007.03.021. [DOI] [PubMed] [Google Scholar]
- 108.Deco G, Jirsa VK, McIntosh AR. Emerging concepts for the dynamical organization of resting-state activity in the brain. Nat Rev Neurosci. 2011;12:43–56. doi: 10.1038/nrn2961. [DOI] [PubMed] [Google Scholar]
- 109.Raichle ME, MacLeod AM, Snyder AZ, et al. A default mode of brain function. Proc Natl Acad Sci USA. 2001;98:676–82. doi: 10.1073/pnas.98.2.676. [DOI] [PMC free article] [PubMed] [Google Scholar]
- 110.Hening WA, Walters AS, Wagner M, et al. Circadian rhythm of motor restlessness and sensory symptoms in the idiopathic restless legs syndrome. Sleep. 1999;22:901–12. doi: 10.1093/sleep/22.7.901. [DOI] [PubMed] [Google Scholar]
- 111.Ku J, Cho YW, Lee YS, et al. Functional connectivity alternation of the thalamus in restless legs syndrome patients during the asymptomatic period: a resting-state connectivity study using functional magnetic resonance imaging. Sleep Med. 2014;15:289–94. doi: 10.1016/j.sleep.2013.09.030. [DOI] [PubMed] [Google Scholar]
- 112.Liu C, Dai Z, Zhang R, et al. Mapping intrinsic functional brain changes and repetitive transcranial magnetic stimulation neuromodulation in idiopathic restless legs syndrome: a resting-state functional magnetic resonance imaging study. Sleep Med. 2015;16:785–91. doi: 10.1016/j.sleep.2014.12.029. [DOI] [PubMed] [Google Scholar]
- 113.Gorges M, Rosskopf J, Müller HP, et al. Patterns of increased intrinsic functional connectivity in patients with restless legs syndrome are associated with attentional control of sensory inputs. Neurosci Lett. 2016;617:264–9. doi: 10.1016/j.neulet.2016.02.043. [DOI] [PubMed] [Google Scholar]
- 114.Ku J, Lee YS, Chang HW, et al. Default mode network disturbances in restless legs syndrome/Willis–Ekbom disease. Sleep Med. 2016;23:6–11. doi: 10.1016/j.sleep.2016.05.007. http://dx.doi.org/10.1016/j.sleep.2016.05.007. [DOI] [PubMed] [Google Scholar]
- 115.Allen RP, Earley CJ. The role of iron in restless legs syndrome. Mov Disord. 2007;22:S440–8. doi: 10.1002/mds.21607. [DOI] [PubMed] [Google Scholar]
- 116.Connor JR, Wang XS, Allen RP, et al. Altered dopaminergic profile in the putamen and substantia nigra in restless leg syndrome. Brain. 2009;132:2403–12. doi: 10.1093/brain/awp125. [DOI] [PMC free article] [PubMed] [Google Scholar]
- 117.Ford CP. The role of D2-autoreceptors in regulating dopamine neuron activity and transmission. Neuroscience. 2014;282C:13–22. doi: 10.1016/j.neuroscience.2014.01.025. [DOI] [PMC free article] [PubMed] [Google Scholar]
- 118.Allen RP. Restless leg syndrome/Willis-Ekbom disease pathophysiology. Sleep Med Clin. 2015;10:207–14. xi. doi: 10.1016/j.jsmc.2015.05.022. [DOI] [PMC free article] [PubMed] [Google Scholar]
- 119.Trenkwalder C, Högl B, Winkelmann J. Recent advances in the diagnosis, genetics and treatment of restless legs syndrome. J Neurol. 2009;256:539–53. doi: 10.1007/s00415-009-0134-9. [DOI] [PubMed] [Google Scholar]
- 120.Yu GS, Steinkirchner TM, Rao GA, et al. Effect of prenatal iron deficiency on myelination in rat pups. Am J Pathol. 1986;125:620–4. [PMC free article] [PubMed] [Google Scholar]
- 121.Ortiz E, Pasquini JM, Thompson K, et al. Effect of manipulation of iron storage, transport, or availability on myelin composition and brain iron content in three different animal models. J Neurosci Res. 2004;77:681–9. doi: 10.1002/jnr.20207. [DOI] [PubMed] [Google Scholar]
- 122.Price DD. Psychological and neural mechanisms of the affective dimension of pain. Science. 2000;288:1769–72. doi: 10.1126/science.288.5472.1769. [DOI] [PubMed] [Google Scholar]
- 123.Karroum EG, Golmard JL, Leu-Semenescu S, et al. Sensations in restless legs syndrome. Sleep Med. 2012;13:402–8. doi: 10.1016/j.sleep.2011.01.021. [DOI] [PubMed] [Google Scholar]
- 124.Winkelmann J, Prager M, Lieb R, et al. “Anxietas tibiarum”. Depression and anxiety disorders in patients with restless legs syndrome. J Neurol. 2005;252:67–71. doi: 10.1007/s00415-005-0604-7. [DOI] [PubMed] [Google Scholar]
- 125.Cho SJ, Hong JP, Hahm BJ, et al. Restless legs syndrome in a community sample of Korean adults: prevalence, impact on quality of life, and association with DSM-IV psychiatric disorders. Sleep. 2009;32:1069–76. [PMC free article] [PubMed] [Google Scholar]
- 126.Hornyak M. Depressive disorders in restless legs syndrome: epidemiology, pathophysiology and management. CNS Drugs. 2010;24:89–98. doi: 10.2165/11317500-000000000-00000. [DOI] [PubMed] [Google Scholar]
- 127.Celle S, Roche F, Kerleroux J, et al. Prevalence and clinical correlates of restless legs syndrome in an elderly French population: the synapse study. J Gerontol A Biol Sci Med Sci. 2010;65:167–73. doi: 10.1093/gerona/glp161. [DOI] [PubMed] [Google Scholar]
- 128.Pearson VE, Allen RP, Dean T, et al. Cognitive deficits associated with restless legs syndrome (RLS) Sleep Med. 2006;7:25–30. doi: 10.1016/j.sleep.2005.05.006. [DOI] [PubMed] [Google Scholar]
- 129.Gamaldo CE, Benbrook AR, Allen RP, et al. A further evaluation of the cognitive deficits associated with restless legs syndrome (RLS) Sleep Med. 2008;9:500–5. doi: 10.1016/j.sleep.2007.07.014. [DOI] [PMC free article] [PubMed] [Google Scholar]
- 130.Fulda S, Beitinger ME, Reppermund S, et al. Short-term attention and verbal fluency is decreased in restless legs syndrome patients. Mov Disord. 2010;25:2641–8. doi: 10.1002/mds.23353. [DOI] [PubMed] [Google Scholar]
- 131.Walters AS, Rye DB. Review of the relationship of restless legs syndrome and periodic limb movements in sleep to hypertension, heart disease, and stroke. Sleep. 2009;32:589–97. doi: 10.1093/sleep/32.5.589. [DOI] [PMC free article] [PubMed] [Google Scholar]
- 132.Connor JR, Patton S, Oexle K, et al. Iron and RLS: treatment, genetics and pathophysiology. Sleep Med. 2017;31:61–70. doi: 10.1016/j.sleep.2016.07.028. [DOI] [PMC free article] [PubMed] [Google Scholar]