

Summary
The MRI technique diffusion tensor imaging (DTI) is reviewed along with microstructural changes associated with prodromal Alzheimer's disease (AD) as a potential biomarker for clinical applications. The prodromal stage of AD is characterized by mild cognitive impairment (MCI), representing a transitional state between normal aging and AD. Microstructural abnormalities on DTI are promising in vivo biomarkers of gray and white matter changes associated with the progression of AD pathology. Elevated mean diffusivity and decreased fractional anisotropy are consistently found in prodromal AD, and even in cognitively normal elderly who progress to MCI. However, quality of parameter maps may be affected by artifacts of motion, susceptibility, and eddy current‐induced distortions. The DTI maps are typically analyzed by region‐of‐interest or voxel‐based analytic techniques such as tract‐based spatial statistics. DTI‐based index of diffusivity is complementary to macrostructural gray matter changes in the hippocampus in detecting prodromal AD. Breakdown of structural connectivity measured with DTI may impact cognitive performance during early AD. Furthermore, assessment of hippocampal connections may help in understanding the cerebral organization and remodeling associated with treatment response.
Keywords: Alzheimer's disease, Diffusion tensor imaging, Microstructural changes, Mild cognitive impairment
Introduction
Alzheimer's disease (AD) is the most common dementia beyond the age of 65. The prodromal stage in the disease process is characterized by mild cognitive impairment (MCI), representing the transition between normal aging and AD 1, 2, 3, 4. More and more investigators are attempting to identify biomarkers for earlier diagnoses of AD, a critical stage for preventive interventions 5, 6. Microstructural abnormalities on diffusion tensor imaging (DTI) are promising in vivo biomarkers of gray and white matter changes associated with the progression of AD pathology. Recent studies indicate diffusivity changes are early biomarkers in predicting AD progression independent of volume loss in prodromal AD 7, 8, 9, 10, 11.
Diffusion tensor imaging is a measure of random motion of water molecules. The directional dependence of proton diffusion in cerebral tissue is typically quantified as fractional anisotropy (FA), and the magnitude of diffusivity is quantified as mean diffusivity (MD). Elevated MD and decreased FA are thought to reflect progressive loss of the barriers restricting the motion of water molecules in tissue compartments associated with the neuronal loss and disruption of myelin sheaths in AD 8, 12, 13, 14.
Diffusion tensor imaging is inherently a noise‐sensitive and artifact‐prone technique; thus, image quality assurance and robust image analysis techniques are important. Furthermore, variety of methods have been used to extract measures related to MD and FA maps, ranging from manual delineation of regions of interest to voxel/tract‐based statistics to tractography. In this article, we review DTI methodologies focusing on clinical research applications in prodromal AD.
DTI Parameters and Quality Control
Parameters Characterizing the Diffusion Tensor
Diffusion tensor is reconstructed by combining diffusion measurements along at least six noncollinear spatial directions. MD and FA are the most commonly used parametric maps for characterizing the orientation‐dependent proton mobility in each voxel and correlating it with the tissue architecture. In an isotropic environment, such as in the gray matter, diffusion of water molecules follows a Gaussian distribution and exhibits the same behavior in all directions. When the random motion of water molecules are directionally restricted (e.g., due to white matter tracks), the degree of this anisotropic restriction is often expressed as FA, which ranges from 0 (isotropic diffusion) to 1 (diffusion exclusively along one direction). Gray matter is characterized by isotropic diffusion; therefore, FA values of the gray matter are typically low. Thus, MD, a measure of mean area of water diffusion per unit time, is typically used to assess the microstructural integrity of gray matter. The integrity of white matter is typically assessed with both MD and FA owing to anisotropic diffusion.
In healthy white matter, water molecules diffuse more freely along the axonal fibers but are relatively restricted perpendicular to the fibers due to tightly packed axons and myelin sheets that surround them. Thus, FA is high in healthy white matter tracks 15. When the integrity of axons and myelin is disrupted due to pathologic processes such as AD, alterations in the diffusion characteristics of water molecules, such as increases in MD and decreases in FA, are observed in the white matter 9, 12. These alterations in diffusion indices are not only observed in AD, but may also be observed in a variety of neurodegenerative disorders a well as MCI and even in the normal aging brain 7, 16, 17, 18, 19.
Mean diffusivity increases with degeneration of structural barriers that restrict the Brownian motion of water molecules such as myelin and cell membranes 8, 20, 21. Elevated MD in the hippocampus was consistently found in MCI and AD, where earliest neurodegenerative changes are observed 8, 13, 18. Patients with AD are further characterized by increased MD in the medial and lateral temporal, and parietal lobe association cortices. This pattern of MD changes differentiates AD from other neurodegenerative dementias such as dementia with Lewy bodies (DLB) and frontotemporal lobar degeneration (FTLD) 12, 22. Distribution of diffusivity changes in DLB and AD (Figure 1) indicated that amygdala is the only hemispheric structure involved with increases in MD in DLB, in agreement with progression of Lewy body pathology as it spreads to the temporal, occipital, and basal frontal association cortices following the involvement of amygdala. On the other hand, elevation of MD in AD involves the hippocampus and the parahippocampal gyrus early, because these are the earliest regions to be involved with the neurofibrillary pathology and neurodegeneration. White matter tracts that are on the pathways of this pathologic progression are differentially involved in these diseases. Whereas the inferior longitudinal fasciculus is involved both in AD and DLB, cingulum and fornix are only involved in AD 12.
Figure 1.
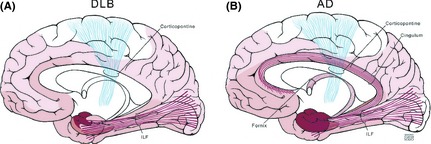
Diffusivity changes that characterize Alzheimer disease (AD) and dementia with Lewy bodies (DLB) follow pathologic progression. Distribution of Lewy body pathology (A) and neurofibrillary pathology of AD (B) are (A). In the cerebral cortex, the earliest and most severe involvement with the Lewy body pathology is in the amygdala (shown in dark red). Lewy body pathology spreads to the temporal, occipital, and basal frontal association cortices as the disease progresses (shown in light red). In keeping with the topography of pathologic involvement, diffusivity changes in the amygdala and the temporo‐occipital connections carried by the inferior longitudinal fasciculus (ILF) (shown in red) characterize the diffusion tensor imaging (DTI) abnormalities in DLB. The primary motor cortex (shown in white) and the corticopontine tracts (shown in blue) are generally spared and do not show DTI changes. (B) Hippocampus and the parahippocampal gyrus are the earliest regions to be involved with the neurofibrillary pathology of AD (shown in dark red). The neurofibrillary pathology spreads to the temporal and parietal lobe association cortices as the disease progresses (shown in light red). Diffusivity changes in AD follow the distribution of the neurofibrillary pathology and the associated neurodegeneration. The most significant DTI abnormalities are in the hippocampus and parahippocampal gyrus, and in the connecting tracts to these regions such as the ILF, cingulum, and fornix (shown in red). The primary motor cortex (shown in white) and the corticopontine tracts (shown in blue) are generally spared and do not show DTI changes (Reprinted, with permission from Mayo foundation and Neurology 12).
Common Artifacts on DTI
Artifacts may complicate diffusion parameters and their biologic interpretation. Physiologic noise and image artifacts as well as the analytic methods may contribute to variability in findings across studies 23. To differentiate artifacts from tissue signal, we summarize problems that may affect the quality of DTI parameter maps such as motion, susceptibility artifacts, and eddy current‐induced distortions (i.e., artifacts related with electric currents by a changing magnetic field in the conductor) (Table 1).
Table 1.
The source of artifacts in diffusion tensor imaging and suggested solutions
| Source of artifact | Performance | Solution |
|---|---|---|
| Motion | Global head motion | Keeping the subject immobile, sedation may be necessary |
| Physiologic motion (e.g., cardiac pulsation) | Cardiac gating the acquisition and post hoc rejection of contaminated data points | |
| Susceptibility | May be severe in regions adjacent to the bone and air (e.g., sinuses). | Sensitivity encoding and reversed gradient may be useful |
| Eddy current‐induced artifacts | A rim of high anisotropy along the phase‐encoding direction | Eddy current correction algorithms |
Typically, there are two fundamental sources of bulk motion artifact: general head movement and physiologic motion due to cardiac induced pulsations carried into the head as a pressure wave in CSF, primarily through the ventricles 24. Diffusion‐weighting gradients produce incoherent phase shifts sufficient for signal decay in the presence of microscopic thermal motion, thereby DTI is inherently highly sensitive to motion. A small amount of subject motion, even if it is due to flow from small vessels and cerebral spinal fluid by cardiac pulsation, can lead to a significant amount of phase shift or signal loss, which can severely affect image quality. Global head motion can be considered as a rigid body motion, a combination of global translation and rotation, which causes image blurring due to moving all spins at the same velocity and producing a linearly changing phase within the direction of the applied gradient. Cardiac pulsations are not rigid body motions and produce a nonlinearly changing phase in the spins across an image. This effect in k‐space, the 2D or 3D Fourier transform of the MR image measured, is a “smearing” of the parameter maps. One common method to reduce the effects of cardiac pulsations is cardiac gating of the acquisition 25.
Single‐shot echo planar imaging is commonly used to reduce motion sensitivity, but usually suffers from low resolution and low SNR. In addition, the transverse relaxation time constant (T2*) signal decay during the lengthy echo train leads to severe image blurring and further limits the spatial resolution of DTI images. The parameter images are further distorted due to susceptibility artifacts and are prone to slice‐specific eddy current‐induced distortions. Susceptibility effects are particularly severe in the brain in regions adjacent to the bone and air interphases (e.g., sinuses). Improved acquisition and reconstruction techniques may help to reduce the susceptibility effect, such as sensitivity encoding and reversed gradient 26, 27, 28, 29. Some distortions (e.g., stretches and shears) induced by eddy currents in the gradient coils may exhibit a rim of high anisotropy along the phase‐encoding direction in DTI parameter maps. Eddy currents can be corrected by matching the nondiffusion‐weighted images using cross‐correlation or mutual information‐based cost functions, masking signals from the cerebral spinal fluid by an extended tensor model and peripheral measurements, as well as prospective high order eddy current mitigation 30, 31, 32, 33.
Quality Control of Parameter Maps from DTI
Given the vast amount of acquired data, visual assessment by detailed slice‐by‐slice inspection of parameter maps to detect potential artifacts can be extremely time consuming. Different “orthogonal” views are inspected, to determine the interslice and intravolume variances. The most common artifacts that can be identified by visual assessment are coverage problems, focal artifacts due to cardiac pulsations such as those in the brain stem, and artifacts due to head motion. According to the severity of the artifact and the location (e.g., hemispheres vs. brain stem), a decision is made on whether or not to include or exclude the scan from further analysis.
Efficient algorithms, such as calculating the standard deviation across the different diffusion images to locate cardiac pulsation artifacts and to investigate image misalignment artifacts, were proposed 34, 35, 36. Another algorithm estimates both eddy current‐induced distortion artifacts and subject movement by finding the set of parameters that minimizes residual error when fitting data to the diffusion tensor model 37. This algorithm is useful for improving the artifact due to head motion. Binary least square maps have been proven to be powerful options to spot additional artifacts by flagging physically implausible signals such as FA values larger than 1 or when the diffusion tensor contains negative eigenvalues 38, 39. The weighted least square calculation is an option provided by FSL 5.0 (http://fsl.fmrib.ox.ac.uk/fsl/fslwiki/), to down‐weight the implausible intensity larger than 1 on FA maps 40.
Methodologies in Comparing Diffusion Parameters
Interpretation and comparison of findings from DTI parameter maps in both of cross‐sectional and longitudinal studies are complicated by the use of various methods of analysis, such as region‐of‐interest (ROI) or voxel‐wise approaches with voxel‐based analytic techniques (VBA) and tract‐based spatial statistics (TBSS) 41.
Quantitative ROI‐Based Techniques
Studies investigating DTI abnormalities in AD and MCI, reported reduced FA in white matter regions as well as increased MD in the hippocampus and other medial temporoparietal regions using ROI approaches8, 17, 20, 42. Region‐of‐interest drawing is often combined with manual tracing, masking, or tractography and provides an accurate quantitative measure of FA or MD from the tract of interest but is time consuming. Furthermore, ROI placement is hypothesis‐dependent on the regional distribution of white matter or gray matter alterations associated with AD pathology 43, 44. Therefore, ROI‐based analyses may be useful only when the target regions or tracts are already hypothesized to show abnormalities and can be anatomically identified.
Quantitative VBA Techniques
A growing number of studies employ VBA using statistical parametric mapping (SPM) (Wellcome Department of Cognitive Neurology, http://www.fil.ion.ucl.ac.uk/) to determine the topography of groupwise FA or MD differences of microstructural changes in the entire brain 45. VBA is a fully automated method of analysis and can be applied as a voxel‐wise investigation of whole brain diffusivity. Many imaging studies localized microstructural changes related to development, degeneration, and disease by VBA methodology 10, 11, 46, 47, 48. However, there are currently unresolved choices for the VBA methods such as the arbitrariness of the choice of spatial smoothing extent, which inevitably affect the group differences.
Quantitative Tract‐Based Analysis Techniques
Tract‐based spatial statistics is an option in FSL (FMRIB Software Library, http://www.fmrib.ox.ac.uk/fsl/) software. Results can be corrected for multiple comparisons using family‐wise error correction or threshold‐free cluster enhancement (TFCE), a method which avoids using an arbitrary threshold for the initial cluster formation 49, 50. Furthermore, TBSS carefully tuned nonlinear registration following it by projection onto an alignment‐invariant tract template (mean FA skeleton template). The registration step, a key part of the TBSS algorithm, is designed to align each individual's FA image to a common standard space. To date, the mean FA skeleton template can be generated by those following 4 kinds of algorithms, including standard FA template, most‐representative‐subject FA template, study‐specific FA template, groupwise atlas FA template 51, 52, 53, 54, 55, 56, 57, 58. Many studies have now applied TBSS to identify white matter diffusion alterations in MCI, AD as well as in normal elderly who progressed to MCI and MCI who progressed to AD with consistent results (Table 2) 53, 59, 60.
Table 2.
Anatomic locations reported to show reduced FA and increased MD in patients with AD pathology
| Comparison | Method(reference) | Memory circuit | Other domains | ||||
|---|---|---|---|---|---|---|---|
| HP | paraHP | PC | PCC | fornix | |||
| MCI vs. NC |
ST‐TBSS53, 60
SS‐TBSS57 VBA‐SPM879 |
MD+ FA+/− |
MD+ FA+ |
MD+ FA+ |
MD+ FA+ |
MD+ FA+ |
FA reduction: uncinate fasciculus, brain stem, cerebellum53, 60
MD increases: occipitofrontal fasciculi, superior longitudinal fasciculus, callosal body, uncinate fasciculus53, 57, 79 |
| AD vs. NC |
ST‐TBSS51, 52, 53, 54, 60
RS‐TBSS55, 56 SS‐TBSS57 GW‐TBSS58 VBA‐SPM511 |
MD++ FA+/− |
MD++ FA++ |
MD++ FA++ |
MD++ FA++ |
MD++ FA++ |
FA reduction: uncinate, brain stem, cerebellum, inferior/superior longitudinal fasciculus, corpus callosum 51, 53, 54, 56, 57, 58, 60, anterior commissure, corona radiata, internal capsule, thalamus, corticopontine tracts, cerebral peduncle, striatum, precentral gyrus11, lateral occipital, middle/inferior temporal WM, inferior parietal, supramarginal 52, ponto‐medullary junction55
MD increase: caudal temporal and parietal regions55, corpus callosum, anterior commissure, external capsule, temporal stem, uncinate fasciculus, superior longitudinal fasciculus57 |
| NC/MCI vs. NC stable |
ST‐TBSS65
ROI80 |
MD+ | FA+ | FA+ | FA+ | FA+ |
FA reduction: right precuneus left dorsal middle cingulum, right retrolenticular part of the internal capsule, and WM in frontal, parietal, and temporal lobes65
MD increase: right hippocampus80 |
| MCI/AD vs. MCI stable |
RS‐TBSS81
SS‐TBSS82 ROI8, 9 |
MD++ | NA | NA | FA++ | FA++ |
FA reduction: corpus callosum54, 81, Mode of anisotropy (MO) reduction: left hippocampal(left fimbria), fornix82 MO increase: superior longitudinal fasciculus, corticospinal tract cross82 MD increases: left hippocampal9, 82, baseline hippocampal8, left amygdala82 |
No change: “−”; mild change: “+”; moderate change: “++”.
Other domain in cognitive included language, attention/executive function, and visual–spatial processing domains.
NC, normal cognitive; MCI, mild cognitive impairment; AD, Alzheimer's disease; NC/MCI, normal cognitive subject who progressed to MCI; MCI/AD, patients with MCI who progressed to AD; HP, hippocampus; pare HP, parahippocampal grus and tract; PC, precuneus; PCC, posterior cingulum cortex; NA, not available; ST‐TBSS, standard; RS‐TBSS, most‐representative‐subject TBSS; SS‐TBSS, study‐specific‐template; FA, fractional anisotropy; MD, mean diffusivity; ROI, region‐of‐interest; VBA, voxel‐based analytic; TBSS, tract‐based spatial statistics.
Evidence on DTI as a Biomarker for Neurodegeneration in Prodromal AD
Microstructure and Hippocampus in Prodromal AD
Hippocampus is one of the first brain regions to be affected by AD pathology, and microstructural alterations within hippocampus have been quantified in vivo using DTI. Mean diffusivity, as a marker of microstructure, appears to be a more sensitive marker of hippocampal integrity than macrostructural measurements with MR volumetry. In a meta‐analysis comparing controls and patients with MCI, the effect size of hippocampal MD was larger than the effect size of hippocampal volume 61. Furthermore, MD increase in the anterior hippocampus predicted the severity of episodic memory impairment in patients with early AD better than hippocampal volumetric indices 62, 63. Higher baseline diffusivity in the hippocampal head was associated with a greater risk of progression to AD in MCI, which may help in identifying patients with MCI who will progress to AD as well as or better than hippocampal atrophy alone 8.
The symmetric alterations in hippocampal diffusivity has not been consistent across studies with some reporting bilateral MD increases, others reporting asymmetric findings with greater increases in the left hippocampus 64. For example, left hippocampal MD was higher at baseline in patients with MCI who progressed to AD compared with patients with MCI who remained stable 62. In contrast, FA is not as accurate for quantifying microstructural integrity of hippocampus in AD. Regression analyses using FA values revealed similar but less pronounced alterations compared with hippocampal MD 62. Group differences in both MD and FA were observed even after controlling for volumetric differences in medial temporal and retrosplenial regions, indicative of microstructural damage beyond that explained by volume loss in moderate to severe AD 11. Therefore, low FA and high MD values may be sensitive to early changes in brain microstructure that potentially precede macrostructural changes measured with volumetric MRI.
Microstructure and Memory Circuit in Prodromal AD
Memory impairment associated with hippocampal degeneration is the earliest symptom in patients with MCI who progress to AD. Multiple regression analyses revealed left hippocampal MD increase to be the strongest predictor of verbal episodic memory performance, explaining 25% of the delayed verbal recall test variance in patients with MCI 62. However, atrophy and MD increases were found not only in the hippocampus, but also in the fornix and the cingulum white matter tract connecting hippocampi with precuneus/posterior cingulate cortex which may be explained by degeneration in cingulum and fornix tracts, secondary to hippocampal damage 10.
Another study investigated whether microstructural white matter changes can be detected in cognitively normal individuals who progressed to amnestic mild cognitive impairment (aMCI). This study indicated reductions in white matter integrity in the memory circuit (the precuneus, parahippocampal cingulum, parahippocampal gyrus, and fornix) in cognitively normal individuals who progressed to aMCI 65. Because fibers from the hippocampus project via the fornix to the mamillary bodies, and via cingulum to the paralimbic cortex, the FA decreases in the fornix and cingulum likely correspond to the loss of neurons in the hippocampus along with the projecting tracts. For example, the local thickness of subiculum and CA1 hippocampus fields were associated with fornix integrity, indicating AD related to hippocampal neuronal injury and degeneration of projecting axons 66.
Decreased FA values appear to involve white matter fibers that connect to medial temporal areas during the prodromal stage of AD. The FA values of the precuneus and left parahippocampal gyrus white matter were found to be a predictor of progression from cognitively normal to aMCI and subsequent episodic memory decline 65. Similarly, diffusivity characteristics related to memory function was associated with the medial temporal lobe cortical MD and inferior longitudinal fasciculus and posterior and anterior cingulum FA in elderly with no dementia 17. Among major white matter tracts, only FA of the posterior cingulum tract was associated with all cognitive domain functions that were investigated (memory, language, attention/executive function, and visual–spatial processing domains), consistent with the hypothesis that the posterior cingulate cortex is the main connectivity hub for cognitive brain networks 17 (Figure 2). The cingulum fibers have been involved in various tasks of memory such as encoding (in the hippocampus), retrieval, and recognition (in the posterior cingulate, the retrosplenial cortex, posterior and medial parietal cortex). If the integrity of neuroanatomic connectivity between brain regions of memory circuit is an important determinant of neuronal network activity, damage to neuronal connections within this circuit should have a significant impact on the effective connectivity within the network. Thus, microstructural white matter changes centered around hippocampus, cingulum, and fornix axis as a circuit for memory function may serve as a potential imaging marker of early AD‐related brain changes, possibly in the preclinical stage.
Figure 2.
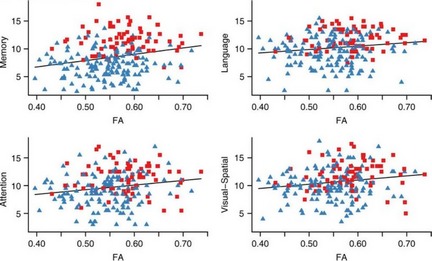
Scatter plots showing the relationship between Mayo Older American Normative Studies (MOANS) scores in cognitive domain and fractional anisotropy (FA) values for posterior cingulum tract. Red squares indicate cognitively normal subjects, while blue triangles represent subjects with mild cognitive impairment. FA in posterior cingulum decreased with the decreasing of clinical rating scores (MOANS) related with all 4 cognitive domain functions (memory, language, attention/executive function, and visual–spatial processing domains), in agreement with the hypothesis that the posterior cingulate cortex is the main connectivity hub for cognitive brain networks. (Reprinted, with permission from Neurology 17).
Microstructure and Neuronal Circuit Remodeling in Prodromal AD
Disruption of entorhinal–hippocampal and hippocampal–cingulum pathways is associated with early decline in memory function, which recovers after deep brain stimulation in prodromal AD 10, 67, 68. Such neuronal circuit remodeling or neuroplasticity can be defined as an experience‐dependent structural or functional change in neurons, as well changes in the shape and number of cellular structures in response to a continuous demand for a specific activity. The biomarkers of neuroplasticity in the adult brain include long‐term potentiation, neurogenesis, and structural remodeling of various cellular components 69, 70, 71, 72. There are at least two motivations for the application of DTI in axonal reorganization after treatment or rehabilitation: (1) the sensitivity of FA and MD to myelin and axonal density indicate DTI's potential utility to detect axonal reorganization 73, 74; (2) FA and MD measurements provide a sensitive longitudinal surrogate for white matter and gray matter changes in the developing and adult brain 75, 76, 77. Increases in FA and decreases in MD were found in the selective neuroplasticity induced by memory tasks in adults, and this process is age‐dependent in the cingulate cortex, corpus callosum, and dentate gyrus 74. Neuroplasticity during learning can improve memory function and related microstructure changes in the inferior and superior longitudinal fasciculus, the posterior part of the cingulum bundle, and the corpus callosum 78. Therefore, serial DTI may be useful for a more detailed understanding of neuroplasticity processes associated with microstructural changes in AD 46, 74.
Conclusion
Structural connectivity assessed with DTI plays an important role in cognitive performance, and the breakdown of connectivity is an important component of early AD pathophysiology. There is increasing evidence that the differential assessment of hippocampus and tracts connecting to the medial temporal lobe are sensitive to early AD‐related pathology, and their integrity is associated with cognitive decline in normal aging and risk of developing AD. DTI‐based indices of diffusivity as a biomarker of microstructural integrity are independent and complementary to conventional volumetric measurements of the hippocampus as a predictor of AD. To serve as a reliable and accurate surrogate of prodromal AD, diffusion parameter maps should be quality controlled before processed and analyzed with ROI, VBA, or TBSS methods. Furthermore, longitudinal DTI studies on structural connectivity of hippocampus via the fornix and cingulum tracts are required for determining whether microstructural changes are related to declining episodic memory performance in during progression of MCI and preclinical AD. Finally, longitudinal assessments of the hippocampal structural connectivity networks may help us understand the cerebral organization and remodeling after potential treatments.
Conflict of Interest
The authors have no conflict of interest.
Acknowledgments
None.
References
- 1. Petersen RC, Roberts RO, Knopman DS, et al. Mild cognitive impairment: Ten years later. Arch Neurol 2009;66:1447–1455. [DOI] [PMC free article] [PubMed] [Google Scholar]
- 2. Petersen RC, Doody R, Kurz A, et al. Current concepts in mild cognitive impairment. Arch Neurol 2001;58:1985–1992. [DOI] [PubMed] [Google Scholar]
- 3. Petersen RC, Smith GE, Waring SC, Ivnik RJ, Tangalos EG, Kokmen E. Mild cognitive impairment: Clinical char‐acterization and outcome. Arch Neurol 1999;56:303–308. [DOI] [PubMed] [Google Scholar]
- 4. Reisberg B, Ferris SH, de Leon M. Stage‐specific behavioral, cognitive, and in vivo changes in community residing subjects with age‐associated memory impairment and primary degenerative dementia of the Alzheimer type. Drug Dev Res 1988;15:101–114. [Google Scholar]
- 5. Jack CR, Lowe VJ, Weigand SD, et al. Serial PIB and MRI in normal, mild cognitive impairment and Alzheimer's disease: Implications for sequence of pathological events in Alzheimer's disease. Brain 2009;132:1355–1365. [DOI] [PMC free article] [PubMed] [Google Scholar]
- 6. Jack CR. Alzheimer disease: New concepts on its neurobiology and the clinical role imaging will play. Radiology 2012;263:344–361. [DOI] [PMC free article] [PubMed] [Google Scholar]
- 7. Oishi K, Mielke MM, Albert M, Lyketsos CG, Mori S. The fornix sign: A potential sign for Alzheimer's disease based on diffusion tensor imaging. J Neuroimaging 2012;22:365–374. [DOI] [PMC free article] [PubMed] [Google Scholar]
- 8. Kantarci K, Petersen RC, Boeve BF, et al. DWI predicts future progression to Alzheimer disease in amnestic mild cognitive impairment. Neurology 2005;64:902–904. [DOI] [PMC free article] [PubMed] [Google Scholar]
- 9. Fellgiebel A, Dellani PR, Greverus D, Scheurich A, Stoeter P, Muller MJ. Predicting conversion to dementia in mild cognitive impairment by volumetric and diffusivity measurements of the hippocampus. Psychiatry Res 2006;146:283–287. [DOI] [PubMed] [Google Scholar]
- 10. Palesi F, Vitali P, Chiarati P, et al. DTI and MR volumetry of hippocampus‐PC/PCC circuit: In search of early micro‐ and macrostructural signs of Alzheimers's disease. Neurol Res Int 2012;2012:517876. [DOI] [PMC free article] [PubMed] [Google Scholar]
- 11. Canu E, McLaren DG, Fitzgerald ME, et al. Microstructural diffusion changes are independent of macrostructural volume loss in moderate to severe Alzheimer's disease. J Alzheimers Dis 2010;19:963–976. [DOI] [PMC free article] [PubMed] [Google Scholar]
- 12. Kantarci K, Avula R, Senjem ML, et al. Dementia with Lewy bodies and Alzheimer disease: Neurodegenerative patterns characterized by DTI. Neurology 2010;74:1814–1821. [DOI] [PMC free article] [PubMed] [Google Scholar]
- 13. Zerbi V, Kleinnijenhuis M, Fang X, et al. Gray and white matter degeneration revealed by diffusion in an Alzheimer mouse model. Neurobiol Aging 2013;34:1440–1450. [DOI] [PubMed] [Google Scholar]
- 14. Amlien IK, Fjell AM, Walhovd KB, et al. Mild cognitive impairment: Cerebrospinal fluid tau biomarker pathologic levels and longitudinal changes in white matter integrity. Radiology 2013;266:295–303. [DOI] [PubMed] [Google Scholar]
- 15. Pierpaoli C, Basser PJ. Toward a quantitative assessment of diffusion anisotropy. Magn Reson Med 1996;36:893–906. [DOI] [PubMed] [Google Scholar]
- 16. Walhovd KB, Fjell AM, Amlien I, et al. Multimodal imaging in mild cognitive impairment: Metabolism, morphometry and diffusion of the temporal‐parietal memory network. Neuroimage 2009;45:215–223. [DOI] [PubMed] [Google Scholar]
- 17. Kantarci K, Senjem ML, Avula R, et al. Diffusion tensor imaging and cognitive function in older adults with no dementia. Neurology 2011;77:26–34. [DOI] [PMC free article] [PubMed] [Google Scholar]
- 18. Rogalski E, Stebbins GT, Barnes CA, et al. Age‐related changes in parahippocampal white matter integrity: A diffusion tensor imaging study. Neuropsychologia 2012;50:1759–1765. [DOI] [PMC free article] [PubMed] [Google Scholar]
- 19. Shah SO, Mehta H, Fekete R. Late‐onset neurodegeneration with brain iron accumulation with diffusion tensor magnetic resonance imaging. Case Rep Neurol 2012;4:216–223. [DOI] [PMC free article] [PubMed] [Google Scholar]
- 20. Zhang B, Li M, Sun ZZ, et al. Evaluation of functional MRI markers in mild cognitive impairment. J Clin Neurosci 2009;16:635–641. [DOI] [PubMed] [Google Scholar]
- 21. Kantarci K, Shin C, Britton JW, So EL, Cascino GD, Jack CR Jr. Comparative diagnostic utility of 1H MRS and DWI in evaluation of temporal lobe epilepsy. Neurology 2002;58:1745–1753. [DOI] [PubMed] [Google Scholar]
- 22. Grossman M. Biomarkers in frontotemporal lobar degeneration. Curr Opin Neurol 2010;23:643–648. [DOI] [PMC free article] [PubMed] [Google Scholar]
- 23. Basser PJ, Jones DK. Diffusion‐tensor MRI: Theory, experimental design and data analysis ‐ a technical review. NMR Biomed 2002;15:456–467. [DOI] [PubMed] [Google Scholar]
- 24. Anderson AW, Gore JC. Analysis and correction of motion artifacts in diffusion weighted imaging. Magn Reson Med 1994;32:379–387. [DOI] [PubMed] [Google Scholar]
- 25. Skare S, Andersson JL. On the effects of gating in diffusion imaging of the brain using single shot EPI. Magn Reson Imaging 2001;19:1125–1128. [DOI] [PubMed] [Google Scholar]
- 26. Bammer R, Keeling SL, Augustin M, et al. Improved diffusion‐weighted single‐shot echo‐planar imaging (EPI) in stroke using sensitivity encoding (SENSE). Magn Reson Med 2001;46:548–554. [DOI] [PubMed] [Google Scholar]
- 27. Skare S, Newbould RD, Clayton DB, Albers GW, Nagle S, Bammer R. Clinical multishot DW‐EPI through parallel imaging with considerations of susceptibility, motion, and noise. Magn Reson Med 2007;57:881–890. [DOI] [PMC free article] [PubMed] [Google Scholar]
- 28. Morgan B, Madden PA. Ion mobilities and microscopic dynamics in liquid (Li, K)Cl. J Chem Phys 2004;120:1402–1413. [DOI] [PubMed] [Google Scholar]
- 29. Ruthotto L, Kugel H, Olesch J, et al. Diffeomorphic susceptibility artifact correction of diffusion‐weighted magnetic resonance images. Phys Med Biol 2012;57:5715–5731. [DOI] [PubMed] [Google Scholar]
- 30. Bastin ME. Correction of eddy current‐induced artefacts in diffusion tensor imaging using iterative cross‐correlation. Magn Reson Imaging 1999;17:1011–1024. [DOI] [PubMed] [Google Scholar]
- 31. Liu W, Liu X, Yang G, et al. Improving the correction of eddy current‐induced distortion in diffusion‐weighted images by excluding signals from the cerebral spinal fluid. Comput Med Imaging Graph 2012;36:542–551. [DOI] [PMC free article] [PubMed] [Google Scholar]
- 32. Mohammadi S, Hutton C, Nagy Z, Josephs O, Weiskopf N. Retrospective correction of physiological noise in DTI using an extended tensor model and peripheral measurements. Magn Reson Med 2012;70:358–369. [DOI] [PMC free article] [PubMed] [Google Scholar]
- 33. Xu D, Maier JK, King KF, et al. Prospective and retrospective high order eddy current mitigation for diffusion weighted echo planar imaging. Magn Reson Med 2013;doi: 10.1002/mrm.24589. [DOI] [PubMed] [Google Scholar]
- 34. Tournier JD, Mori S, Leemans A. Diffusion tensor imaging and beyond. Magn Reson Med 2011;65:1532–1556. [DOI] [PMC free article] [PubMed] [Google Scholar]
- 35. Frank LR. Anisotropy in high angular resolution diffusion‐weighted MRI. Magn Reson Med 2001;45:935–939. [DOI] [PubMed] [Google Scholar]
- 36. Leemans A, Jones DK. The B‐matrix must be rotated when correcting for subject motion in DTI data. Magn Reson Med 2009;61:1336–1349. [DOI] [PubMed] [Google Scholar]
- 37. Andersson JL, Skare S. A model‐based method for retrospective correction of geometric distortions in diffusion‐weighted EPI. Neuroimage 2002;16:177–199. [DOI] [PubMed] [Google Scholar]
- 38. Zhou Z, Liu W, Cui J, et al. Automated artifact detection and removal for improved tensor estimation in motion‐corrupted DTI data sets using the combination of local binary patterns and 2D partial least squares. Magn Reson Imaging 2011;29:230–242. [DOI] [PubMed] [Google Scholar]
- 39. Koay CG, Chang LC, Carew JD, Pierpaoli C, Basser PJ. A unifying theoretical and algorithmic framework for least squares methods of estimation in diffusion tensor imaging. J Magn Reson 2006;182:115–125. [DOI] [PubMed] [Google Scholar]
- 40. Mohammadi S, Nagy Z, Moller HE, et al. The effect of local perturbation fields on human DTI: Characterisation, measurement and correction. Neuroimage 2012;60:562–570. [DOI] [PMC free article] [PubMed] [Google Scholar]
- 41. Smith SM, Jenkinson M, Johansen‐Berg H, et al. Tract‐based spatial statistics: Voxelwise analysis of multi‐subject diffusion data. Neuroimage 2006;31:1487–1505. [DOI] [PubMed] [Google Scholar]
- 42. Kantarci K, Jack CR Jr, Xu YC, et al. Mild cognitive impairment and Alzheimer disease: Regional diffusivity of water. Radiology 2001;219:101–107. [DOI] [PMC free article] [PubMed] [Google Scholar]
- 43. Kiuchi K, Morikawa M, Taoka T, et al. Abnormalities of the uncinate fasciculus and posterior cingulate fasciculus in mild cognitive impairment and early Alzheimer's disease: A diffusion tensor tractography study. Brain Res 2009;1287:184–191. [DOI] [PubMed] [Google Scholar]
- 44. Nakata Y, Sato N, Nemoto K, et al. Diffusion abnormality in the posterior cingulum and hippocampal volume: Correlation with disease progression in Alzheimer's disease. Magn Reson Imaging 2009;27:347–354. [DOI] [PubMed] [Google Scholar]
- 45. Ashburner J, Friston KJ. Voxel‐based morphometry–the methods. Neuroimage 2000;11:805–821. [DOI] [PubMed] [Google Scholar]
- 46. Voss HU, Schiff ND. MRI of neuronal network structure, function, and plasticity. Prog Brain Res 2009;175:483–496. [DOI] [PubMed] [Google Scholar]
- 47. Ardekani S, Kumar A, Bartzokis G, Sinha U. Exploratory voxel‐based analysis of diffusion indices and hemispheric asymmetry in normal aging. Magn Reson Imaging 2007;25:154–167. [DOI] [PubMed] [Google Scholar]
- 48. Chen L, Lui S, Wu QZ, et al. Impact of acute stress on human brain microstructure: An MR diffusion study of earthquake survivors. Hum Brain Mapp 2013;34:367–373. [DOI] [PMC free article] [PubMed] [Google Scholar]
- 49. Smith SM, Jenkinson M, Woolrich MW, et al. Advances in functional and structural MR image analysis and implementation as FSL. Neuroimage 2004;23:S208–S219. [DOI] [PubMed] [Google Scholar]
- 50. Smith SM, Nichols TE. Threshold‐free cluster enhancement: Addressing problems of smoothing, threshold dependence and localisation in cluster inference. Neuroimage 2009;44:83–98. [DOI] [PubMed] [Google Scholar]
- 51. Serra L, Cercignani M, Lenzi D, et al. Grey and white matter changes at different stages of Alzheimer's disease. J Alzheimers Dis 2010;19:147–159. [DOI] [PubMed] [Google Scholar]
- 52. Salat DH, Tuch DS, van der Kouwe AJ, et al. White matter pathology isolates the hippocampal formation in Alzheimer's disease. Neurobiol Aging 2010;31:244–256. [DOI] [PMC free article] [PubMed] [Google Scholar]
- 53. Bosch B, Arenaza‐Urquijo EM, Rami L, et al. Multiple DTI index analysis in normal aging, amnestic MCI and AD. Relationship with neuropsychological performance. Neurobiol Aging 2012;33:61–74. [DOI] [PubMed] [Google Scholar]
- 54. Arenaza‐Urquijo EM, Bosch B, Sala‐Llonch R, et al. Specific anatomic associations between white matter integrity and cognitive reserve in normal and cognitively impaired elders. Am J Geriatr Psychiatry 2011;19:33–42. [DOI] [PubMed] [Google Scholar]
- 55. Acosta‐Cabronero J, Williams GB, Pengas G, Nestor PJ. Absolute diffusivities define the landscape of white matter degeneration in Alzheimer's disease. Brain 2010;133:529–539. [DOI] [PubMed] [Google Scholar]
- 56. Agosta F, Canu E, Sarro L, Comi G, Filippi M. Neuroimaging findings in frontotemporal lobar degeneration spectrum of disorders. Cortex 2012;48:389–413. [DOI] [PubMed] [Google Scholar]
- 57. Douaud G, Jbabdi S, Behrens TE, et al. DTI measures in crossing‐fibre areas: Increased diffusion anisotropy reveals early white matter alteration in MCI and mild Alzheimer's disease. Neuroimage 2011;55:880–890. [DOI] [PMC free article] [PubMed] [Google Scholar]
- 58. Keihaninejad S, Ryan NS, Malone IB, et al. The importance of group‐wise registration in tract based spatial statistics study of neurodegeneration: A simulation study in Alzheimer's disease. PLoS One 2012;7:e45996. [DOI] [PMC free article] [PubMed] [Google Scholar]
- 59. Agosta F, Pievani M, Sala S, et al. White matter damage in Alzheimer disease and its relationship to gray matter atrophy. Radiology 2011;258:853–863. [DOI] [PubMed] [Google Scholar]
- 60. Liu Y, Spulber G, Lehtimaki KK, et al. Diffusion tensor imaging and tract‐based spatial statistics in Alzheimer's disease and mild cognitive impairment. Neurobiol Aging 2011;32:1558–1571. [DOI] [PubMed] [Google Scholar]
- 61. Clerx L, Visser PJ, Verhey F, Aalten P. New MRI markers for Alzheimer's disease: A meta‐analysis of diffusion tensor imaging and a comparison with medial temporal lobe measurements. J Alzheimers Dis 2012;29:405–429. [DOI] [PubMed] [Google Scholar]
- 62. Fellgiebel A, Yakushev I. Diffusion tensor imaging of the hippocampus in MCI and early Alzheimer's disease. J Alzheimers Dis 2011;26:257–262. [DOI] [PubMed] [Google Scholar]
- 63. Muller MJ, Greverus D, Dellani PR, et al. Functional implications of hippocampal volume and diffusivity in mild cognitive impairment. Neuroimage 2005;28:1033–1042. [DOI] [PubMed] [Google Scholar]
- 64. Zhang B, Zhang JG, Zhao H, et al. Evaluation of apparent diffusion coefficient mappings in amnestic mild cognitive impairment using an image analysis software brain search. Acta Radiol 2011;52:1147–1154. [DOI] [PubMed] [Google Scholar]
- 65. Zhuang L, Sachdev PS, Trollor JN, et al. Microstructural white matter changes in cognitively normal individuals at risk of amnestic MCI. Neurology 2012;79:748–754. [DOI] [PubMed] [Google Scholar]
- 66. Lee DY, Fletcher E, Carmichael OT, et al. Sub‐Regional hippocampal injury is associated with fornix degeneration in Alzheimer's disease. Front Aging Neurosci 2012;25:154–167. [DOI] [PMC free article] [PubMed] [Google Scholar]
- 67. Laxton AW, Tang‐Wai DF, McAndrews MP, et al. A phase I trial of deep brain stimulation of memory circuits in Alzheimer's disease. Ann Neurol 2010;68:521–534. [DOI] [PubMed] [Google Scholar]
- 68. Mizuseki K, Sirota A, Pastalkova E, Buzsaki G. Theta oscillations provide temporal windows for local circuit computation in the entorhinal‐hippocampal loop. Neuron 2009;64:267–280. [DOI] [PMC free article] [PubMed] [Google Scholar]
- 69. Rajji TK, Rogasch NC, Daskalakis ZJ, Fitzgerald PB. Neuroplasticity‐based brain stimulation interventions in the study and treatment of schizophrenia: A review. Can J Psychiatry 2013;58:93–98. [DOI] [PubMed] [Google Scholar]
- 70. Mahar I, Bagot RC, Davoli MA, et al. Developmental hippocampal neuroplasticity in a model of nicotine replacement therapy during pregnancy and breastfeeding. PLoS One 2012;7:e37219. [DOI] [PMC free article] [PubMed] [Google Scholar]
- 71. Pascual‐Brazo J, Castro E, Diaz A, et al. Modulation of neuroplasticity pathways and antidepressant‐like behavioural responses following the short‐term (3 and 7 days) administration of the 5‐HT(4) receptor agonist RS67333. Int J Neuropsychopharmacol 2012;15:631–643. [DOI] [PubMed] [Google Scholar]
- 72. Wenger E, Schaefer S, Noack H, et al. Cortical thickness changes following spatial navigation training in adulthood and aging. Neuroimage 2012;59:3389–3397. [DOI] [PubMed] [Google Scholar]
- 73. Dancause N, Barbay S, Frost SB, et al. Extensive cortical rewiring after brain injury. J Neurosci 2005;25:10167–10179. [DOI] [PMC free article] [PubMed] [Google Scholar]
- 74. Blumenfeld‐Katzir T, Pasternak O, Dagan M, Assaf Y. Diffusion MRI of structural brain plasticity induced by a learning and memory task. PLoS One 2011;6:e20678. [DOI] [PMC free article] [PubMed] [Google Scholar]
- 75. van Meer MP, Otte WM, van der Marel K, et al. Extent of bilateral neuronal network reorganization and functional recovery in relation to stroke severity. J Neurosci 2012;32:4495–4507. [DOI] [PMC free article] [PubMed] [Google Scholar]
- 76. Dijkhuizen RM, van der Marel K, Otte WM, et al. Functional MRI and diffusion tensor imaging of brain reorganization after experimental stroke. Transl Stroke Res 2012;3:36–43. [DOI] [PMC free article] [PubMed] [Google Scholar]
- 77. MacDonald CL, Dikranian K, Bayly P, Holtzman D, Brody D. Diffusion tensor imaging reliably detects experimental traumatic axonal injury and indicates approximate time of injury. J Neurosci 2007;27:11869–11876. [DOI] [PMC free article] [PubMed] [Google Scholar]
- 78. Koch K, Wagner G, Dahnke R, et al. Structure‐function relationships in the context of reinforcement‐related learning: A combined diffusion tensor imaging‐functional magnetic resonance imaging study. Neuroscience 2010;168:190–199. [DOI] [PubMed] [Google Scholar]
- 79. Palesi F, Vitali P, Chiarati P, et al. DTI and MR volumetry of hippocampus‐PC/PCC circuit: In search of early micro‐ and macrostructural signs of Alzheimers's disease. Neurol Res Int 2012;2012:517876. [DOI] [PMC free article] [PubMed] [Google Scholar]
- 80. Fayed N, Davila J, Oliveros A, Castillo J, Medrano JJ. Utility of different MR modalities in mild cognitive impairment and its use as a predictor of conversion to probable dementia. Acad Radiol 2008;15:1089–1098. [DOI] [PubMed] [Google Scholar]
- 81. van Bruggen T, Stieltjes B, Thomann PA, Parzer P, Meinzer HP, Fritzsche KH. Do Alzheimer‐specific microstructural changes in mild cognitive impairment predict conversion? Psychiatry Res 2012;203:184–193. [DOI] [PubMed] [Google Scholar]
- 82. Douaud G, Menke RA, Gass A, et al. Brain microstructure reveals early abnormalities more than two years prior to clinical progression from mild cognitive impairment to Alzheimer's disease. J Neurosci 2013;33:2147–2155. [DOI] [PMC free article] [PubMed] [Google Scholar]