Abstract
In a rodent model of Parkinson’s disease (PD), levodopa-induced involuntary movements have been linked to striatal angiogenesis — a process that is difficult to document in living human subjects. Angiogenesis can be accompanied by localized increases in cerebral blood flow (CBF) responses to hypercapnia. We therefore explored the possibility that, in the absence of levodopa, local hypercapnic CBF responses are abnormally increased in PD patients with levodopa-induced dyskinesias (LID) but not in their nondyskinetic (NLID) counterparts. We used H215O PET to scan 24 unmedicated PD subjects (12 LID and 12 NLID) and 12 matched healthy subjects in the rest state under normocapnic and hypercapnic conditions. Hypercapnic CBF responses were compared to corresponding levodopa responses from the same subjects. Group differences in hypercapnic vasoreactivity were significant only in the posterior putamen, with greater CBF responses in LID subjects compared with the other subjects. Hypercapnic and levodopa-mediated CBF responses measured in this region exhibited distinct associations with disease severity: the former correlated with off-state motor disability ratings but not symptom duration, whereas the latter correlated with symptom duration but not motor disability. These are the first in vivo human findings linking LID to microvascular changes in the basal ganglia.
Keywords: Neuroscience
Keywords: Neuroimaging, Parkinson’s disease
Increased basal ganglia hypercapnic vasoreactivity, indicating localized vascular proliferation, was seen in Parkinson’s patients with levodopa-induced involuntary movements but not in their unaffected counterparts.
Introduction
Levodopa treatment for Parkinson’s disease (PD) is complicated by potentially disruptive involuntary movements following drug administration. These movements, termed levodopa-induced dyskinesia (LID), are seen in approximately 50% of PD patients who received the drug for 5 years and in nearly all patients after 10 years of treatment (1). While the mechanism of LID is not precisely known, experimental evidence from the 6-hydroxydopamine (6-OHDA) rat model has implicated neurovascular dysregulation in dopaminergically denervated brain regions as a major factor underlying the development of levodopa-mediated involuntary movements (2). Evidence for this hypothesis has been provided by recent dual-tracer PET studies conducted in human PD subjects (3, 4) and in the rodent model (5, 6). In brief, levodopa administration is associated with increases in local cerebral blood flow (CBF) and with simultaneous reductions in cerebral glucose metabolic rate (CMR) in the same brain regions. Dissociation of local vasomotor and metabolic drug responses (referred to as “regional dissociation”) has been observed as a stereotyped feature of levodopa treatment in PD subjects, involving areas of monoaminergic terminal loss in the posterior putamen, globus pallidus, ventral thalamus, and dorsal pons (3, 4). Levodopa-mediated CBF increases in these regions have been attributed to drug effects on the local microvasculature, mediated by dopamine terminals apposed to the vessel wall (see, e.g., refs. 7–9). By contrast, levodopa-mediated CMR reductions in these regions likely relate to changes in local synaptic activity induced concurrently by the drug (see, e.g., refs. 10, 11). In addition to human PD, levodopa-mediated dissociation has been observed in the 6-hydroxydopamine rat model (6). In both species, levodopa-mediated dissociation is most prominent in the basal ganglia, with notably greater effects in human subjects and experimental animals with drug-induced dyskinesia (4, 5).
The underlying cause for the observed neurovascular changes in LID is not known. Experimental findings from the dyskinetic 6-OHDA rat model suggest a relationship between enhanced vasomotor responses to levodopa in the striatum and underlying angiogenesis (12, 13). Although some evidence for angiogenesis in human PD has been provided by the analysis of postmortem tissue and cerebrospinal fluid (14–16), the specificity of the observed changes for LID remains uncertain. Indeed, the demonstration of localized angiogenesis in the living human brain represents a major challenge, given the lack of sensitive imaging methods to detect and quantify the process in small anatomical regions in the absence of tumor.
In this study, we used an indirect approach based upon a transgenic mouse model of inborn angiogenesis secondary to overexpression of VEGF (17). Vogel and colleagues found that increases in capillary density in angiogenic brain regions were associated with relatively normal resting CBF under routine normocapnic (NC) conditions. However, with the induction of vasodilation by hypercapnia (HC), significant increases in local CBF were observed in areas of vascular proliferation, without corresponding changes in local metabolic activity. In a similar vein, HC vasoreactivity has recently been used in human subjects as a means of assessing angiogenesis in brain tumors (18). We therefore used H215O PET to quantify HC CBF responses in PD subjects with and without LID who were scanned in the unmedicated (“off”) state. We predicted that, because of underlying angiogenesis, HC vasoreactivity measured in the previously determined basal ganglia dissociation region (4) would be greater in LID subjects than in their age- and sex-matched patient counterparts without this complication of levodopa treatment or in healthy subjects. Given that angiogenesis in levodopa-treated PD patients is likely to increase with advancing dopaminergic denervation (4, 16), we additionally predicted that the putamenal HC response would correlate with clinical indices of disease progression.
Results
Putamen HC responses are abnormally increased in LID subjects.
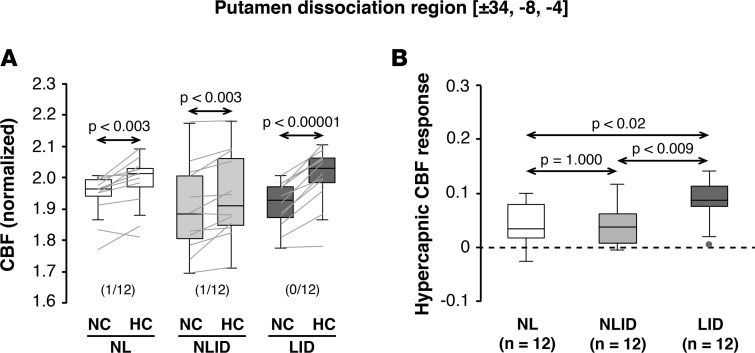
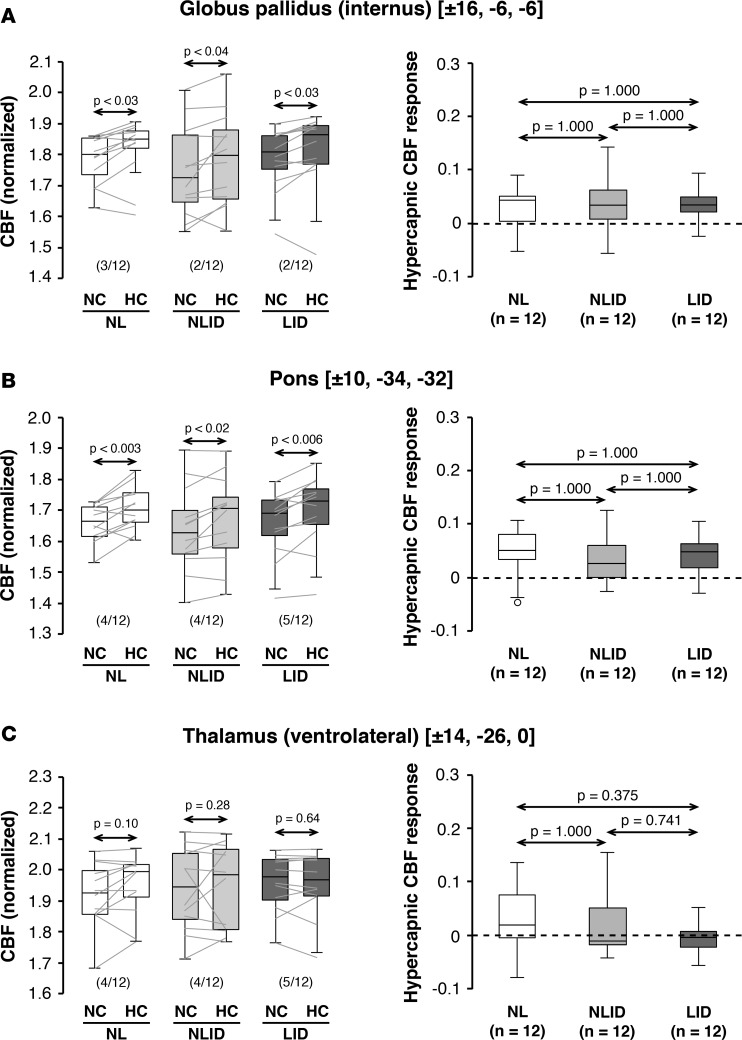
Globally normalized CBF increased with HC when measured off medication in the areas of levodopa-mediated dissociation that were previously reported in the putamen (Figure 1A), internal globus pallidus (Figure 2A), and pons (Figure 2B) (3, 4). In each of these regions, significant HC CBF responses were observed in LID, nondyskinetic (NLID), and healthy control subjects (P < 0.05; paired Student’s t tests). Analogous changes, however, were not seen in the ventrolateral thalamic dissociation region (Figure 2C) in any of the participant groups. Globally normalized CBF values measured in the NC, unmedicated baseline condition did not differ significantly across groups in any of the dissociation regions [F(2,33) < 0.58, P > 0.57; 1-way ANOVA]. Likewise, group differences in global CBF were not significant when assessed in the baseline condition [F(2,33) = 2.08, P = 0.1414].
Figure 1. Hypercapnic cerebral blood flow responses in the putamen levodopa dissociation region.
Globally normalized cerebral blood flow (CBF) values were measured in the unmedicated state under normocapnic (NC) and hypercapnic (HC) conditions in the area of dissociated vasomotor and metabolic levodopa responses previously described in the posterior putamen (see Results). (A) Significant CBF changes were seen in this region with consistent hypercapnic increases in the levodopa-induced dyskinesia (LID; n = 12), non-LID (NLID; n = 12), and normal control (NL; n = 12) groups. (CBF values measured in the NC and HC conditions are displayed for the subjects in each group using box-and-whisker plots. Horizontal arrows denote significance levels [P values] for each group according to the paired Student’s t test. The number of violations [subjects in whom HC was either equal to or lower than the corresponding NC value] are given in parentheses as the fraction of the total number of subjects in each group [see Results].) (B) Display of the hypercapnic CBF responses (ΔHC = CBFHC – CBFNC) for each group measured in the putamen levodopa dissociation region (see Results). Responses in this region were greater in LID subjects compared with NLID and NL subjects. (Horizontal arrows denote significance levels [P values] for group comparisons according to the post-hoc Bonferroni test of 1-way ANOVA [see Methods].)
Figure 2. Hypercapnic cerebral blood flow responses in other levodopa dissociation regions.
Globally normalized cerebral blood flow (CBF) values were measured in the other levodopa dissociation regions (LDDRs) reported previously in the (A) internal globus pallidus, (B) pons, and (C) ventrolateral thalamus of the levodopa-induced dyskinesia (LID; n = 12), non-LID (NLID; n = 12), and normal control (NL; n = 12) groups (see Results). Left: Significant CBF increases with hypercapnia were seen in the pallidal and pontine LDDRs but not in the ventrolateral thalamic dissociation region. Horizontal arrows denote significance levels (P values) for each group according to the paired Student’s t test. Right: In contrast to the putamen (Figure 1), significant group differences were not observed for hypercapnic CBF responses measured in the other dissociation regions. Horizontal arrows denote significance levels (P values) for group comparisons according to the post-hoc Bonferroni test of 1-way ANOVA. (Graphical displays as in Figure 1.)
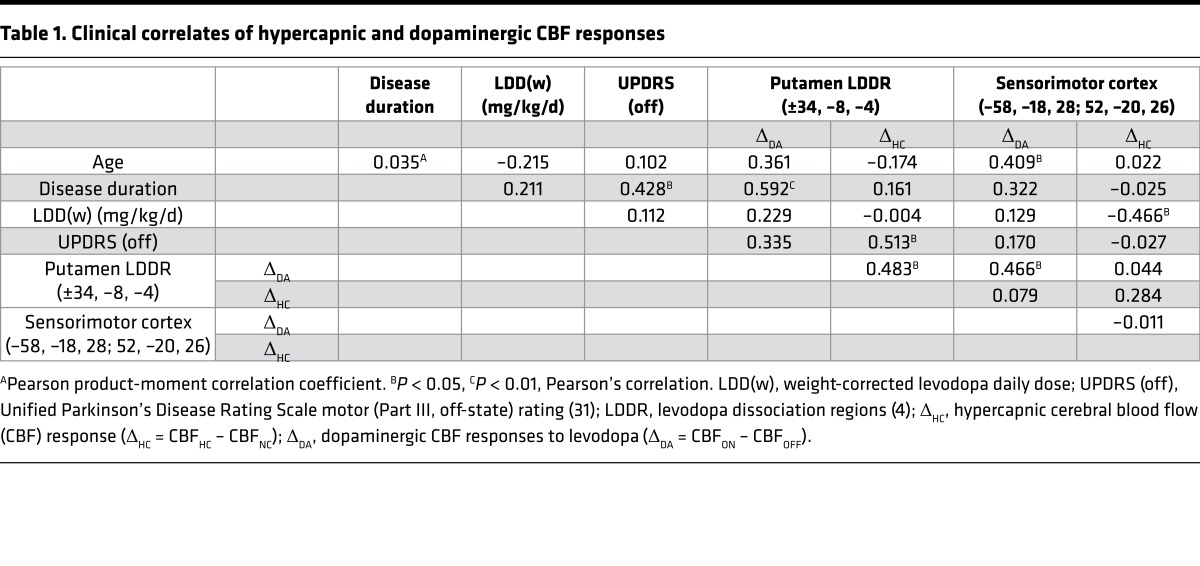
Of the levodopa dissociation regions (LDDRs), the putamen alone (Figure 1B) exhibited a significant group difference in HC vasoreactivity [F(2,33) = 6.64, P = 0.0038; 1-way ANOVA]. CBF responses in this region were greater in LID subjects compared with NLID subjects (P = 0.008) as well as healthy control subjects (P = 0.013; post-hoc Bonferroni tests). We further observed that in this region the expected HC CBF response (CBFHC > CBFNC) was not present in two (1 NLID and 1 control) of the 36 study participants. Nonetheless, excluding these “violators” did not alter the significance of the findings [F(2,31) = 5.76, P = 0.0074; 1-way ANOVA], with an increased HC response in LID subjects relative to both NLID (P = 0.014) and healthy subjects (P < 0.03). Local HC CBF responses measured in the other LDDRs (Figure 2, A–C, right) were likewise not significant (P > 0.27; 1-way ANOVAs). Of note, HC CBF responses recorded in the putamen dissociation region correlated with corresponding levodopa-mediated vasomotor changes measured in the same brain region (r = 0.483, P < 0.01; Pearson’s correlation). Analogous correlations were not present for the local changes measured in the other dissociation regions (P > 0.19).
HC responses in the putamen distinguish LID from NLID — voxel-wise analysis.
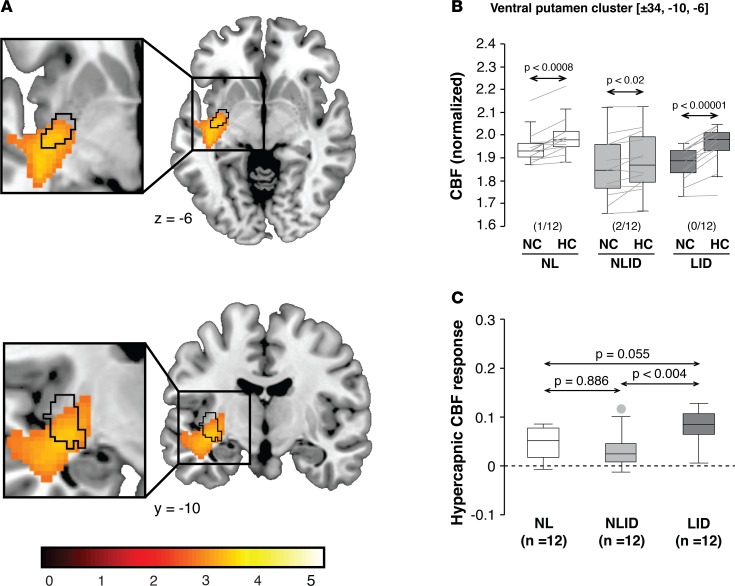
To confirm these findings, we additionally conducted a whole-brain analysis that was not restricted to the previously identified LDDRs. In this data-driven analysis, we interrogated the entire brain volume for clusters with significant group (LID/NLID) × condition (HC/NC) interaction effects on local CBF values (see Methods). The analysis revealed the presence of only two significant clusters — both situated in the posterior putamen. The first cluster (Figure 3A, orange-yellow) was centered ventrally at –34, –10, –6 in close proximity (Euclidean distance = 2.8 mm) to the previously identified putamen dissociation region (4) (Figure 3A, black contours). Local CBF in the ventral cluster (Figure 3B) increased significantly with HC in LID (P < 0.00001), NLID (P < 0.02), and healthy control subjects (P < 0.0008; paired Student’s t tests), with a minimal number of violations in each group. HC CBF responses recorded in this cluster (Figure 3C) differed significantly across groups [F(2,33) = 6.62, P = 0.0038; 1-way ANOVA], with greater CBF increases in LID subjects compared with NLID subjects (P < 0.004), but only marginal differences with regard to normal values (P = 0.055; post-hoc Bonferroni tests).
Figure 3. Voxel-based comparison of hypercapnic cerebral blood flow responses in Parkinson’s disease subjects with and without levodopa-induced dyskinesia.
(A) We conducted a confirmatory voxel-wise search over the whole brain to identify regions in which local hypercapnic cerebral blood flow (CBF) responses differed for levodopa-induced dyskinesia (LID) subjects (n = 12) compared with their non-LID (NLID) counterparts (n = 12) (see Results). The analysis revealed a significant cluster (yellow-orange) in the ventral posterior putamen that overlapped with the area of levodopa-mediated dissociation (black contours) that were previously identified in the same region (4). (Clusters were displayed using a red-yellow scale thresholded at T = 3.14 [P < 0.001, uncorrected, with cluster extent > 100 voxels], superimposed on a single-subject MRI template.) (B) Significant CBF increases in response to hypercapnia were observed in the ventral putamen, with a minimal number of violations (parentheses) in each of the groups. Horizontal arrows denote significance levels (P values) for each group according to the paired Student’s t test. (C) Hypercapnic responses in this region were greater in LID than in NLID subjects. The difference in the local hypercapnic response in LID relative to healthy control subjects (n = 12) was of only borderline significance. Horizontal arrows denote significance levels (P values) for group comparisons according to the post-hoc Bonferroni test of 1-way ANOVA. (Graphical displays as in Figures 1 and 2.)
The second cluster was centered dorsally at –34, –4, 2 and was spatially distinct from the putamen dissociation region (Euclidean distance = 7.2 mm). As in its ventral counterpart, the dorsal cluster exhibited significant HC CBF responses (data not shown) in each of the three groups (P < 0.001; paired Student’s t tests). Group differences in the local HC CBF response were significant in the dorsal putamen cluster [F(2,33) = 3.50, P = 0.0417; 1-way ANOVA]. The size of this effect was weaker dorsally than in its ventral counterpart, with only modestly increased HC responses in LID subjects compared with NLID subjects (P < 0.04; post-hoc Bonferroni test).
Vasomotor response to HC in the sensorimotor cortex.
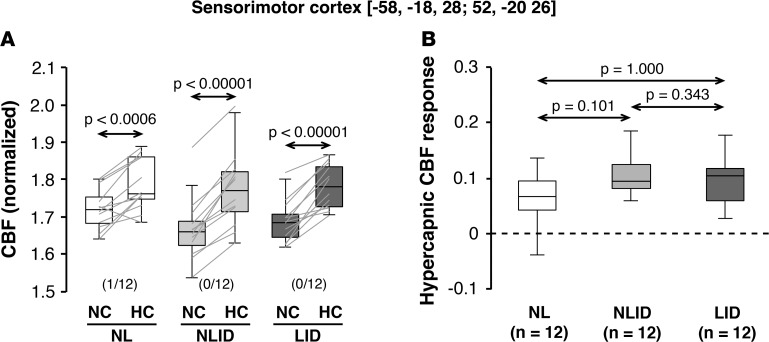
In a previous study (4), we additionally identified a discrete area within the sensorimotor cortex (SMC) in which baseline metabolic activity was significantly elevated in LID subjects compared with NLID subjects (see Methods). In addition to the significant vasomotor levodopa responses noted previously in this area, we now observed consistent CBF increases with HC (Figure 4A) in the same brain region (P < 0.001; paired Student’s t test). Nonetheless, in contrast to the putamen, HC CBF responses in the SMC (Figure 4B) exhibited only a marginal difference across groups [F(2,33) = 2.63, P = 0.087, 1-way ANOVA]. No significant correlation between local HC and levodopa-mediated CBF responses was observed in this SMC region (r = 0.22, P = 0.96; Pearson’s correlation).
Figure 4. Hypercapnic CBF responses in the sensorimotor cortex.
Globally normalized cerebral blood flow (CBF) was measured in the sensorimotor cortex (SMC) region in which baseline (off-state) metabolic activity was previously found to be elevated in levodopa-induced dyskinesia (LID) subjects (n = 12) compared with their non-LID (NLID) counterparts (n = 12) (see Results). (A) Hypercapnic CBF increases in this region were observed consistently in LID, NLID, and normal (NL) subjects (n = 12). Horizontal arrows denote significance levels (P values) for each group according to the paired Student’s t test. (B) In contrast to the putamen (Figures 1 and 3), hypercapnic responses in this region did not differ across the three groups of subjects. Horizontal arrows denote significance levels (P values) for group comparisons according to the post-hoc Bonferroni test of 1-way ANOVA. (Graphical displays as in Figures 1–3.)
Clinical/imaging correlations.
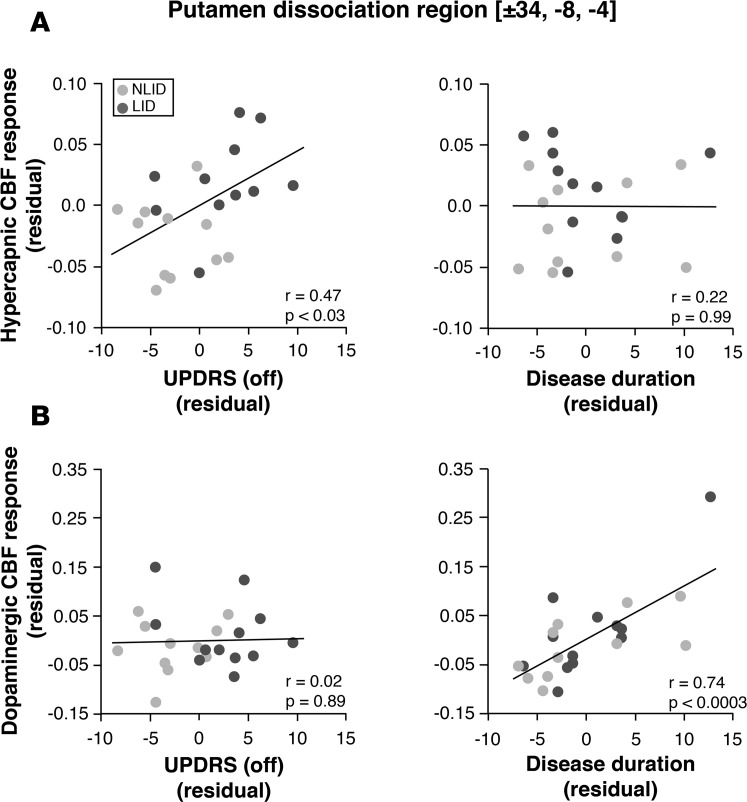
We examined the relationship between local vasomotor responses measured in the putamen LDDR and clinical descriptors of disease progression obtained in the individual PD subjects. Correlation analyses (Table 1) showed that HC CBF responses in the putamen LDDR area correlated with the off-state Unified Parkinson’s Disease Rating Scale (UPDRS) motor ratings (r = 0.513, P < 0.02; Pearson’s correlation) and not with symptom duration (r = 0.161, P = 0.453). Given that motor ratings and disease duration were intercorrelated in this PD sample (r = 0.428, P < 0.05), we used partial correlation analysis to isolate the effects of each clinical covariate while controlling for individual differences in the other covariate. After adjusting for the effects of duration, HC CBF responses in the putamen dissociation region (Figure 5A, left) correlated significantly with off-state UPDRS motor ratings (r = 0.465, P < 0.03; partial correlation). That said, taking individual differences in off-state motor ratings into account (Figure 5A, right), the correlation of HC responses in this region with symptom duration was not significant (r = 0.217, P = 0.99; partial correlation).
Table 1. Clinical correlates of hypercapnic and dopaminergic CBF responses.
Figure 5. Clinical correlates of hypercapnic and dopaminergic cerebral blood flow responses in the putamen dissociation region.
We used multiple regression analysis to determine the relationship between hypercapnic or levodopa-mediated cerebral blood flow (CBF) responses measured in the putamen dissociation region and clinical descriptors of disease progression: symptom duration and off-state motor severity ratings were according to the Unified Parkinson’s Disease Rating Scale (UPDRS part III) (see Methods). In levodopa-induced dyskinesia (LID; n = 12) and non-LID (NLID; n = 12) subjects, partial correlation leverage plots of multiple regression analysis revealed a “double dissociation” in the clinical correlates of the two CBF response measures in this region. (A) Hypercapnic CBF responses measured in the putamen levodopa dissociation region correlated with off-state motor disability ratings but not with symptom duration. (B) By contrast, levodopa-mediated CBF responses in this region measured in the same subjects correlated with symptom duration but not with off-state motor disability ratings. Analogous findings were observed for correlations of the hypercapnic and levodopa-mediated CBF responses measured in the ventral putamen interaction cluster (Figure 3A). (Leverage plots of the combined data from LID [dark gray] and NLID [light gray] subjects depict the effects of the clinical descriptors on each of the response measures determined in this brain region. The values displayed on each axis represent residuals following adjustment for the other variables in the multiple regression analysis.) P values denote significance levels of partial correlations according to the multiple regression analysis.
In contrast to the HC response in the putamen dissociation region, vasomotor levodopa responses measured in the same region were found to correlate with duration (r = 0.592, P < 0.003; Pearson’s correlation) but not with off-state UPDRS motor ratings (r = 0.335, P = 0.12). Indeed, controlling for variation in the off-state motor ratings, local vasomotor responses to levodopa (Figure 5B, right) correlated strongly with duration (r = 0.739, P < 0.0003; partial correlation). However, after adjusting for the effects of duration (Figure 5B, left), the correlation with off-state motor rating values remained nonsignificant (r = 0.02. P = 0.89; partial correlation). A similar “double dissociation” was observed for the partial correlations of HC and levodopa-mediated CBF responses recorded in the ventral putamen cluster (Figure 3A) with the corresponding clinical progression measures.
Discussion
Dissociation of vasomotor and metabolic responses to levodopa has been noted as a consistent feature of acute drug administration in human PD (3, 4) and in the 6-OHDA rat model (5, 6). This phenomenon is closely linked to levodopa-mediated increases in local CBF, likely related to engagement of D1 receptors on blood vessels apposed to dopamine terminals in the mammalian striatum (8, 9, 19). While the magnitude of the putamen vasomotor levodopa response is greater in dyskinetic PD subjects (4) and 6-OHDA rats (5), significant dissociation effects have been documented in both species whether or not abnormal involuntary movements were concurrently elicited by the drug (3, 6). This contrasts with the development of angiogenesis in the chronically levodopa-treated 6-OHDA rodent, wherein localized microvascular pathology is closely linked to the appearance of dyskinesia (12, 13, 16). Given the immaturity of angiogenic blood vessels, the increases in local CBF induced acutely by levodopa may lead to transient stretching of the endothelial lining and consequent changes in blood-brain barrier permeability (2, 5). Such effects, needless to say, are unlikely to occur in areas with normally developed capillary endothelium (4). While this hypothesis may explain key features of striatal levodopa transport in the dyskinetic rodent model, evidence for angiogenesis in human PD is comparatively limited (14–16).
To address this issue, it would be desirable to identify and measure localized angiogenesis in living LID subjects. While a variety of techniques are under development to image angiogenesis, most are designed for oncologic use. Indeed, in contrast to tumor angiogenesis, the degree of localized vascular proliferation anticipated in PD subjects with LID is likely to be relatively mild. Moreover, in the current study, we sought to quantify vascular changes in the putamen LDDR, a relatively small brain region that was identified using functional imaging (3, 4), but which was normal on routine anatomical MRI. Given these challenges, we chose an indirect functional approach in which local HC CBF responses were mapped using a standard H215O PET technique. The strategy was based upon prior experimental findings from the transgenic VEGF overexpression mouse model (17). In these animals, localized angiogenesis in the brain was associated with increased HC CBF in the same areas. Indeed, in this model, CBF measured under HC conditions correlated with local capillary density, supporting the use of the measure as a quantitative descriptor of underlying vascular proliferation.
In contrast to the local vasomotor response to levodopa, which is likely driven by the engagement of endothelial D1 receptors, CO2-mediated vasodilation is regulated downstream by the effects of nitric oxide on vascular tone (20, 21). We note that, while the HC CBF response appears to be sensitive to local capillary density (see above), the vasomotor levodopa response likely is also influenced to some degree by this factor. It is therefore perhaps not surprising that in the PD subjects a significant correlation between the two response measures was observed in the putamen, wherein VEGF upregulation and increased microvascular density have both been documented in postmortem samples (14, 16). We further note that significant HC and levodopa-mediated CBF responses were additionally seen in other brain areas, such as the pallidal and pontine LDDRs and the previously identified “LID-related” region in the SMC (4). Correlations between local response measures in individual regions were not significant, however, outside the putamen. Further studies are needed to determine the specificity of the association for angiogenesis in different brain areas.
While the HC and levodopa-mediated CBF responses in the putamen LDDR are significantly related, this correlation was modest, accounting for less than 25% of the overall variance. Indeed, we noted a remarkable difference in the clinical correlates of the two measures. Specifically, HC responses in this region correlated with clinical severity, as measured by off-state UPDRS motor ratings, but not with the duration of symptoms. This contrasted with the vasomotor levodopa responses in the same region, which correlated with duration but not with motor ratings. Indeed, this “double dissociation” was highlighted by the leverage plots, which displayed the correlations adjusted for mutual interactions between the response measures on one hand and between the clinical regressors on the other. The results of this analysis accord with our earlier observation that vasomotor responses to levodopa in the putamen are associated with longer disease duration (4). Given that levodopa treatment was initiated early in these patients, we were not able to determine the degree to which this relationship was influenced by levodopa exposure as opposed to symptom duration. Even so, the weight-corrected daily levodopa dose [LDD(w)], which functioned as a proxy for the aggregate amount of the drug that the subject received over time (4), had no effect on the results of the model. Similarly, no relationship was discerned between LDD(w) values and vasoreactivity to levodopa or HC measured in the putamen LDDR.
Recent epidemiologic findings support the differential roles for disease duration and severity in the pathogenesis of LID (22). In this context, the motor UPDRS can be construed as the clinical counterpart of putamen dopaminergic denervation. This is also in line with the consistent correlation of off-state motor ratings with loss of dopaminergic signal in the putamen, as measured using PET or single-photon emission computed photography methods (23–25). By contrast, correlations with duration (corrected for individual differences in off-state motor ratings) assess relationships with the chronicity of disease, duration of treatment, or a combination of the two variables. Thus, as an index of capillary reserve and underlying microvascular proliferation, HC responses in the putamen correlated with the pathological feature most intimately linked to focal angiogenesis in the dyskinetic rat model, namely nigrostriatal dopamine denervation (12, 13, 16), and with the clinical counterpart of these changes in humans, namely off-state UPDRS motor rating (22). The dopaminergic vasomotor response measured in the putamen relates analogously to disease duration in a particular PD patient. This measure captures the acute effect of levodopa administration on putamen CBF, which is dominated by direct vasomotor effects of the drug on the vessel wall (7, 8). The current findings extend our prior observations relating vasomotor levodopa responses in the putamen to disease duration (3, 4). Based on the data, it is tempting to relate dopaminergic CBF responses in this region to local upregulation of vascular D1 receptors, which may increase as a function of disease duration. The local HC response, by contrast, is specifically associated with the changes in capillary density that develop regionally through angiogenesis. Both effects, notably, are exaggerated in individuals with LID, suggesting that this complication of treatment is mediated through a convergence of the two mechanisms.
We have previously found that levodopa-mediated dissociation effects are localized to brain areas that express dopa decarboxylase, which therefore can convert exogenous levodopa to dopamine (3). That said, key regions associated with LID exhibited substantial loss of dopaminergic input as part of the disease process as well as commensurate metabolic increases in target regions (3, 4, 26). This combination of effects may constitute a potent stimulus for angiogenesis in specific brain regions (4, 27). Indeed, the increases in dopaminergic and HC CBF responses seen in LID subjects are located within the area of elevated resting-state metabolic activity in the basal ganglia that has been noted as a consistent underlying feature of the disorder (3, 28, 29).
While the current data implicate angiogenesis as a major factor in the development of LID, its role remains to be confirmed. That said, vascular proliferation may represent an effective target to delay or even prevent the development of LID in PD patients. Therapies designed to attenuate the dopaminergic vasomotor response may be beneficial in this regard. Angiogenesis induced by levodopa in the 6-OHDA rat model is dependent on the stimulation of D1 receptors as well as activation of extracellular signal–regulated kinases (ERK1/2) (12). Selective D1 antagonist drugs may therefore be used to block the acute vasoreactive effects of levodopa while inhibiting the angiogenic process itself (2). Along these lines, recent evidence from the rotenone model suggests that nonsteroidal antiinflammatory drugs, such as ibuprofen/piroxicam, can retard the development of LID by reducing local VEGF and COX-2 levels (30). It remains to be seen whether these or other antiangiogenic strategies will be useful in mitigating LID in levodopa-treated PD patients.
Methods
Subjects.
We studied 24 PD subjects (18 men and 6 women; age 63.3 ± 9.0 [mean ± SD] years; duration 8.2 ± 5.9 years; baseline off-state UPDRS motor ratings 22.4 ± 5.8). The diagnosis of PD in these subjects was made according to the UK Brain Bank Criteria for idiopathic PD (31). All subjects exhibited greater than 20% improvement in UPDRS motor ratings following a single oral dose of carbidopa/levodopa.
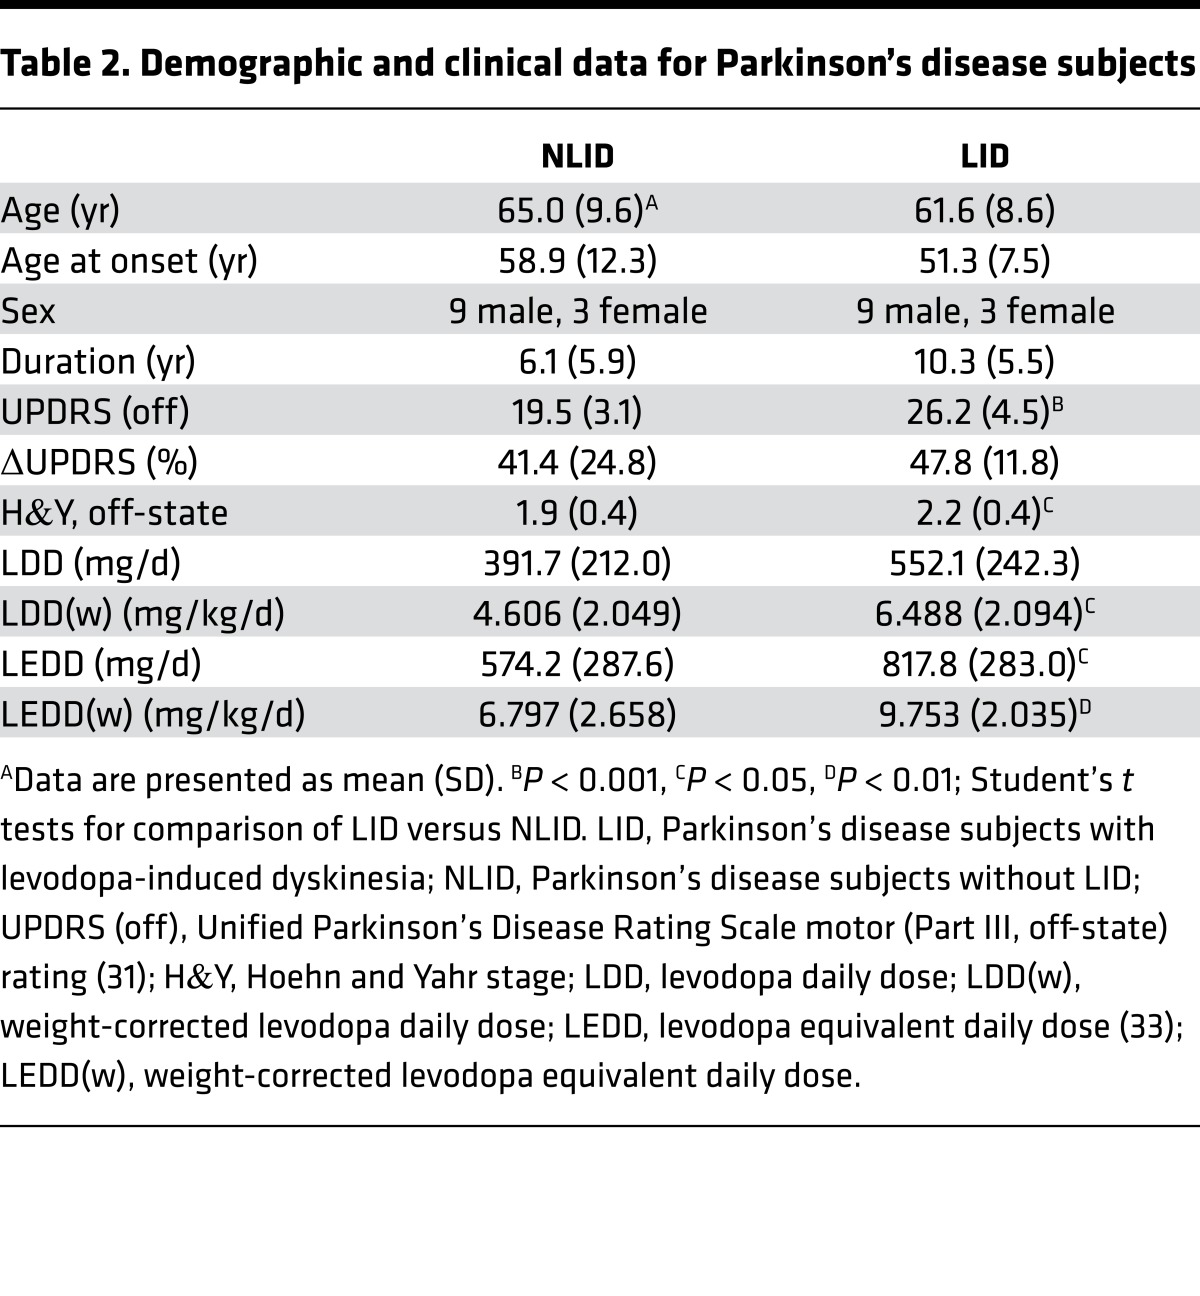
The PD subjects underwent individually titrated intravenous levodopa infusion as described elsewhere (3). Patients were divided into two groups based on whether observable dyskinesias were elicited during the infusion. The demographic and clinical features of the subjects in each group are presented in Table 2. The NLID group comprised 12 subjects (9 men and 3 women; age 65.0 ± 9.6 years; duration 6.1 ± 5.9 years; UPDRS motor ratings 19.5 ± 3.1) who had stable responses to levodopa infusion (0.55 ± 0.30 mg/kg/h) that improved motor symptoms (change in UPDRS motor ratings 7.8 ± 5.0; 41.4% ± 24.8%) without dyskinesia. The LID group comprised the remaining 12 subjects (9 men and 3 women; age 61.6 ± 8.6 years; duration 10.3 ± 5.5 years; UPDRS motor ratings 26.2 ± 4.5), in whom levodopa infusion (0.89 ± 0.46 mg/kg/h) improved motor symptoms (change in UPDRS motor ratings 12.3 ± 2.7; 47.8% ± 11.8%) while concurrently giving rise to sustained dyskinesias. The two groups did not differ significantly in age or sex (P > 0.36). While symptom duration was longer in the LID subjects than in the NLID subjects (LID: 10.3 ± 5.5 years; NLID: 6.1 ± 5.9 years), this difference was of only marginal significance (P = 0.08; Student’s t test). Differences between groups in the levodopa infusion rate needed to achieve maximal clinical improvement and in the mean change in UPDRS motor ratings during the infusion did not reach significance (P > 0.06).
Table 2. Demographic and clinical data for Parkinson’s disease subjects.
PET.
PD patients in both groups were studied in the baseline off-levodopa state with H215O PET to map CBF under NC (pCO2 = 41.06 ± 4.17 mmHg) and in a HC condition (HC: pCO2 = 45.30 ± 4.60 mmHg) achieved after 1 minute of 5% CO2 rebreathing under anesthesiology supervision (32). CBF maps from LID and NLID patients obtained under the NC and HC conditions were compared with corresponding maps generated in 12 age- and sex-matched healthy control subjects (9 men and 3 women; age 61.7 ± 8.0 years) who were scanned under analogous experimental conditions (NC: pCO2 = 40.36 ± 4.75 mmHg; HC: pCO2 = 44.10 ± 6.14 mmHg).
In all subjects, H215O PET scans were acquired in 3D mode using the GE Advance Tomograph (General Electric) at the Feinstein Institute for Medical Research. To map CBF in the NC and HC conditions, each subject was scanned with H215O PET in the unmedicated off-state. For each experimental condition, a 90-second CBF image was acquired following the injection of 10-mCi radiotracer. To compare CBF responses to HC with those induced in the same subjects by levodopa infusion on the same day, the PD subjects additionally underwent H215O PET scanning under NC during an intravenous levodopa infusion (mean infusion rate: 0.74 ± 0.43 mg/kg/h) titrated to achieve maximal motor improvement in individual subjects (change in UPDRS motor ratings: 10.0 ± 4.5; 44.6% ± 19.3%). Limited CBF data from 16 of the PD subjects obtained at baseline and during levodopa infusion have been reported previously (4).
Image processing was performed using SPM5 software (http://www.fil.ion.ucl.ac.uk/spm/software/spm5/; Wellcome Department of Cognitive Neurology, University College, London, UK) implemented in Matlab 7.0.1 (MathWorks). The scans from each subject were realigned, spatially normalized, and smoothed with an isotropic Gaussian kernel (full width at half maximum 15 mm) to improve signal-to-noise ratio.
Data analysis.
We have previously found that local vasomotor and metabolic responses to levodopa are consistently dissociated in the putamen, internal globus pallidus, ventral thalamus, and dorsal pons of PD patients (3, 4). To assess HC vasoreactivity in these LDDRs, we defined volumes of interest (VOIs) corresponding to the stereotaxic coordinates of these previously identified brain areas (4). In this study, VOIs for each LDDR were automatically positioned on the aligned CBF maps obtained under NC and HC conditions in the off-state. Globally normalized CBF values were recorded for each LDDR under these conditions and in a NC on-state obtained during an individually titrated levodopa infusion as described in detail elsewhere (3). Values were averaged for VOIs obtained at peak voxel and at the mirror coordinates on the opposite hemisphere. Based on these measurements, we computed the HC CBF response (ΔHC = CBFHC – CBFNC) in each subject for the individual LDDRs and for the separate LID-related region that was previously identified bilaterally in the SMC (4). ΔHC values for each region were compared across the LID, NLID, and control groups. These values were additionally correlated with corresponding dopaminergic CBF response (ΔDA = CBFON – CBFOFF) obtained independently in the PD subjects.
Voxel-wise searches for areas with increased HC response in LID versus NLID subjects.
In addition to hypothesis-based comparisons of ΔHC responses in prespecified LDDR areas, we interrogated scan data from the entire brain for other areas in which these responses differed significantly for LID versus NLID subjects. Thus, we conducted whole-brain voxel-wise searches for clusters with significant group (LID/NLID) × condition (HC/NC) interaction effects. Given the exploratory nature of this analysis, clusters were considered significant at a threshold of P < 0.001 (voxel-level, uncorrected) with a cluster cutoff of 100 voxels. Spherical VOIs (radius = 3 mm) were used for post-hoc measurement of local CBF in the NC and HC conditions and ΔHC values in the regions with significant interaction effects.
Clinical correlates.
To explore potential relationships between HC vasoreactivity measured in the previously specified LDDRs and in a SMC region in which baseline (off-state) CBF and metabolic activity were abnormally elevated in LID subjects (4) and clinical indices of disease progression, we correlated regional ΔHC values with symptom duration (as reported by the patient and/or the clinical record) and baseline motor disability (off-state UPDRS III ratings) obtained at the time of the study. We additionally evaluated correlations of the HC CBF response with the LDD(w) determined at the time of the study. This measure significantly correlated (r = 0.76, P = 0.001) with accumulated levodopa exposure in 15 of the PD subjects (6 NLID, 9 LID) for whom detailed medication histories were available. LDD(w) has been used as a clinical covariate in prior LID studies (4, 22). Relationships between the disease progression measures and local vasomotor responses to HC (ΔHC) and levodopa (ΔDA) in each of the LDDRs were evaluated using multiple regression analysis. Regression models were constructed based upon single and multiple predictor variables. The effect of each predictor on the regional drug or HC response was assessed graphically using leverage plots (partial correlations) in which the residuals for the dependent variable were plotted against those for each of the predictors after removing the other effects in the model.
Statistics.
Differences in demographic features and clinical measures among PD groups were evaluated using 2-tailed Student’s t tests or χ2 tests. For each LDDR area, regional ΔHC values were computed for the LID, NLID, and healthy control subjects and compared across groups using 1-way ANOVA with post-hoc Bonferroni tests as appropriate. Group × condition interaction effects in the CBF data were assessed for each VOI using 2 × 2 repeated-measures ANOVA with post-hoc Bonferroni tests. The relationship between ΔDA and ΔHC in regions with significant dissociation effects was assessed by computing Pearson product-moment correlation. Parallel statistical analyses were performed on ΔHC values measured in the clusters with significant group × condition interaction effects identified in the exploratory voxel-wise searches described above.
All statistical analyses were performed in SAS 9.3, and the results were considered significant at P < 0.05.
Study approval.
Ethical approval for the studies was obtained from the Institutional Review Board of Northwell Health. Written consent was obtained from each subject after detailed explanation of the procedures.
Author contributions
DE designed the research; VAJ, KAS, MN, YYC, DM, AN, DN, NC, AF, and VD performed the research; VAJ, CCT, YM, SP, and DE analyzed the data; and VAJ, KAS, and DE wrote the paper.
Acknowledgments
This work was supported by the National Institute of Neurological Disorders and Stroke Morris K. Udall Center of Excellence for Parkinson’s Disease Research at the Feinstein Institute for Medical Research (P50 NS071675 to DE). The content is solely the responsibility of the authors and does not necessarily represent the official views of the National Institute of Neurological Disorders and Stroke or the National Institutes of Health. The sponsor did not play a role in study design; collection, analysis, and interpretation of data; writing of the report; or in the decision to submit the paper for publication. VAJ is the recipient of a fellowship award from the Fonds de Recherche en Santé du Québec. KAS is the recipient of the Leopoldina Fellowship Programme of the German National Academy of Sciences Leopoldina (LDS 2016-08). The authors thank Toni Fitzpatrick and Michael Small for their assistance in preparing the manuscript for publication. Special thanks to Thomas Chaly for valuable radiochemistry support and to David Bjelke, Claude Margouleff, and Limei Zhuo for technical assistance.
Version 1. 10/19/2017
Electronic publication
Footnotes
Conflict of interest: The authors have declared that no conflict of interest exists.
Reference information: JCI Insight. 2017;2(20):e96411. https://doi.org/10.1172/jci.insight.96411.
Contributor Information
Katharina A. Schindlbeck, Email: kschindl@northwell.edu.
Chris C. Tang, Email: ctang@nshs.edu.
Martin Niethammer, Email: mniethamme@northwell.edu.
Yoon Young Choi, Email: choiyy@umich.edu.
Daniel Markowitz, Email: dmarko2@pride.hofstra.edu.
Amir Nazem, Email: anazem@northwell.edu.
Dominic Nardi, Email: dnardimd@me.com.
Nicholas Carras, Email: ncarras@napaanesthesia.com.
Andrew Feigin, Email: afeigin@northwell.edu.
Yilong Ma, Email: yma@nshs.edu.
Shichun Peng, Email: speng@northwell.edu.
Vijay Dhawan, Email: dhawan@nshs.edu.
David Eidelberg, Email: david1@nshs.edu.
References
- 1.Van Gerpen JA, Kumar N, Bower JH, Weigand S, Ahlskog JE. Levodopa-associated dyskinesia risk among Parkinson disease patients in Olmsted County, Minnesota, 1976-1990. Arch Neurol. 2006;63(2):205–209. doi: 10.1001/archneur.63.2.205. [DOI] [PubMed] [Google Scholar]
- 2.Cenci MA. Presynaptic Mechanisms of l-DOPA-Induced Dyskinesia: The Findings, the Debate, and the Therapeutic Implications. Front Neurol. 2014;5:242. doi: 10.3389/fneur.2014.00242. [DOI] [PMC free article] [PubMed] [Google Scholar]
- 3.Hirano S, et al. Dissociation of metabolic and neurovascular responses to levodopa in the treatment of Parkinson’s disease. J Neurosci. 2008;28(16):4201–4209. doi: 10.1523/JNEUROSCI.0582-08.2008. [DOI] [PMC free article] [PubMed] [Google Scholar]
- 4.Jourdain VA, et al. Flow-metabolism dissociation in the pathogenesis of levodopa-induced dyskinesia. JCI Insight. 2016;1(15):e86615. doi: 10.1172/jci.insight.86615. [DOI] [PMC free article] [PubMed] [Google Scholar]
- 5.Ohlin KE, Sebastianutto I, Adkins CE, Lundblad C, Lockman PR, Cenci MA. Impact of L-DOPA treatment on regional cerebral blood flow and metabolism in the basal ganglia in a rat model of Parkinson’s disease. Neuroimage. 2012;61(1):228–239. doi: 10.1016/j.neuroimage.2012.02.066. [DOI] [PMC free article] [PubMed] [Google Scholar]
- 6.Lerner RP, et al. Dissociation of metabolic and hemodynamic levodopa responses in the 6-hydroxydopamine rat model. Neurobiol Dis. 2016;96:31–37. doi: 10.1016/j.nbd.2016.08.010. [DOI] [PMC free article] [PubMed] [Google Scholar]
- 7. Edvinsson L, Krause D. Catecholamines. In: Edvinsson L, Krause D, eds. Cerebral Blood Flow and Metabolism. Philadelphia, PA: Lippincott Williams & Wilkins;2002:191–211. [Google Scholar]
- 8.Choi JK, Chen YI, Hamel E, Jenkins BG. Brain hemodynamic changes mediated by dopamine receptors: Role of the cerebral microvasculature in dopamine-mediated neurovascular coupling. Neuroimage. 2006;30(3):700–712. doi: 10.1016/j.neuroimage.2005.10.029. [DOI] [PubMed] [Google Scholar]
- 9.Afonso-Oramas D, et al. Striatal vessels receive phosphorylated tyrosine hydroxylase-rich innervation from midbrain dopaminergic neurons. Front Neuroanat. 2014;8:84. doi: 10.3389/fnana.2014.00084. [DOI] [PMC free article] [PubMed] [Google Scholar]
- 10.Rocher AB, Chapon F, Blaizot X, Baron JC, Chavoix C. Resting-state brain glucose utilization as measured by PET is directly related to regional synaptophysin levels: a study in baboons. Neuroimage. 2003;20(3):1894–1898. doi: 10.1016/j.neuroimage.2003.07.002. [DOI] [PubMed] [Google Scholar]
- 11.Patel AB, et al. Direct evidence for activity-dependent glucose phosphorylation in neurons with implications for the astrocyte-to-neuron lactate shuttle. Proc Natl Acad Sci USA. 2014;111(14):5385–5390. doi: 10.1073/pnas.1403576111. [DOI] [PMC free article] [PubMed] [Google Scholar]
- 12.Lindgren HS, Ohlin KE, Cenci MA. Differential involvement of D1 and D2 dopamine receptors in L-DOPA-induced angiogenic activity in a rat model of Parkinson’s disease. Neuropsychopharmacology. 2009;34(12):2477–2488. doi: 10.1038/npp.2009.74. [DOI] [PubMed] [Google Scholar]
- 13.Westin JE, et al. Endothelial proliferation and increased blood-brain barrier permeability in the basal ganglia in a rat model of 3,4-dihydroxyphenyl-L-alanine-induced dyskinesia. J Neurosci. 2006;26(37):9448–9461. doi: 10.1523/JNEUROSCI.0944-06.2006. [DOI] [PMC free article] [PubMed] [Google Scholar]
- 14.Desai Bradaric B, Patel A, Schneider JA, Carvey PM, Hendey B. Evidence for angiogenesis in Parkinson’s disease, incidental Lewy body disease, and progressive supranuclear palsy. J Neural Transm (Vienna) 2012;119(1):59–71. doi: 10.1007/s00702-011-0684-8. [DOI] [PMC free article] [PubMed] [Google Scholar]
- 15.Janelidze S, et al. Increased CSF biomarkers of angiogenesis in Parkinson disease. Neurology. 2015;85(21):1834–1842. doi: 10.1212/WNL.0000000000002151. [DOI] [PMC free article] [PubMed] [Google Scholar]
- 16.Ohlin KE, et al. Vascular endothelial growth factor is upregulated by L-dopa in the parkinsonian brain: implications for the development of dyskinesia. Brain. 2011;134(Pt 8):2339–2357. doi: 10.1093/brain/awr165. [DOI] [PMC free article] [PubMed] [Google Scholar]
- 17.Vogel J, Gehrig M, Kuschinsky W, Marti HH. Massive inborn angiogenesis in the brain scarcely raises cerebral blood flow. J Cereb Blood Flow Metab. 2004;24(8):849–859. doi: 10.1097/01.WCB.0000126564.89011.11. [DOI] [PubMed] [Google Scholar]
- 18.Ben Bashat D, et al. Hemodynamic response imaging: a potential tool for the assessment of angiogenesis in brain tumors. PLoS ONE. 2012;7(11):e49416. doi: 10.1371/journal.pone.0049416. [DOI] [PMC free article] [PubMed] [Google Scholar]
- 19.García-Cabezas MA, Rico B, Sánchez-González MA, Cavada C. Distribution of the dopamine innervation in the macaque and human thalamus. Neuroimage. 2007;34(3):965–984. doi: 10.1016/j.neuroimage.2006.07.032. [DOI] [PubMed] [Google Scholar]
- 20.Iadecola C. Does nitric oxide mediate the increases in cerebral blood flow elicited by hypercapnia? Proc Natl Acad Sci USA. 1992;89(9):3913–3916. doi: 10.1073/pnas.89.9.3913. [DOI] [PMC free article] [PubMed] [Google Scholar]
- 21.Wang Q, Pelligrino DA, Baughman VL, Koenig HM, Albrecht RF. The role of neuronal nitric oxide synthase in regulation of cerebral blood flow in normocapnia and hypercapnia in rats. J Cereb Blood Flow Metab. 1995;15(5):774–778. doi: 10.1038/jcbfm.1995.97. [DOI] [PubMed] [Google Scholar]
- 22.Cilia R, et al. The modern pre-levodopa era of Parkinson’s disease: insights into motor complications from sub-Saharan Africa. Brain. 2014;137(Pt 10):2731–2742. doi: 10.1093/brain/awu195. [DOI] [PMC free article] [PubMed] [Google Scholar]
- 23.Huang C, et al. Changes in network activity with the progression of Parkinson’s disease. Brain. 2007;130(Pt 7):1834–1846. doi: 10.1093/brain/awm086. [DOI] [PMC free article] [PubMed] [Google Scholar]
- 24.Ishikawa T, et al. Comparative nigrostriatal dopaminergic imaging with iodine-123-beta CIT-FP/SPECT and fluorine-18-FDOPA/PET. J Nucl Med. 1996;37(11):1760–1765. [PubMed] [Google Scholar]
- 25.Kazumata K, et al. Dopamine transporter imaging with fluorine-18-FPCIT and PET. J Nucl Med. 1998;39(9):1521–1530. [PubMed] [Google Scholar]
- 26.Tang CC, Poston KL, Dhawan V, Eidelberg D. Abnormalities in metabolic network activity precede the onset of motor symptoms in Parkinson’s disease. J Neurosci. 2010;30(3):1049–1056. doi: 10.1523/JNEUROSCI.4188-09.2010. [DOI] [PMC free article] [PubMed] [Google Scholar]
- 27. Adair TH, Montani JP. Angiogenesis. In: Granger DN, Granger JP, eds. Colloquium Series on Integrated Systems Physiology: From Molecule to Function to Disease. San Rafael, CA: Morgan & Claypool Life Sciences;2010. https://www.ncbi.nlm.nih.gov/books/NBK53242/ [PubMed]
- 28.Niethammer M, Eidelberg D. Metabolic brain networks in translational neurology: concepts and applications. Ann Neurol. 2012;72(5):635–647. doi: 10.1002/ana.23631. [DOI] [PMC free article] [PubMed] [Google Scholar]
- 29.Holtbernd F, et al. Dopaminergic correlates of metabolic network activity in Parkinson’s disease. Hum Brain Mapp. 2015;36(9):3575–3585. doi: 10.1002/hbm.22863. [DOI] [PMC free article] [PubMed] [Google Scholar]
- 30.Teema AM, Zaitone SA, Moustafa YM. Ibuprofen or piroxicam protects nigral neurons and delays the development of l-dopa induced dyskinesia in rats with experimental Parkinsonism: Influence on angiogenesis. Neuropharmacology. 2016;107:432–450. doi: 10.1016/j.neuropharm.2016.03.034. [DOI] [PubMed] [Google Scholar]
- 31.Hughes AJ, Daniel SE, Kilford L, Lees AJ. Accuracy of clinical diagnosis of idiopathic Parkinson’s disease: a clinico-pathological study of 100 cases. J Neurol Neurosurg Psychiatr. 1992;55(3):181–184. doi: 10.1136/jnnp.55.3.181. [DOI] [PMC free article] [PubMed] [Google Scholar]
- 32.Yezhuvath US, Lewis-Amezcua K, Varghese R, Xiao G, Lu H. On the assessment of cerebrovascular reactivity using hypercapnia BOLD MRI. NMR Biomed. 2009;22(7):779–786. doi: 10.1002/nbm.1392. [DOI] [PMC free article] [PubMed] [Google Scholar]
- 33.Tomlinson CL, Stowe R, Patel S, Rick C, Gray R, Clarke CE. Systematic review of levodopa dose equivalency reporting in Parkinson’s disease. Mov Disord. 2010;25(15):2649–2653. doi: 10.1002/mds.23429. [DOI] [PubMed] [Google Scholar]


