Abstract
The selective coupling of G protein-coupled receptors (GPCRs) to specific G proteins is critical to trigger the appropriate physiological response. However, the determinants of selective binding have remained elusive. Here, we reveal the existence of a selectivity barcode (i.e. patterns of amino acids) on each of the 16 human G proteins that is recognised by distinct regions on the ~800 human receptors. Although universally conserved positions in the barcode allow the receptors to bind G proteins in a similar orientation, different receptors recognise the unique positions of the G protein barcode through distinct residues, similar to multiple keys (receptors) opening the same lock (G protein) using non-identical cuts. Considering the evolutionary history of GPCRs permits the identification of these selectivity-determining residues. These findings lay the foundation for understanding the molecular basis of coupling selectivity within individual receptors and G proteins.
Membrane protein receptors trigger the appropriate cellular response to extracellular stimuli by selective interaction with cytosolic adaptor proteins. In humans, GPCRs form the largest family of receptors with over 800 members1–3. Although GPCRs bind a staggering number of natural ligands (~1,000), they primarily couple to only four major Gα families encoded by 16 human genes3,4. Members of each of the four families regulate key effectors (e.g. adenylate cyclase, phospholipase C, etc.) and the generation of secondary messengers (e.g. cAMP, Ca2+, IP3, etc.) that in-turn trigger distinct signalling cascades5,6. Thus, the selective binding of ligand-activated GPCRs to appropriate Gα proteins is critical for signal transduction5.
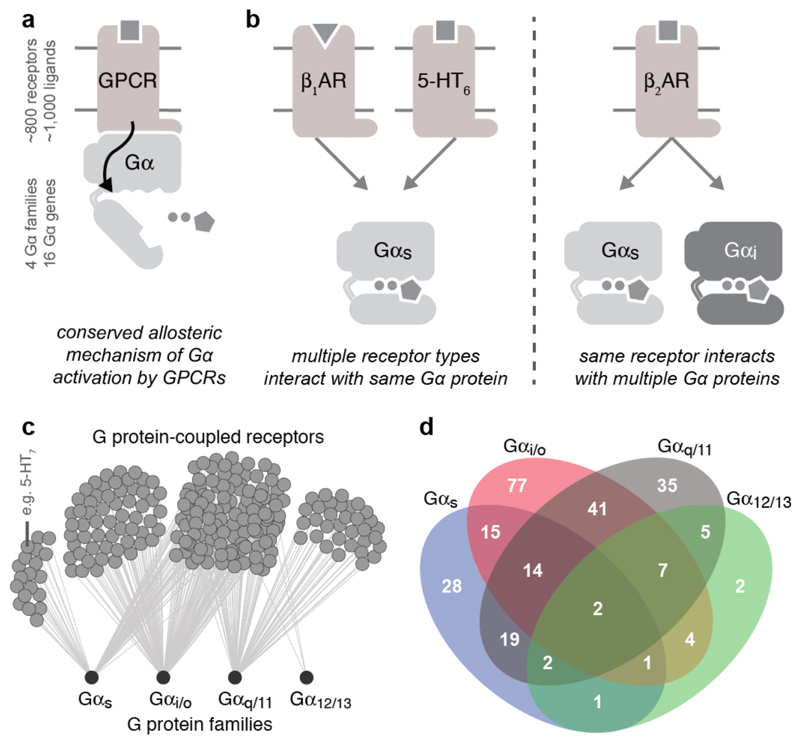
Typically, ligand binding to a receptor leads to the recruitment of a heterotrimeric G protein (Gαβγ), nucleotide exchange in Gα, and dissociation of the G protein subunits7 (Fig. 1a). However, several distinct receptors can couple to the same Gα protein (Fig. 1b; β1-adrenergic receptor8 and 5-HT6 receptor9 can both activate Gαs, resulting in heart muscle contraction and excitatory neurotransmission, respectively3). Receptors can also couple to more than one Gα protein (Fig. 1b; β2-adrenergic receptor primarily couples to Gαs, resulting in smooth muscle relaxation but can also couple to Gαi to inhibit this response10). An analysis of reported G protein coupling data highlights the complexity of coupling selectivity in the receptor-G protein signalling system (Fig. 1c,d, Extended Data Fig. 1a,b, and Supplementary Data).
Figure 1. Selectivity in GPCR-G protein signalling.
a, GPCRs activate G proteins through a conserved mechanism. b, The same G protein can be activated by different receptors, and the same receptor can couple to different G proteins. c, Network representation of the currently available G protein coupling data. d, Numbers of receptors coupling to different (sets of) G proteins.
Although coupling selectivity could be achieved by regulating gene expression in a cell-type specific manner and altering relative expression levels, many different receptors and Gα proteins are expressed simultaneously in several cell-types (Extended Data Fig. 2). This suggests that residues at the GPCR-G protein interface play a role in determining selectivity. Despite considerable progress studying individual receptor-G protein complexes11–16 (Supplementary Table 1), elucidating the molecular basis of selective binding has been challenging. Here, we infer selectivity determinants, i.e. positions and patterns of amino acids, at the interaction interface for the entire GPCR-G protein signalling system and present a resource (http://www.gpcrdb.org/ tab ‘Signal Proteins’) for each of the ~800 human receptors and 16 Gα proteins.
GPCR and Gα protein repertoires
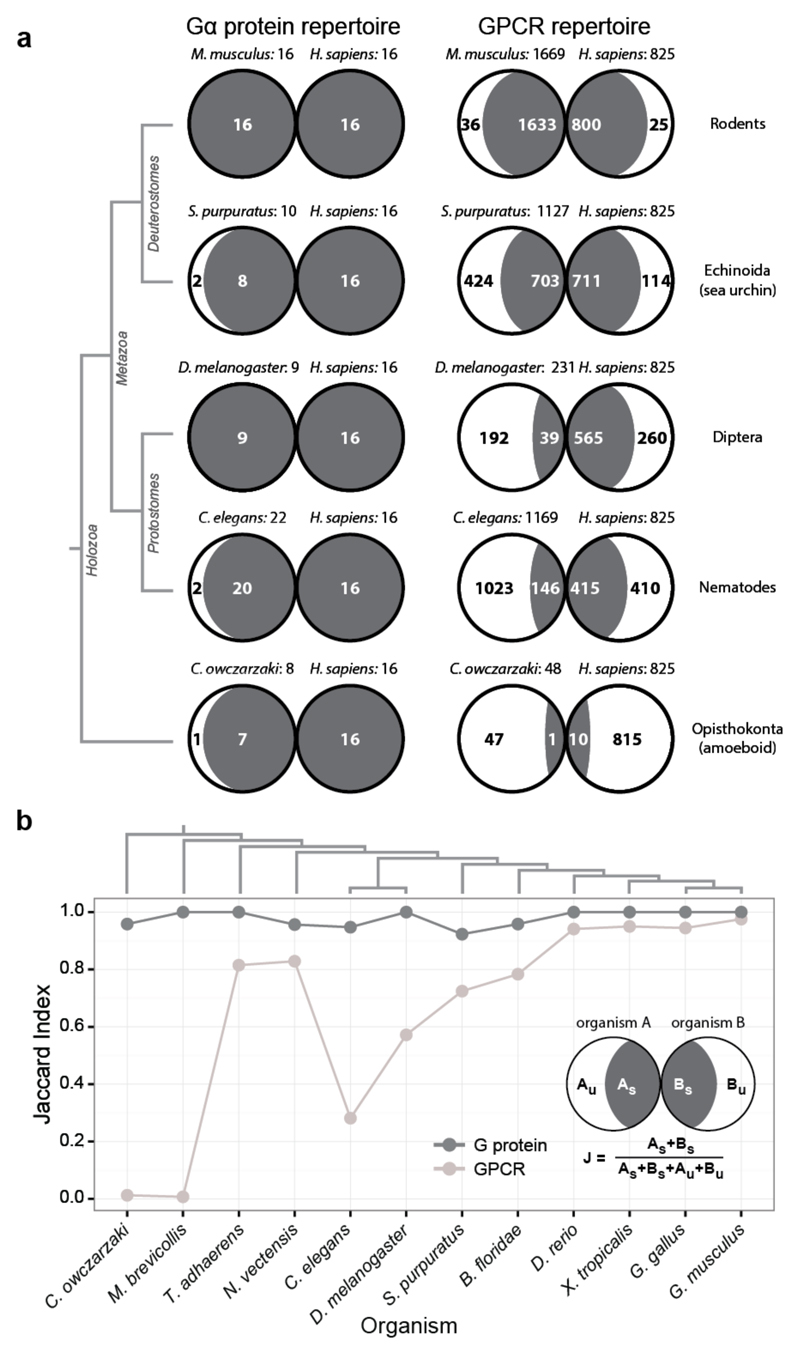
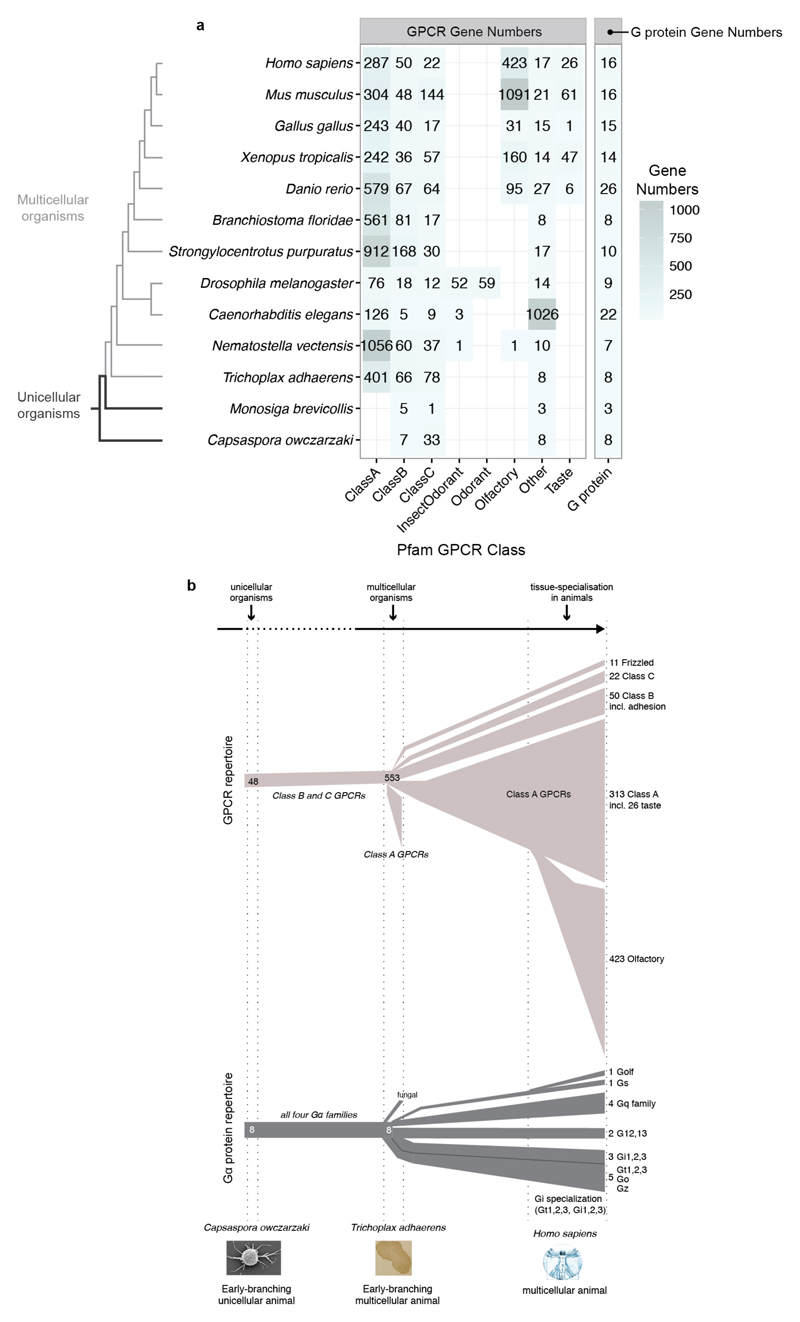
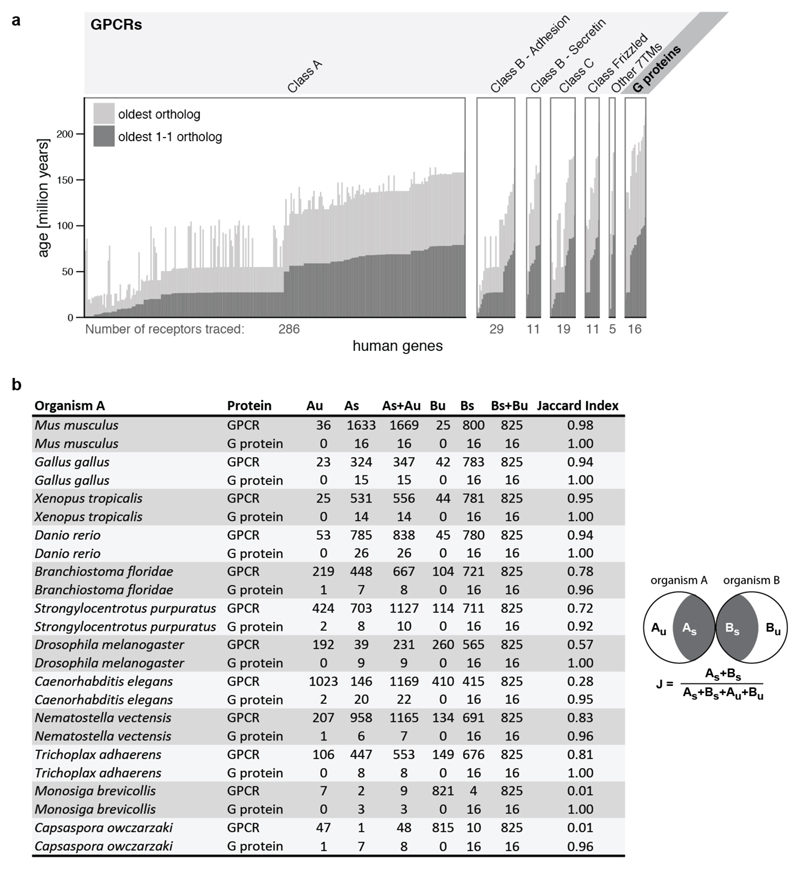
Understanding how GPCRs and Gα proteins evolve could provide insights into the constraints underlying selective coupling. The genomes of unicellular sister groups of metazoans (~900 million years ago) encode a small number of genes for the GPCR-G protein system2,17,18 (Extended Data Fig. 3a). Nevertheless, they have representatives of all four human Gα protein families, Class B and Class C GPCRs (Extended Data Fig. 3b). Although Class A receptors were not detectable in this group, some unicellular fungi contain members of this class19. The genome of Trichoplax adhaerens, one of the earliest-branching multicellular animals, has representatives of all four human Gα families, as well as class A GPCRs that have undergone widespread gene duplication (Extended Data Fig. 3b). Whereas most human Gα proteins have orthologs across organisms, only few human GPCRs have orthologs that can be traced back to early-branching organisms (Fig. 2a and Extended Data Fig. 4a). Nevertheless, GPCRs (especially Class A) have undergone lineage-specific increase in gene number compared to Gα proteins (Extended Data Fig. 3a). Thus, each organism has a large GPCR repertoire that is unique (i.e. not orthologous to the human receptors; Fig. 2a). In contrast, the Gα repertoire remained comparable across organisms. A comparative analysis (Jaccard Similarity, J; Fig. 2b; Extended Data Fig. 4b; Methods) revealed that the Gα repertoire is more static (average J = 0.98; σ = 0.03) compared to the more dynamic GPCR repertoire (average J = 0.65; σ = 0.36). These results suggest that Gα protein sequences are likely to be under higher evolutionary constraint as they need to couple to diverse receptors that have evolved independently on multiple occasions in different organisms.
Figure 2. Asymmetric evolution of the GPCR and Gα protein repertoire.
a, GPCR and G protein repertoires of human and five organisms from different lineages (see Extended Data Fig. 4b). Fraction of proteins in each organism that are related (dark grey) or unique (white) is shown. b, Evolutionary dynamics (Jaccard similarity index) of GPCRs (light grey) and G proteins (dark grey) between human and 12 organisms. The subscript U and S for organisms A and B refer to the number of unique and shared genes, respectively. The higher fraction of human receptors shared with Trichoplax adhaerens and Nematostella vectensis highlights that these organisms shared a complex gene repertoire with human, which was lost in some other lineages (e.g. insects).
Subtype-specific residues in Gα proteins
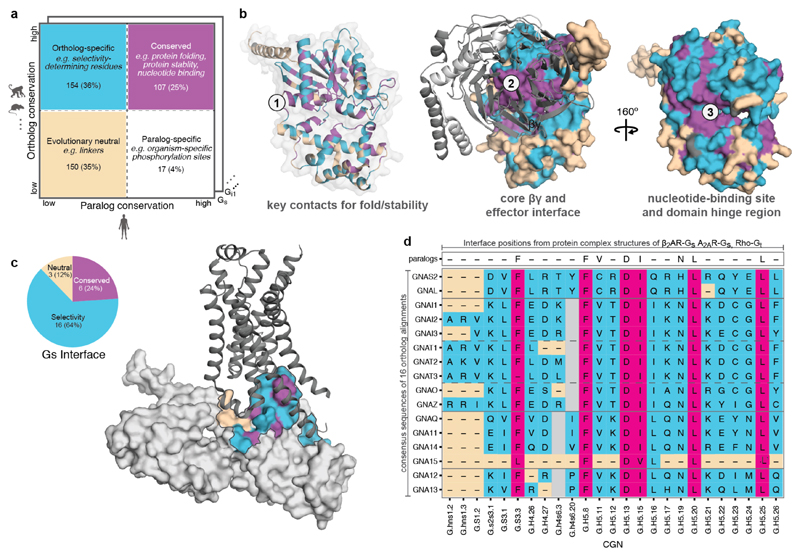
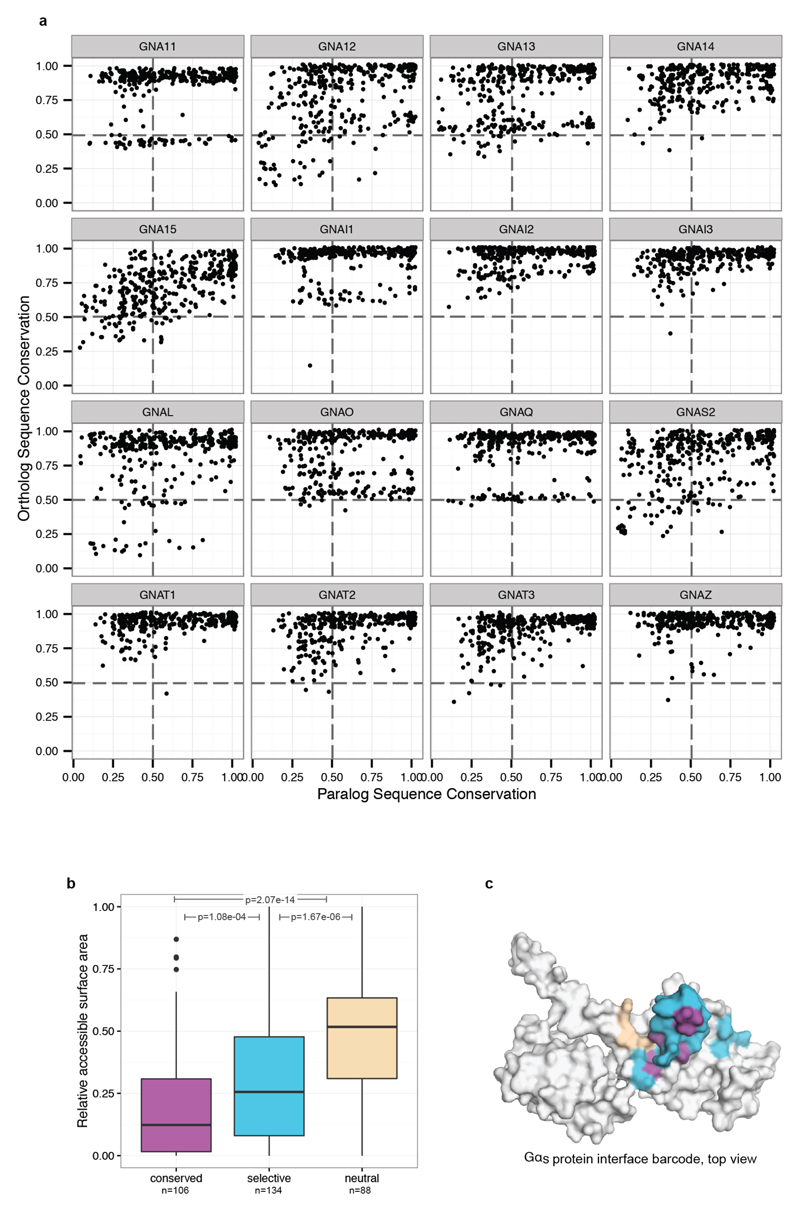
Selectivity determining positions can be inferred by comparing the conservation of every residue in a protein with its paralogs and their corresponding orthologs (Fig. 3a)20. We applied this principle to each of the 16 human Gα protein subtypes by comparing them to their respective one-to-one orthologs from 66 genomes and identified the highly conserved, subtype-specifically conserved and neutrally evolving positions (Fig. 3a; Extend Data Fig. 5a; Supplementary Data). For instance, in Gαs, 107 positions are highly conserved in all Gα orthologs and human paralogs. Mapping this information onto the GDP bound form of the Gαs structure showed that they typically map to the protein core, and hence are likely to be important for common functions for the entire Gα family such as protein fold maintenance and stability (Fig. 3b; Extend Data Fig. 5b). Many are also on the protein surface, and map to the nucleotide-binding pocket, and to the core of the βγ−, effector- and receptor-binding interface (magenta residues; Fig. 3b-c). 150 positions evolve neutrally and are primarily present on the protein surface (beige residues). 164 positions in Gαs are variable among the Gα paralogs, but the specific residue is conserved among all the Gαs orthologs (Fig. 3b; cyan residues). Several of these positions map primarily to the protein surface (Extend Data Fig. 5b), suggesting that they could determine the selective binding of Gα to distinct βγ subunits, effectors and GPCRs.
Figure 3. Subtype-specific residues and Gα selectivity barcode.
a, Comparing the G protein paralogs alignment with the respective orthologs alignment can disentangle positions involved in shared function (magenta), sub-type specific function (cyan), organism-specific function (white) and under relaxed functional constraint (beige). b, Mapping the data onto the GDP bound conformation of a Gα protein (PDB: 1gp2). c, Mapping the data onto the Gαs –β2AR interface (PDB: 3sn6; βγ). The numbers of residues in each group (β2AR-Gαs interface positions) are shown in the pie chart. d, For the inferred G protein interface positions (CGN system21), the consensus sequence and the nature of the position (conserved, neutral, selective) are shown for each G protein (Gα selectivity barcode).
Selectivity barcode in Gα proteins
By analysing the structures of β2 adrenergic receptor-Gαs, rhodopsin-Gαt peptide and A2A adenosine receptor-engineered Gαs complexes using the Common Gα Numbering (CGN) system21, we identified a total of 25 CGN positions that contact the receptor (Methods). Several of these positions in Gαi mediate an interaction with Rhodopsin as shown through alanine scanning experiments22 (Supplementary Data). We find that the conserved CGN positions form clusters at the receptor-Gα interface (Fig. 3c; Extended Data Fig. 5c; mainly H5 of Gα; also reported in Flock et al.21). In contrast, the subtype-specific positions surround the conserved positions at the interface (Extended Data Fig. 5c) and reside in HN, H4, S1/3 and H5 of Gα in the β2AR-Gαs structure (Extended Data Fig. 6). While the conserved positions at the interface indicate that the binding orientation of the receptor with Gα is similar among different receptor-Gα complexes21, the subtype-specific residues around the conserved core constitutes a “selectivity barcode” to ensure selective binding by the different receptors. In this manner, each of the 16 Gα paralogs presents a unique combination of residues around a conserved interface that might determine selectivity at the receptor-G protein interface (Fig. 3d). We note that different Gα subtypes may undergo rotation and translation of H5 to different extent at the receptor-G protein interface. This may expose additional residues that might contribute to the selectivity barcode.
The Gα selectivity determining positions at the interface show variation in the fraction of charged and hydrophobic residues suggesting that electrostatic contribution and chemical composition of the interface vary between different G proteins. To infer positions near the interface that can influence binding selectivity (i.e. possible pre-coupling sites), we identified surface accessible, selectivity-determining positions that are not part of either the receptor- nucleotide- or effector-binding positions. For this, we analysed all available structures of Gα proteins bound to the nucleotide, βγ or different effectors (Supplementary Data). By integrating evolutionary information, we identified positions in each of the 16 G proteins that might possibly play a role in pre-coupling (Supplementary Data).
Biochemical studies on individual G proteins support the identified positions as determinants of selectivity (Supplementary Table 1). For instance, replacement of the five C-terminal amino acids in H5 (which contain three selectivity-determining positions) of Gαq23 or Gαs24,25 with corresponding residues from Gαi changed the receptor selectivity profile to that of Gαi. Overall, our approach makes use of all available sequence, structural, and comprehensive biochemical data to infer selectivity determinants (“selectivity barcode”) on each of the 16 G protein (Fig. 3d). Using the CGN numbering system, we map this information onto a snake-like diagram for each of the 16 different Gα proteins. We present an interactive web resource that highlights these selectivity determining positions through a user-determined cut-off value. In this manner, researchers can be liberal or conservative in inferring such positions in any human Gα protein of interest.
Recognition of Gα barcode by GPCRs
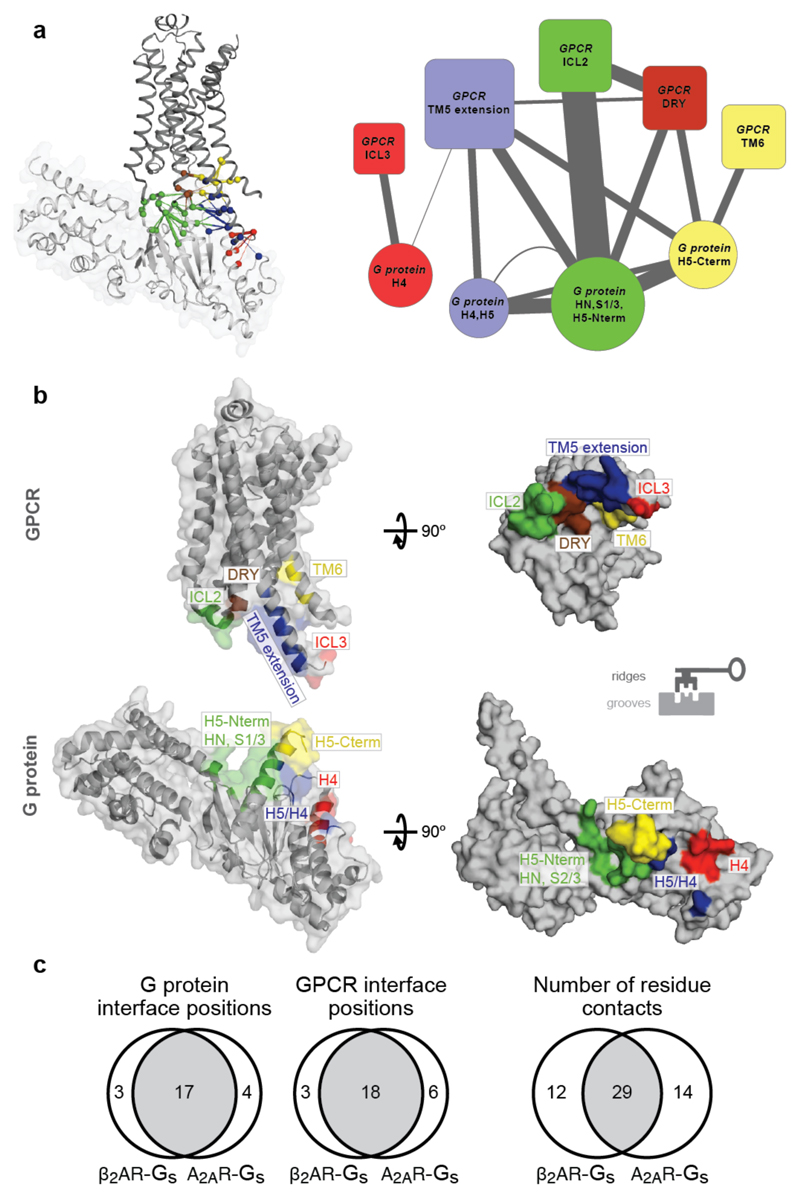
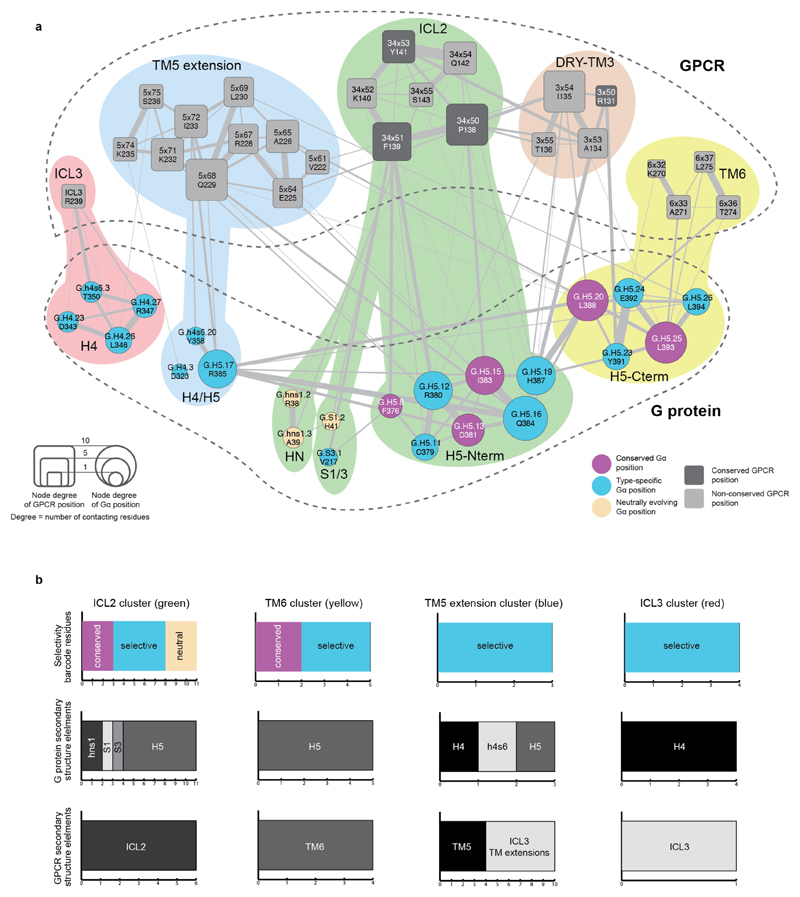
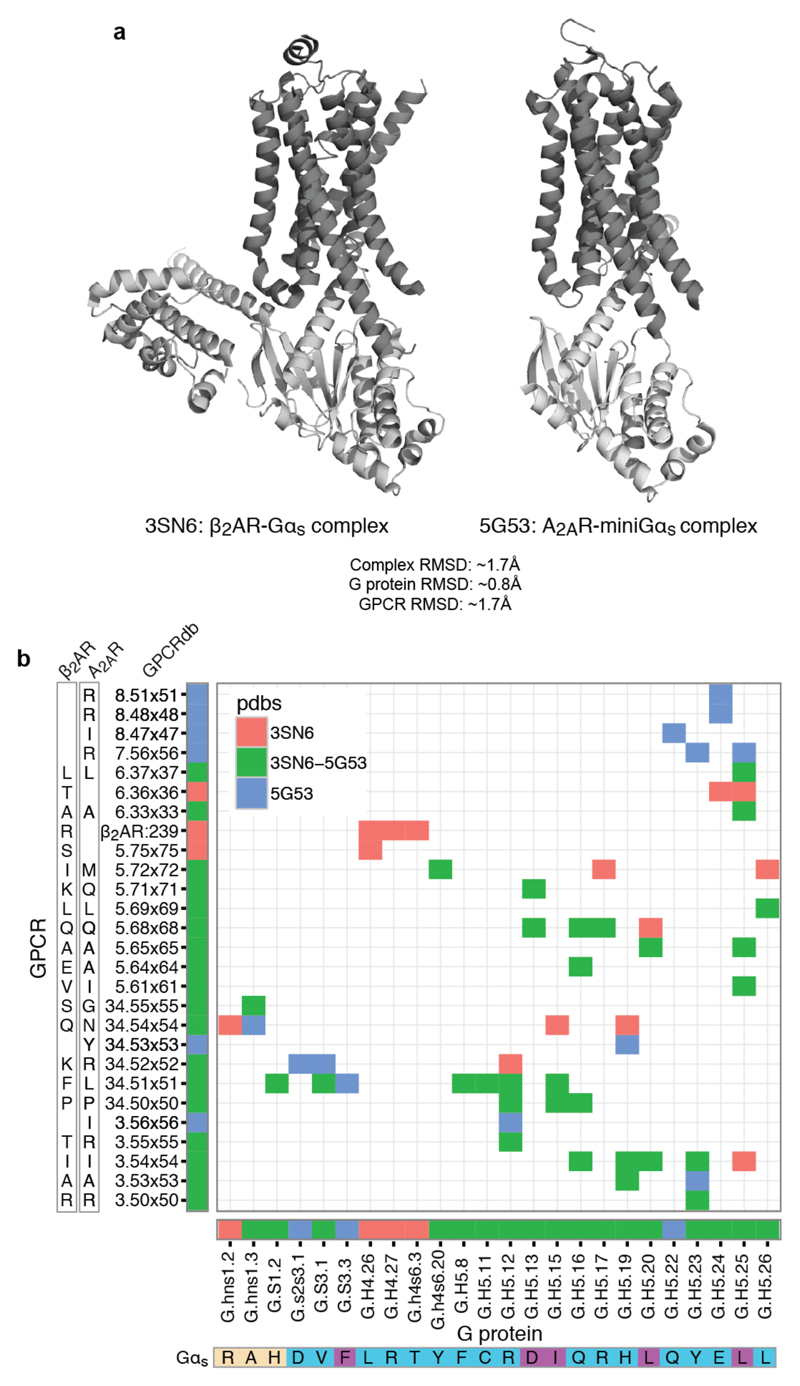
Selectivity in protein interactions is achieved by non-covalent contacts between residues of interacting proteins26. To understand how the receptor might recognise the Gα selectivity barcode, we analysed21,27,28 the inter- and intra-protein non-covalent contact networks of the β2AR-Gαs structure15. We identified spatially distinct clusters of residues on the receptor and G protein that extensively contact each other at the interface (Fig. 4a,b). The Gαs selectivity barcode is primarily contacted by positions in the TM5 extension and ICL3 of the β2AR, with contributions from TM6 and ICL2 (Extended Data Fig. 6a,b). Investigation of the A2A adenosine receptor-engineered mini Gαs structure using the GPCRdb numbering scheme4 (structure-based generic residue numbers) revealed that the binding mode is highly similar to the β2AR-Gs complex (RMSD of equivalent Cα atoms = 1.7 Å) and that equivalent receptor secondary structure elements contact similar regions on Gαs (Extended Data Fig. 7a). Despite this overall similarity in the positions that make the contact, there are significant differences in terms of the exact contacts that these positions make at the interface (Fig. 4c). Thus, while the same positions of the G protein and GPCRs may be involved in the recognition, distinct residues (both positions and the amino acid residue) on the two different receptors contact them (Extended Data Fig. 7b). In other words, the same selectivity barcode presented by Gαs is read differently by receptors belonging to different subtypes. Why do evolutionarily related receptors use different residues to selectively couple to the same Gαs protein?
Figure 4. Residue contacts at the GPCR–G protein interface.
a, (left) Residue contact network of all residues at the β2AR-Gαs interface (PDB: 3sn6). Residues in the different clusters (Methods) are shown in red, blue, green, brown and yellow. (right) Meta-network highlighting the connectivity between the clusters. Node size reflects number of amino acids in the cluster, and edge weight denotes number of residue contacts between clusters. b, Mapping the structure-derived interface clusters shows complementary “ridges” and “grooves” at the receptor-G protein interface. c, Comparison of residues and residue contacts shared between the β2AR-Gs and A2A-Gsmini structures (Extended Data Fig. 7).
GPCR history and selectivity determinants
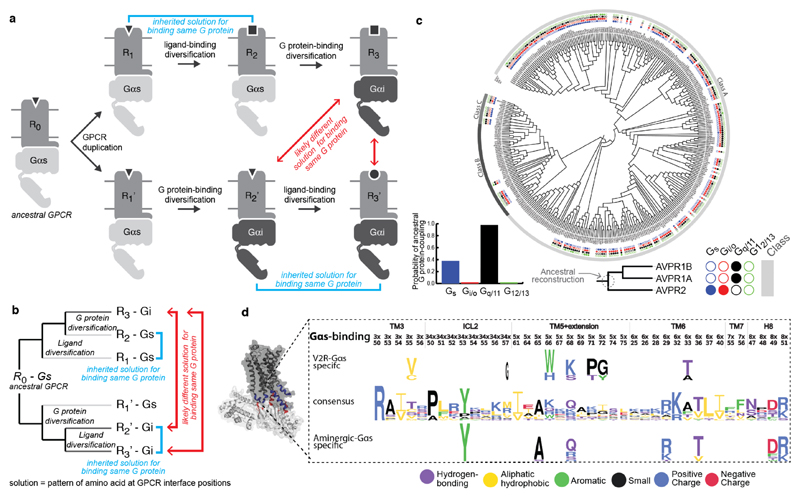
Since GPCRs expanded by gene duplication, we elucidated the scenarios for the evolution of coupling selectivity (Fig. 5a,b). Upon duplication, both GPCR copies are identical and hence will inherit the ancestral receptor properties. During divergence, each duplicate may accumulate mutations such that they: (1) maintain G protein selectivity but alter ligand-binding property (e.g. olfactory receptors), or (2) alter G protein selectivity but maintain ligand-binding property (e.g. adrenergic receptors). In subsequent duplication and divergence events, they may accumulate mutations that might allow binding to a different or additional G protein and/or ligand. Thus, although two extant receptors couple to the same G protein, their evolutionary history can be different. If they inherited their selectivity from a common ancestor, they will share the same or similar set of interface residues that determine G protein selectivity. However, if one of the receptors altered its selectivity from a common ancestor, it is more likely that a different set of interface residues might determine the coupling preference (Fig. 5a,b). Therefore, the evolutionary history of receptors that couple to the same G protein is indicative of whether the selectivity determining positions on the receptors are likely to be similar or different.
Figure 5. Evolutionary history of GPCRs and selectivity determining positions on the receptor.
a, Gene duplication model for the evolution of ligand and G protein selectivity of GPCRs. b, Phylogenetic tree representation of the events in the gene duplication model. c, A phylogenetic tree of human Class A, B and C GPCRs showing the G protein-coupling selectivity of each GPCR (Extended Data Fig. 8). The four dots (filled or empty) depict both primary and secondary G protein coupling. G protein coupling of each ancestral node was reconstructed by considering the primary coupling of the receptors (V2R clade receptors shown as example). d, Sequence pattern (Methods) of the aminergic and V2R-clade interface positions suggests independent accumulation of mutations to couple to Gαs. Various single point mutations in the V2 receptor (no structure available) support that several of these positions are crucial for selectivity (Supplementary Table 1).
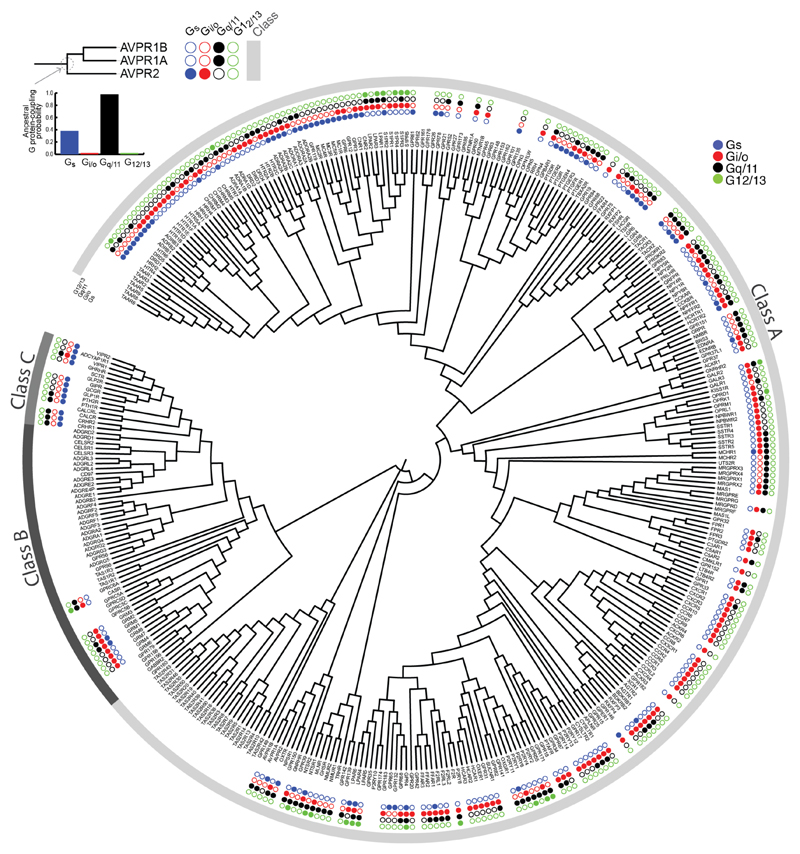
By mapping the G protein coupling data (primary and secondary coupling) onto the phylogenetic tree of human GPCRs, we observed that members of the GPCR subfamily have rewired Gα coupling selectivity from their respective common ancestors on numerous occasions (Fig. 5c; Extended Data Fig. 8; Supplementary Data). Through reconstruction of ancestral coupling selectivity, we conservatively estimate that ~85% of the receptors altered their Gα selectivity at least once during their evolutionary history (Supplementary Data). Consistent with the evolutionary scenario, we did not observe a common sequence pattern in receptors from different families that couple to the same Gα proteins, which is in line with previous studies13. Thus, the receptor selectivity determinants are more complex and dynamic, which is in contrast to the evolutionarily static Gα selectivity barcode. This could also explain why prior studies could only find selectivity patterns for certain related members of a receptor subfamily12,29 (see Supplementary Table 1 for a collection of previous studies), but never a universal sequence pattern for the different receptors.
Revealing receptor selectivity signatures
Using GPCRdb numbering, we identified 33 receptor positions that contact Gα by analysing the β2AR-Gs, A2A receptor-mini Gs and rhodopsin-Gt peptide structures. To consider variations due to receptor conformational dynamics, varying degree of rotation and translation of H5 of Gα between different G protein subtypes upon receptor binding, side-chain differences, and basal activity, we identified 6 additional positions that are proximal and face the G protein and thereby could participate in mediating a contact. The importance of these positions is independently supported by several biochemical studies aimed at understanding selectivity in a few receptors and G proteins (Supplementary Table 1). Consistent with the structural data, the second and third intracellular loop regions of receptors are most frequently associated with the effect of altering coupling selectivity.
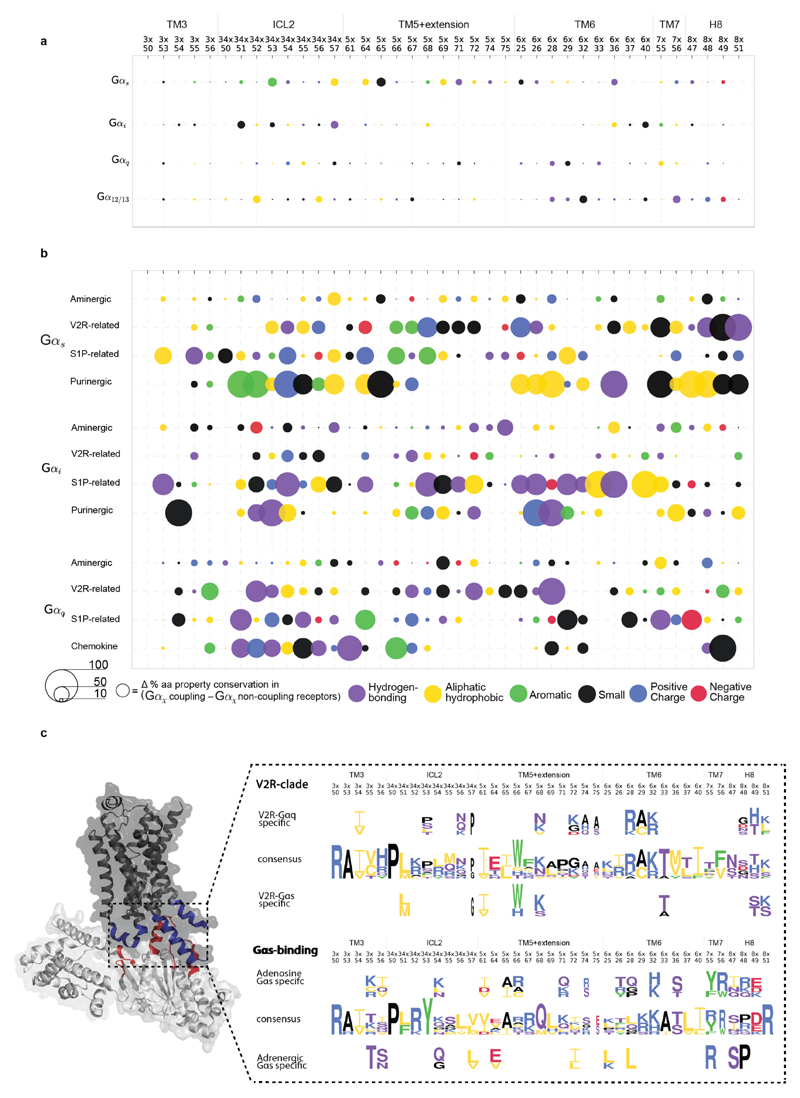
Restricting the analysis to these positions did not reveal any common pattern in terms of the sequence or amino acid properties that is conserved in all GPCRs known to couple to the same G protein (Extended Data Fig. 9a). However, we did observe signatures of amino acid properties at interface positions between evolutionarily related receptors that couple to the same G protein (Methods; Extended Data Fig. 9b). For each of the aminergic, V2R related, S1P related, purinergic, and chemokine receptor groups, we observed distinct signatures in the interface positions among the subset of closely related receptors that can bind a given Gα family compared to those in the same group that cannot (Extended Data Fig. 9b). The selectivity signatures are largely different for the receptor groups, highlighting that receptors from different groups arrived at independent solutions to bind the same G protein. Notably, strong signals appear in ICL2, TM3, TM5-7 and H8, although they are most frequent in ICL2 and rare in TM3. This suggests that by comparing interface positions among groups of related receptors with different coupling properties, it might be possible to pinpoint individual positions at the receptor interface that are not only conserved, but also likely involved in recognizing the Gα protein. For instance, Vasopressin 2 receptor (V2R) and β2–AR (which belong to different subfamilies) both couple to Gαs and have complex evolutionary histories (Extended Data Fig. 8). An analysis of the equivalent interface positions on the receptor that contact the Gα protein shows that V2R independently accumulated a different set of mutations in the same region to selectively couple to Gαs and hence arrived at a different sequence pattern to read the same Gαs selectivity barcode (Fig. 5d; see Extended Data Fig. 9c for examples involving V2R and Adenosine receptors).
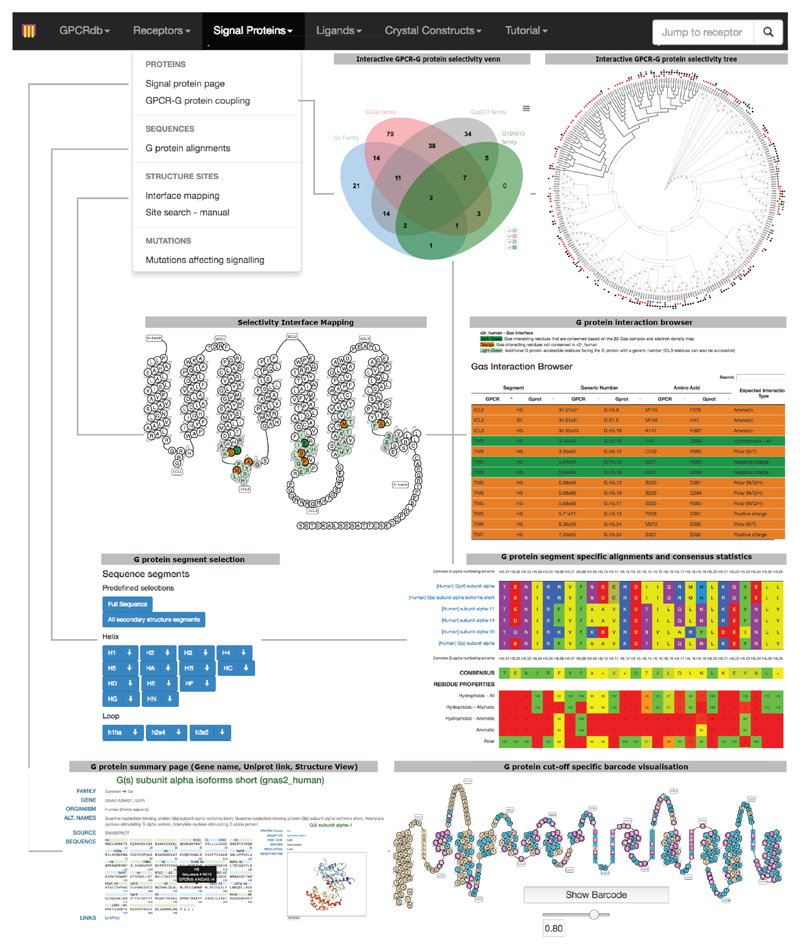
Thus, to understand the receptor binding determinants, it is critical to reconstruct the evolutionary history and investigate the interface positions in the different receptor subtypes. To aid researchers to apply the principles described in this work on any G protein or receptor of interest, we have developed a comprehensive and interactive web resource in GPCRdb30 (top menu item “Signal Proteins” at www.gpcrdb.org; Extended Data Fig. 10). The features provided in the resource, which will be continuously updated, should serve as a guide for biologists interested in uncovering the interface determinants of coupling selectivity for various applications (e.g. protein engineering and structural studies) and understanding the consequences of mutations (e.g. natural variation and disease mutations) in individual receptors.
Discussion
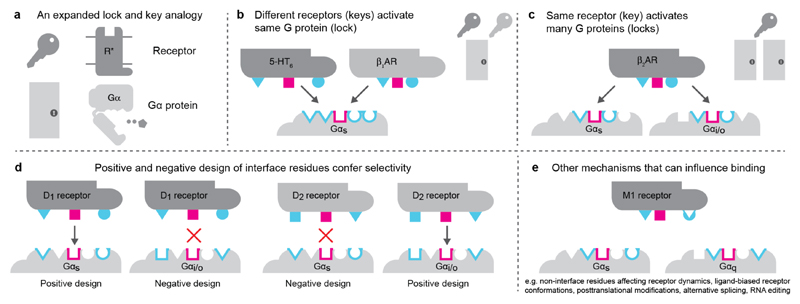
The mechanism of achieving selectivity has a striking analogy where GPCRs are keys, and the G proteins are locks that open different doors (denoting signalling pathways; Fig. 6). Master keys open many doors (i.e. promiscuous GPCRs such as GPR4, Lpar4), and specific keys open a single door (e.g., chemokine and odorant receptors). This information is encoded in the design of the cuts on the key (i.e. patterns of grooves and ridges; GPCR-G protein interface). There are different solutions for designing keys that open the same lock by leaving out or including ‘ridges’ in different combinations. This is seen in GPCRs from distinct subfamilies where different interface positions are subjected to positive and negative discrimination around a conserved core to couple to different G proteins. Where there are typically many more keys (receptors) than doors, the patterns on the lock (G protein) are under higher constraint than the individual keys themselves. This asymmetry in constraints is seen in the GPCR-G protein signalling system, which manifests in a stronger evolutionary signal for selectivity determining positions on Gα compared to the receptors.
Figure 6. Lock and key analogy for GPCR-G protein selectivity.
a, Receptors are analogous to keys and G proteins are analogous to locks on doors. b, Members of different GPCR families can find distinct solutions to bind the same G protein. The conserved core of the interface (magenta) allows for a common binding mode and activation mechanism, while specificity/selectivity is achieved through interaction with some parts of the family-specific G protein barcode residues (cyan). c, Some GPCRs can be promiscuous (master keys) and interact with multiple G proteins (i.e. open multiple locks). d, G protein interface is more static (fixed lock) whereas the GPCR interfaces are more dynamic during evolution. Positive and negative design of the receptor interface positions through mutations may give rise to specificity (i.e. adjusting the cuts of keys so that they only open certain locks but not others). e, Other factors can modify the GPCR interface and binding selectivity.
Receptors with different phylogenetic history might use different sets of residues to read distinct parts of the same Gα selectivity barcode. This combinatorial possibility makes the interface robust to mutations and might facilitate evolvability and fine-tuning of selectivity. While the interface chemistry provides a basis for coupling, the relative expression levels of the receptor or Gα, kinetic scaffolding, intrinsic nucleotide hydrolysis rates of Gα, pre-coupling, post-translational modifications, alternative splicing, RNA editing, and phospholipid and membrane composition can all modulate, fine-tune, alter or even switch selectivity in different contexts. Furthermore, receptor oligomerisation, conformational dynamics, basal activity and ligand-induced changes (functional selectivity) can alter selectivity. Therefore, positions and residues that are not at the interface31, but which can influence any of these factors can also affect G protein selectivity.
From an evolutionary perspective, the asymmetry between the presentation of a rigid Gα barcode and its flexible interpretation by the receptor through a large number of possibilities could have aided the extensive expansion of receptors in different organisms. Such a design of interaction interface could have facilitated the rapid evolution of the GPCR signalling system and contributed to organismal complexity by allowing cells to respond to different stimuli and thereby permitting adaptation to diverse environments. Future studies aimed at providing quantitative understanding of the sequence-dependent binding of receptor-Gα interaction may unravel the extent of lineage specific differences in coupling selectivity and may point to fundamental differences in signalling between different organisms.
Online Content
Methods, along with any additional Extended Data display items and Source Data, are available in the online version of the paper; references unique to these sections appear only in the online paper.
Methods
No statistical methods were used to predetermine sample size. The experiments were not randomised. The investigators were not blinded to allocation during experiments and outcome assessment.
Phylogenetic analysis of GPCR and G protein repertoires
Determination of GPCR and G protein repertoires
The set of 394 annotated human non-olfactory GPCRs was obtained from the IUPHAR/BPS Guide to Pharmacology database (December 2014)32. The full repertoire of GPCRs and G proteins across 13 different organisms that serve as model organisms for the major eukaryotic lineages was determined through identification of relevant 7-transmembrane helix domains families from Pfam33 (see Supplementary Data for the full list of Pfam families). The organisms were Homo sapiens, Mus musculus, Gallus gallus, Xenopus tropicalis, Danio rerio, Branchiostoma floridae, Strongylocentrotus purpuratus, Drosophila melanogaster, Caenorhabditis elegans, Nematostella vectensis, Trichoplax adhaerens, Capsaspora owczarzaki, Monosiga brevicollis. In order to obtain the number of unique GPCRs and G proteins in each organism, protein sequences were retrieved through the Pfam API and subsequently mapped to their unique gene identifiers using Uniprot34. Olfactory, taste and odorant receptors were identified through uniquely conserved sequence profiles that are used in Pfam. We compared the patterns in the alignments of all known human olfactory receptors and other human Class A receptors using Spial35. The gene numbers provided here offer an update to previous estimates of the GPCR repertoire in some of these organisms2,17,36
Determination of sequence relationships of GPCR and G proteins across different organisms
Phylogenetic relationships and orthologous sequences were collected from the Orthologous MAtrix (OMA) database37 and EnsemblComparaGeneTrees (Compara)38 using R and Python scripts written in-house. Two independent approaches were used to identify phylogenetic relationships: (a) a stringent definition of orthology as used in OMA and (b) using a bi-directional best-hit method implemented using Jackhmmer39. For OMA orthologs, a Python script using the OMA SOAP API (12 July 2015, database version Sep 2014)37 and Compara database38 was used to obtain phylogenetic relationships. OMA had ortholog data for 361 human GPCRs; a list of missing receptors is given as Supplementary Data. For the Jackhmmer orthologs, a Perl script was written to identify the best hits between sequences from the repertoires of the 13 different organisms. Using both measures allowed us to ensure that the general trend of diversification of the GPCR repertoire, compared to the G protein repertoire reported in the paper, is independent of the method used to detect phylogenetic relationships between sequences.
Calculation of a modified Jaccard similarity index
We computed the Jaccard similarity index (range: 0 to 1) defined as the number of conserved genes (overlapping) divided by the total number of genes that code for GPCRs or G proteins, respectively. To identify the overlap of the GPCR and G protein repertoires in different organisms, genes in different organisms were annotated as having a phylogenetic relationship if they had a hit in the human/organism repertoire with Jackhmmer (this includes many-to-one orthologs and hence multiple proteins being related to the same protein in the other organism, to account for gene expansion events). A high value (closer to 1) means that the two organisms largely share the GPCR/G protein repertoire. A lower value (closer to 0) means that the repertoires are more distinct. The observation that the modified Jaccard similarity index is higher for Nematostella vectensis and Trichoplax adhaerens compared to Drosophila melanogaster, Caenorhabditis elegans is reflective of the fact40,41 that the common ancestor had a complex repertoire of GPCRs and G proteins, which were independently lost in the nematode and insect lineages. Similarly, the large number of distinct sequences in the different organisms for which orthologs do not exist in human, suggests that each lineage has independently undergone expansion of the GPCR repertoire through gene duplication events.
Determination of an approximate phylogenetic age of human GPCRs and G proteins
In order to extend the repertoire analysis of 13 key organisms, GPCR and G protein homologs from 215 organisms were analysed using the OrthologMAtrix(OMA) API37. To estimate the ‘age’ of every human GPCR and G protein gene, the age of each of the 215 organisms was determined by extracting the branch length to human from the OMA species tree using the R package ‘ape’42. The ‘oldest’ (longest branch length to human) organism that has an ortholog to the human GPCR or G protein was used for the age estimation of each gene. Both definitions of orthology (1:1 orthology and any type of orthology) were used (see Extended Data Fig. 4a).
Identification of G protein selectivity barcode
Construction of Gα protein paralog alignment
The human Gα protein paralog alignment and the 16 Gα protein ortholog alignments were constructed as described previously in Flock et al.21. Briefly, all relevant human Gα protein isoforms and variants were obtained from Ensembl38 using R. The ‘canonical’ protein sequences for each of the 16 human Gα genes, as defined by Uniprot34, were used as representative sequences for each human Gα gene. The sequences were aligned using Muscle45 and were manually refined using the consensus secondary structure as a guide. The alignments of orthologs for each of the 16 trees, ordered by the species tree, are available as Supplementary Data. This can be visualised using standard sequence alignment software tools to infer when a particular position was fixed during organismal evolution.
Ortholog alignments of one-to-one Gα orthologs of 16 human Gα genes
Phylogenetic relationships of Gα sequences were collected from TreeFam43, the Orthologous MAtrix (OMA) database37 and EnsemblComparaGeneTrees (Compara)38 using R scripts. Compara had the highest fraction of complete Gα sequences for each human Gα gene, except for Gαs for which OMA had a better sequence coverage. In total, 973 genes from 66 organisms were used, of which 773 were one-to-one orthologs. To build an accurate, low-gap alignment of such a large number of sequences, 16 independent orthologous alignments for each human Gα gene were first created by aligning one-to-one ortholog groups using the PCMA algorithm44 followed by manual refinement. Subsequently, each ortholog alignment was cross-referenced to the Common Gα Numbering system (CGN21) by referencing its respective human sequence to the human paralog alignment.
Inferring positions under different functional constraints in G proteins
For each of the 16 human G proteins, the ortholog alignment was obtained (see above) and the sequence identity for every position in the alignment (CGN numbering system) was computed. The sequence identity of each position in the 16 human Gα protein paralogs alignment was also computed. For each of the 16 Gα protein paralogs, the sequence identity of the ortholog alignment was plotted against the human paralogs alignment (Extended Data Fig. 5a). To infer positions that are under differential functional constraints (Fig. 3a; highly conserved residues, sub-type specifically conserved, neutrally evolving residues and paralogs-specifically conserved positions)20 for a G protein, the 16 Gα ortholog alignments were first cross-referenced to the paralog alignment using the CGN numbering system. Here, we used a conservative cut-off (Supplementary Data; The user has an option to change the cut-offs to identify such positions in any G protein through the GPCRdb resource; e.g. for GNAS2 http://www.gpcrdb.org/signprot/gnas2_human/). This led to the identification of residue positions in the alignment for each of the 16 G proteins that are (a) conserved in paralogs and orthologs of a subtype (universally conserved position; at least 80% conservation among the orthologs and the paralogs), (b) conserved among the orthologs of a Gα subtype but variable among the human paralogs (selectivity determining residue; 80% conservation among the orthologs but less than 80% conservation among the paralogs), (c) variable among the orthologs and paralogs alignments (neutrally evolving positions; less than 80% among orthologs and less than 80% among paralogs), or conserved in the paralog alignment but not in the ortholog alignment (species-specific positions; more than 80% conservation among the human paralogs but less than 80% among the respective orthologs). For G15 in Fig. 3d, position G.H5.25 is shown as L since the conservation was close to the 80% cut-off and was either V or I in the homologs. We also provide pre-computed barcodes using different cut-offs as Supplementary Data.
We also employed a multi-dimensional scaling approach (hierarchical clustering) to map the ortholog/paralog conservation scores for each of the 16 G proteins onto a single prototypical G protein. For every CGN position in the alignment, a 17-dimension vector was computed, where the value of the first 16 dimensions denotes the % conservation of that position among the orthologs for each G protein. The value of the last dimension denotes the % conservation of that position among the human G protein paralogs. Through hierarchical clustering (dissimilarity measure Pearson correlation with complete linkage), the above-mentioned conservation types were determined without relying on conservation cut-offs. This cut-off free approach revealed the existence of CGN positions that (a) evolve in a neutral manner, (ii) evolve in a sub-type specific manner and (iii) are conserved (Supplementary Figure). However, the mapping of this information based on the CGN position (i.e. to a single prototypical G protein) means that all the 16 G protein members have the same number of positions that are selectivity determining, conserved or neutrally evolving. To account for variation in the number of such sites between the different G protein members, we present the barcode in Fig. 3d using conservative cut-offs described above. As it is not possible to identify a single cut-off to differentiate such positions, we provide the readers/users with the opportunity to choose their own cut-offs in the GPCRdb web resource for identifying such positions for each of the 16 Gα proteins (e.g. for GNAS2 http://www.gpcrdb.org/signprot/gnas2_human/). In this manner, researchers can be liberal or conservative in inferring such positions in any human Gα protein of interest.
Identification of G protein positions and GPCR positions that mediate binding at the interface
The inter GPCR-G protein residue contact network (RCN) was computed for the β2AR-Gs (PDB: 3sn6), A2A- Gsmini (PDB: 5g53) and Rhodopsin-Gt-C-peptide (PDB: 2x72, 3dqb, 3pqr, 4a4m) structures using van der Waals contacts between atoms, as described earlier in Venkatakrishnan et al27. By using the CGN system21 and the GPCRdb numbering scheme30, we identified 25 CGN positions and 34 GPCR positions that participate in non-covalent contacts at the interface. To identify positions near the interface that may influence binding (potential pre-coupling sites on G proteins and G protein accessible sites on receptors), we adopted the following strategy. For the pre-coupling sites, we first identified surface accessible CGN positions on the G domain of the Gα protein (inferred using the inactive, GDP bound Gα structure; PDB: 1gp2) that are subtype specifically conserved and that do not map to βγ–, nucleotide- or effector-binding positions, but are known to experimentally affect receptor binding. For this, we computed the RCNs for all available structures (over 50 structure) of Gα proteins bound to the nucleotide, βγ and different effectors and annotated every CGN position (i.e. whether they interact with βγ–, nucleotide- or effector). For positions that are known to affect receptor binding, we made use of the quantitative experimental data on Gαi binding to rhodopsin upon mutating every residue to alanine22. This master table (Supplementary Data) resulted in the identification of further 4 sites that might constitute potential pre-coupling sites. To consider variations due to receptor conformational dynamics, side-chain differences and basal activity, we identified G protein accessible sites on the receptor. These were identified as 6 additional positions that are proximal (5 Å distance) and face the G protein and thereby could participate in mediating the interaction.
Mapping of selectivity barcode onto G protein structure and alignment visualisation
The role of every position on Gαs was mapped onto the protein structure using customised R scripts and PyMol (colour code: magenta for highly conserved; cyan for selectively conserved in Gαs; beige for neutral evolving). The consensus sequence of each ortholog and the paralog alignment was determined and displayed in an ‘alignment of consensus sequences’ for the identified Gα interface positions for all the 16 protein families, which was used for visualisation of the barcode (Fig. 3d). The accessible surface area (ASA) of PDB: 1gp2 (Gαi) was obtained from the PDBe PISA (Proteins, Interfaces, Structures, and Assemblies)45 XML repository and normalised by the accessible surface area for each residue position46 to obtain the relative accessible surface area for each residue. The boxplot (Extended Data Fig. 5b) was created with ggplot2 and the significance level (given as p-values) was determined using the non-parametric Mann–Whitney test.
Characterisation of GPCR-G protein interface
Non-covalent contact and network analysis
The inter GPCR-G protein residue contact network (RCN) for the β2AR-Gs (PDB: 3sn6) and A2A- Gsmini (PDB: 5g53) structures was computed using van der Waals contacts between atoms, as described earlier in Venkatakrishnan et al27. For 2D visualisation, the RCN of β2AR-Gs was exported to Cytoscape47 using the RCytoscape interface48. Based on prior approach28, we determined connected interface clusters from the inter GPCR-G protein RCN by applying the Glay community clustering algorithm49, which is implemented in the Cytoscape through the plugin Cluster Maker50 (parameters: undirected edges). To test the robustness of the clustering approach, clustering was repeated using different edge weights (side-chain contacts only and weighting side-chain contacts by factor of 2), which did not affect the overall organisation of the identified clusters. To generate the contact network between the different interface clusters, the sum of all residue contacts between each cluster was calculated in R and visualised in Cytoscape (Fig. 4a). For 3D visualisation of the clusters mapped onto the 3D network of the GPCR-G protein complex, customised R scripts were used to create a RCN in PyMol by creating pseudo PDBs that show residues as spheres from their C-alpha atoms and lines/edges between them via the CONECT entries (using PDB: 3sn6; Fig. 4a). Customised R scripts were written to integrate the G protein barcode (sequence analysis; Fig. 3) with the structural interface clusters (β2AR-Gs structure analysis; Fig. 4a,b) based on¨the CGN numbering to generate Extended Data Fig. 6a. The node degree was determined with the NetworkAnalyzer Plugin51 in Cytoscape47. For the comparison of the β2AR-Gs and the A2A- Gsmini interface, the RCNs were compared using the GPCRdb numbering for the receptor and the CGN for the G protein. This allowed us to identify positions and contacts that were shared and that were unique for the two complexes (Fig. 4c and Extended Data Fig. 7a,b).
Phylogenetic tree of GPCRs and mapping of G protein coupling data
Phylogenetic tree of GPCRs
GPCR sequence alignment was constructed for each GPCR Class (A, B and C; defined in the Guide to Pharmacology/IUPHAR database; sequences retrieved through IUPHAR API using a Python script). Initial alignment within each class of GPCRs was made using MSAProbs52 which was further manually adjusted using the GPCRdb numbering4 as a guide. Furthermore, alignments within classes were trimmed by removing N- and C- terminal overhanging residues and large insertion in ICL3 beyond first ten to fifteen residues. As a cross-class alignment was not straightforward due to the low sequence similarity across GPCR classes, a structure alignment of the highest resolution structure of each GPCR class was used to cross-align the individual GPCR Class alignments. The structure alignment was constructed using Mustang53 with 4EIY (aa2ar_human) and 4BVN (adrb1_melga) representing Class A, 4K5Y (crfr1_human) representing Class B, and 4OO9 (grm5_human) representing Class C. First this structural alignment was integrated manually with the already generated Class A GPCRs alignment and then sequentially Class B and Class C alignments were also integrated manually to get a cross class “super alignment” (CCSA). The CCSA was validated against a recent cross-GPCR-class structural alignment4. Using the CCSA GPCR alignment, we first built an approximate maximum-likelihood (ML) phylogenetic tree using FastTree54 and this was used as initial starting tree for the final ML tree generation using MEGA755.
Mapping of G protein coupling data
G protein-coupling data and GPCR classifications were retrieved from the IUPHAR/BPS Guide to Pharmacology (May 2016)56 SQL database as described above. R was used to prepare the coupling data for visualisation as concentric circles in the phylogenetic tree (Fig. 5c; Extended Data Fig. 8) using the latest version of iTol (version 3)57. In order to investigate sequence composition, sequence conservation, and searching for physiochemical and sequence pattern, the GPCR and G protein alignments were analysed in R using the bio3d58 and ape packages42.
Phylogenetic reconstruction of G protein coupling selectivity of ancestral GPCRs and quantification of rewiring events
To reconstruct the most likely ancestral GPCR coupling profile across all the clades of the final ML tree of human GPCRs, the Gα–GPCR coupling data was mapped on to the CCSA as described above. We first created a “coupling profile” for each receptor using the coupling information (from IUPHAR database). The profile is a vector of 4 dimensions (Gs, Gi/o, Gq/11, G12/13) and takes the value 1 (couples) or 0 (does not couple) in each dimension. By considering this as the “trait” for each receptor, we integrated the data with the final ML tree to generate ancestral coupling probability values using BayesTraits V 2.059 (http://www.evolution.rdg.ac.uk/BayesTraits.html). For each clade in the ML tree, we used the montecarlo simulation (mcmc) option with 100,000 trials in BayesTraits, to obtain probabilities of ancestral coupling tendency for each of the four Gα families. These ancestral coupling probability values were converted into a binary format i.e. “1” and “0”, where “1” indicates ancestral coupling to the given G protein and “0” indicates absence of such coupling. We assigned the value “1” to the ancestral node if the coupling probability was greater than or equal to 0.7. Otherwise we assigned the value “0”. This information was then converted into a “coupling profile” for each ancestral node in the tree, similar to the above-mentioned individual GPCR coupling profiles. Then for each GPCR, and the clade to which a given receptor belonged to, we required that: (i) the clade should contain 30 or fewer GPCRs (so that we investigate an ancestral receptor that is not very recent nor ancient) and (ii) ancestral coupling probability of the ancestral node as well individual receptors within the clade had coupling information (i.e. should not have all 0s in their profile). Through a custom written Perl script, we traversed the ML tree. We considered that a given GPCR has an altered coupling tendency compared to one of its ancestral receptor’s coupling tendency if there was a mismatch in their coupling profiles. The number of such instances was recorded and used to infer the fraction of receptors that have altered their coupling selectivity during their evolution.
Receptor selectivity pattern identification
The aminergic, purinergic, chemokine, S1P-related and V2R-related receptors (Extended Data Fig. 9) were selected as representative evolutionarily related receptor groups. The receptors in the different groups include (i) Purinergic cluster: P2RY1, P2RY2, P2RY4, P2RY6, P2RY11; (ii) V2R-related cluster: V1Br, V1AR, V2R, OXYR, NPSR1, GNRHR, PKR1, PKR2; (iii) S1P-related cluster: CNR1, CNR2, LPAR1, LPAR2, LPAR3, S1PR1, S1PR2, S1PR3, S1PR4, S1PR5; (iv) Chemokine cluster: CCR9, CCR7, CCR10, CXCR4, CXCR6, CCR6, CXCR3, CXCR5, CXCR2, CCR3, CCR1, CCR5, CCR2, CCR4, CCR8, CX3C1, XCR1, CXCR1; (v) Aminergic cluster: 5HT1A, 5HT1B, 5HT1D, 5HT1E, 5HT1F, 5HT2A, 5HT2B, 5HT2C, 5HT4R, 5HT5A, 5HT6R, 5HT7R, ACM1, ACM2, ACM3, ACM4, ACM5, ADA1A, ADA1B, ADA1D, ADA2A, ADA2B, ADA2C, ADRB1, ADRB2, ADRB3, DRD1, DRD2, DRD3, DRD4, DRD5, HRH1, HRH2, HRH3, HRH4, TAAR; (vi) Adrenergic cluster: ADRB1, ADRB2, ADRB3; (vii) Adenosine cluster: AA1R, AA2AR, AA2BR, GP119. Structure-based sequence alignments, conservation statistics and residue property features for every receptor position of these groups were collected through the GPCRdb API (http://gpcrdb.org/services/reference/)4,30 using Python scripts. Residue property groups associated with a certain type of molecular interaction were defined as in GPCRdb4,30 [small: A, C, D, G, N, P, S, T, V; aromatic: F, W, Y, H; aliphatic-hydrophobic: A, V, I, L, M, C, P; positive charge: H, K, R; negative charge: D, E; hydrogen-bonding: D, E, H, K, N, Q, R, S, T, W, Y). Interacting receptor positions were identified as described above. For each receptor group, we calculated the molecular property signatures (Extended Data Fig. 9) for their ability to couple to a particular G protein family by comparing the subsets of coupling and non-coupling receptors within the group, respectively (primary and secondary coupling data from the IUPHAR/BPS Guide To Pharmacology database). Each signature is composed of a unique combination of residue positions with distinct conservation (% in Gαx coupling - % in Gαx non-coupling receptors) of residue properties at each position. This calculation was performed using the pandas Python library (http://pandas.pydata.org/). Selectivity signatures of residue properties were visualised using matplotlib (http://matplotlib.org/). Investigations of sequence patterns, selectivity determinants and sequence conservation (Fig. 5d and Extended Data Fig. 9c) were performed using the Spial (http://www.mrclmb.cam.ac.uk/genomes/spial/) web server35 and visualised by WebLogo356. The parameters used for generating Fig. 5d and Extended Data Fig. 9c in Spial are a conservation cut-off of 0.1, specificity cut-off for V2R-clade panel: 0.25 and Gs-binding panels: 0.50.
Webserver to investigate GPCR-G protein interface
Use of common residue numbering systems to compare GPCR and G protein positions
In order to make the findings presented here applicable to any G protein and GPCR (Extended Data Fig. 10), the CGN numbering system (CGN webserver: http://www.mrc-lmb.cam.ac.uk/CGN)21 and the GPCRdb numbering system (http://gpcrdb.org)4,30 were used throughout this manuscript.
G protein information and alignments
For each G protein, a page with sequence data, structural information and snake-like diagram visualisations is given (protein or sub-family selection via http://www.gpcrdb.org/signprot/). Sequence information of all human G proteins and orthologs thereof has been incorporated into the GPCRdb to allow for segment specific alignments according to the CGN system. Additional conservation statistics for several amino acid properties and a consensus sequence are shown. Predefined-sets for e.g. the selectivity barcode or allosteric binding domains are provided for easy access. Furthermore, a site search tool has been added that allows user to manually define a site (positions and amino acid sets therein) and match it to the alignments to retrieve the receptor profile that shares the given site. Furthermore, the interface positions as well as neutral, conserved and selectivity determining positions can be mapped on each G protein snake-like diagram and adjusted by a user-defined identity conservation cut-off (e.g. as shown in Extended Data Fig. 10). This allows users to investigate and scrutinize each position in any human Gα protein of interest.
G protein-coupling properties of human GPCRs
The G protein-coupling data from the Guide to Pharmacology/IUPHAR database as described above, is presented in a Venn diagram (http://www.gpcrdb.org/signprot/statistics) and a phylogenetic tree – both displaying the sets of receptors that couple to the different (sets of) G proteins. Intersections and nodes, respectively, can be selected to retrieve specific receptor (sub)sets of the whole GPCRome or subclasses for further analyses, such as structure-based sequence alignment (e.g. Gαs interface residue alignment) or phylogenetic (sub)trees.
Gα interface mapping of selected receptors
To analyse and infer potential selectivity determining residues for any receptor, we provide a comprehensive analysis tool (http://www.gpcrdb.org/signprot/ginterface)4,30 that allows researchers to map a selected receptor, using NC-IUPHAR receptor nomenclature, onto the determined Gα interface. The generic residue positions from the Gα interface and G protein accessible residues are visualised by a snake–like diagram of the selected receptor residue topologies and an interaction browser, for which conserved and non-conserved interactions are depicted. G protein interacting receptor positions were defined as described above (see Receptor selectivity pattern identification). G protein accessible receptor positions were defined as those within 5 Å of and facing the G protein in the structure complexes of: β2-Gs, A2A-Gmini, Opsin-β-arrestin and Opsin-Gt (complete G protein superposed to the peptide fragment), and therefore potentially able to form interactions in an alternative, more proximal binding mode of the G protein. This led to the identification of 33 G protein contacting residues and 6 additional G protein accessible residues.
Extended Data
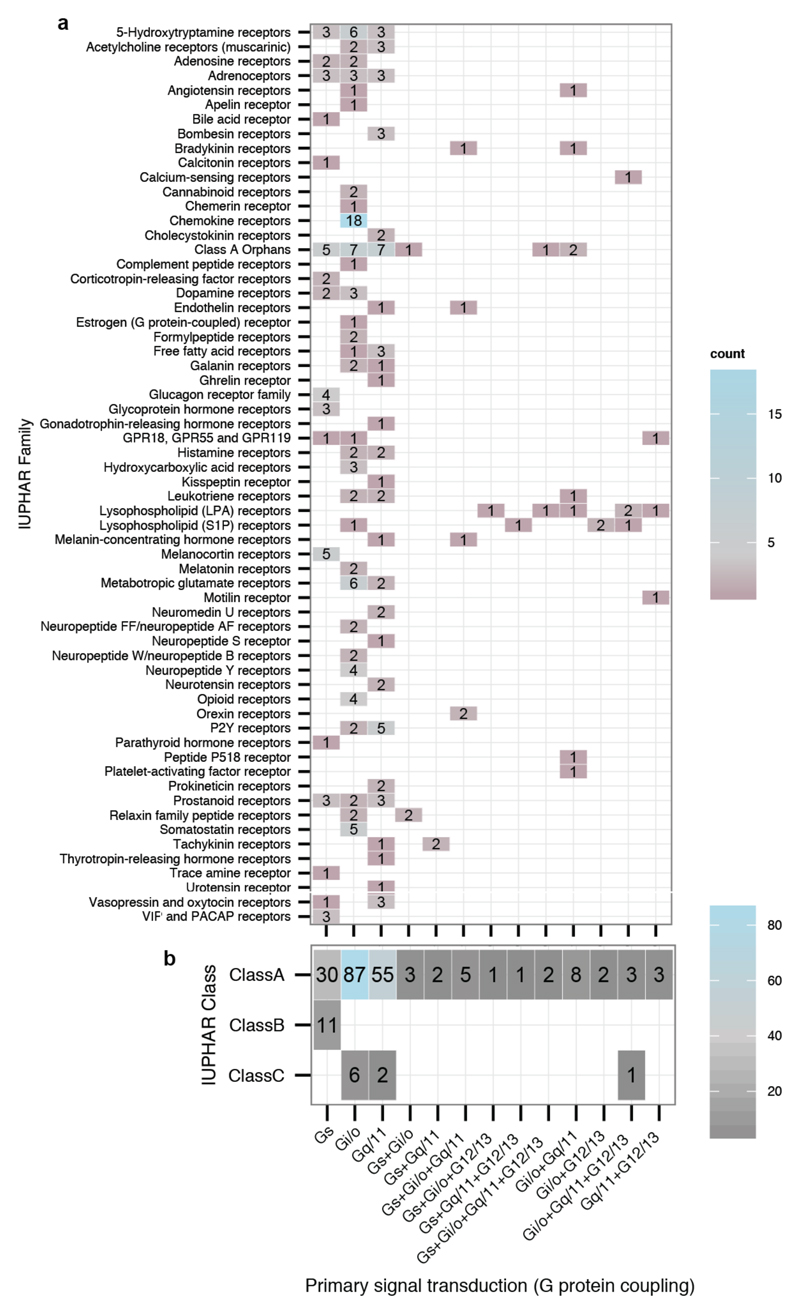
Extended Data Figure 1. G protein-coupling properties of human GPCRs.
a, Number of GPCRs with distinct primary signal transduction (G protein-coupling) for each GPCR family as annotated in the IUPHAR/BPS Guide to Pharmacology database (GtoPdb). Only ‘primary transduction’, as defined by the database, is shown here. Note that Fig. 1c and Fig. 1d show both primary and secondary coupling. b, Number of GPCRs with distinct primary signal transduction properties grouped by GPCR class.
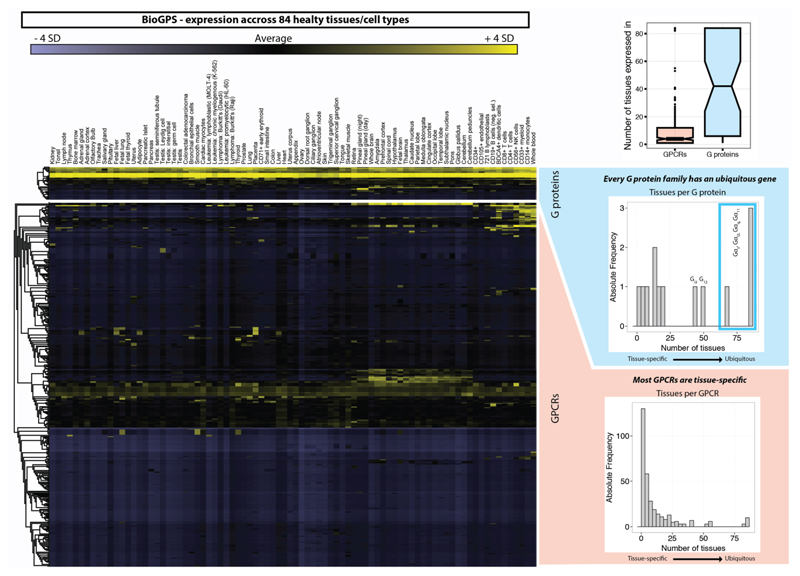
Extended Data Figure 2. Gene expression profile of human GPCRs and G proteins.
The gene expression level (transcriptome) of human G proteins (top) and GPCRs (bottom) across 84 healthy tissues or cell types is shown. The right insets show histograms of the number of G proteins (blue) or GPCRs (red) that are expressed in one or multiple tissues. This highlights that at least one member of each G protein subfamily (Gs, Gi/o, Gq/11, G12/13) is ubiquitously expressed in all tissues. Other subtypes such as the Gt proteins are more tissue-specific. GPCRs on the other hand appear much more tissue-specific and are only expressed in single or few tissues, except for some ubiquitously expressed GPCRs such as chemokine receptors. Normalized expression data was derived from BioGPS (http://biogps.org).
Extended Data Figure 3. Asymmetric evolution of GPCR and Gα protein repertoires.
a, The GPCR and Gα protein repertoires (unique genes) across 13 representative organisms determined using Pfam domain annotations (see Methods and Supplementary Table). The number of Class A receptors slightly differs from the IUPHAR/BPS Guide to Pharmacology database as Class A taste receptors are classified as a separate Pfam family. b, Illustration of the lineage-specific expansion and differentiation of the GPCR and G protein repertoires during evolution. The numbers of G proteins and GPCRs are shown for Capsaspora owczarzaki (an early-branching unicellular sister group of metazoans), Trichoplax adhaerens (one of the oldest known multicellular organism), and humans.
Extended Data Figure 4. ‘Phylogenetic age’ of human GPCRs and Gα proteins.
a, Estimation of the ‘phylogenetic age’ of human GPCRs and G proteins by identifying the most distant one-to-one orthologs (dark grey) or any ortholog (light grey) from 215 organisms in the OMA (Orthologous MAtrix) database. The ‘phylogenetic age’ was determined by the branching times of human and the oldest organisms that share either a 1-1 ortholog or any ortholog (one-many or many-one or many-many) with the human gene (Methods). The classification of GPCRs follows the IUPHAR receptor classification. b, Complete table of the GPCR and G protein repertoire and the phylogenetic ‘overlap’ of the protein repertoires. Jaccard Similarity Index (Methods) for the GPCR and G protein repertoires in the 12 completely sequenced genomes from the different eukaryotic lineages. The subscript U and S for organisms A and B refer to the number of unique and shared genes, respectively.
Extended Data Figure 5. Conservation of residue positions among orthologs and paralogs in Gα proteins.
a, Jitterplots showing the degree of sequence conservation (sequence identity) of each CGN (common G protein numbering) position in Gα proteins. The plots show the degree of conservation in each one-to-one ortholog alignment for each Gα subtype versus the conservation of the human paralog alignment (alignments are provided as Supplementary Data and can be visualised to identify which amino acids were fixed at what time points during evolution). b, The boxplot shows the distribution of the relative accessible surface area of residue positions in each group for Gs (PDB: 1gp2). c, The conserved positions at the interface of the β2AR-Gs (PDB: 3sn6) form central clusters (magenta) and tend to be surrounded by selectivity determining positions (blue). The average distance among positions are: conserved-to-conserved: 9.84 Å; conserved-to-specific: 11.23 Å; specific-to-specific: 12.20 Å.
Extended Data Figure 6. Integration of sequence and structure-derived information to understand how GPCRs read the G protein selectivity barcode.
G protein selectivity barcode (Fig. 3d) mapped onto the GPCR-G protein interface clusters obtained using the β2AR-Gs complex structure (Fig. 4; Methods) highlights which regions of the GPCR contact selectivity-determining residues on the G protein. Nodes represent GPCR (rounded squares) and G protein (circles) positions. The edges and their width represent the number of atomic contacts between residues. The size of the nodes is relative to their node degree (number of contacts to other nodes; which is a measure of how central a node is). Residues within the cluster are grouped and coloured differently in the background (red, blue, green, brown and yellow). b, Statistics highlighting the results from integrating the G protein barcode analysis (sequence-based analysis) with the structural clustering analysis (structure-based analysis). The number of residues in Gαs with a particular sequence conservation property in each cluster (i.e. universally conserved, neutrally evolving, selectivity determining position) is shown. The number of residues that map to the different GPCR and G protein secondary structure elements are shown for both GPCR and G protein based on the β2AR-Gs complex structure (PDB: 3sn6).
Extended Data Figure 7. Comparison of the interface contacts and the contacting residues between β2AR-Gs and A2AR-mini Gs.
a, Comparison of the overall structure of both complex structures shows that the two receptors bind the G protein in a similar binding mode. RMSD values are provided in the figure. b, Detailed comparison of the residue contacts between equivalent positions of β2AR and A2AR receptor with equivalent positions of Gs and the mini-Gs construct used to obtain the complex structures. The exact residue and the GPCRdb numbering scheme for the receptor and the CGN system for the G protein are shown on the axes. Contacts (coloured cells in the matrix) and positions (horizontal and vertical coloured bars next to the axes) that are common or unique to the β2AR or A2AR Gs complex are shown in different colours. The G protein selectivity barcode as in Fig. 3 is shown in the bottom of the matrix. This analysis suggests that while the same positions of the G protein and GPCRs may be involved in the recognition, distinct residues (both positions and the amino acid residue) on the two different receptors contact them. In other words, the same selectivity barcode presented by Gαs is read differently by receptors belonging to different sub-types.
Extended Data Figure 8. Phylogenetic tree of GPCRs and mapping of ancestral reconstruction of coupling selectivity.
A phylogenetic tree of human Class A, B and C GPCRs was derived from a full-length GPCR multiple sequence alignment that was created in-house (Methods). Concentric circles illustrate the G protein-coupling selectivity of each GPCR: the four dots depict both primary and secondary G protein coupling (from inside to outside: Gs, Gi/o, Gq/11, G12/13). The inset on the top left shows a magnification of one clade in the phylogenetic tree. G protein coupling of each ancestral node was reconstructed by considering only the primary coupling of the receptors (Methods).
Extended Data Figure 9. Selectivity patterns at the GPCR-G protein interface.
a, Using the phylogenetic history to define receptor clades with a common ancestor uncovers distinct conserved properties of amino acids at specific interface positions on the receptor. The figure shows molecular property signatures (ability of residues at a given G protein interface position to mediate a distinct type of molecular interaction) on the intracellular interface of GPCRs. Each circle represents a property (coloured) and its distinctiveness (sizing) within the receptors that couple to the given G protein subtype (vs. those that do not). There is no conserved sequence pattern in all the receptors that couple to the same Gα protein. b, Receptors that form a phylogenetic clade exhibit distinct molecular property signatures (Methods). The legend (bottom) shows the colour scheme used for amino acids with different properties. c, Sequence pattern determined by Spial (Methods) of the interface positions (left). (top) V2R-clade and βARs (which belong to different groups) both couple to Gαs. However, the common ancestor of the V2R related receptor coupled to Gαq (suggesting alteration of selectivity) whereas the common ancestor of aminergic receptors coupled to Gαs (suggesting inheritance of selectivity). An analysis of the equivalent interface positions on the receptor that contact the Gα protein shows that V2R independently accumulated a different set of mutations in the same region to selectively couple to Gαs and hence arrived at a different sequence pattern to read the selectivity barcode on Gαs. (bottom) Adenosine-clade and βARs (which belong to different groups) both couple to Gαs and have complex evolutionary histories (Extended Data Fig. 8). An analysis of the equivalent interface positions on the receptor that contact the Gα protein shows that A2AR independently accumulated a different set of mutations in the same region to couple to Gαs and hence arrived at a different sequence pattern to read the same selectivity barcode on Gαs (see also Extended Data Fig. 7b). Mutagenesis of the A2b receptor has shown that the positions 3x50, 3x54, 5x69, 6x36 and 6x37 affect the coupling of Gαs, Gαq, Gα12, Gα13, Gα14, Gαi1, Gαi2 and Gα152 (see also Supplementary Table 1).
Extended Data Figure 10. Webserver for analysis of GPCR-G protein selectivity analysis considering evolutionary factors.
Summary of the features in GPCRdb, describing the receptor-G protein binding interface. These features allow users to investigate various aspects of receptor-G protein binding selectivity and G protein specific information for all the human GPCRs and G proteins.
Supplementary Material
Supplementary Information is available in the online version of the paper.
Acknowledgements
We thank U. F. Lang, D. Veprintsev, C. Ravarani, H. Harbrecht, G. De Baets, D. Prado, X. Deupi, C. G. Tate and N. S. Latysheva for their comments on this work, and Joanna Westmoreland for assistance with Figure 6. We thank S. Chavali and B. Lang for help with compiling mutation and expression data. We thank Mohamed Mounir and Christian Munk for their help with the GPCRdb web service. This work was supported by the Medical Research Council (MC_U105185859; M.M.B., T.F., S.B.), the Boehringer Ingelheim Fond (T.F.), European Research Council (DE-ORPHAN 639125; D.E.G., A.S.H., N.L.), and the Lundbeck Foundation (R163-2013-16327; D.E.G). T.F. is a Research Fellow of Fitzwilliam College, University of Cambridge, UK. M.M.B. is a Lister Institute Research Prize Fellow and is supported by an ERC Consolidator Grant.
Footnotes
Code availability. The open source code can be fetched from GitHub (https://github.com/protwis/protwis). For availability of codes that were developed in-house, please contact the authors.
Data availability. All relevant data are integrated into the web resource in GPCRdb30 (top menu item “Signal Proteins” at www.gpcrdb.org) and can also be fetched from GitHub (https://github.com/protwis/gpcrdb_data). All other data that support the findings of this study have been provided as Supplementary Data.
Author Contributions T.F. and M.M.B. designed the project, analysed the data, interpreted the results and wrote the manuscript, with inputs from all authors. T.F. collected data, wrote scripts and performed all the analyses. S.B. carried out ortholog detection, receptor alignment, tree building and ancestral reconstruction with help from T.F; D.E.G., N.L. and A.S.H carried out the analysis on GPCR sequence patterns, and developed the web services. M.M.B. supervised the project.
Author Information Reprints and permissions information is available at www.nature.com/reprints. Readers are welcome to comment on the online version of the paper.
The authors declare no competing financial interests.
References
- 1.Bjarnadottir TK, et al. Comprehensive repertoire and phylogenetic analysis of the G protein-coupled receptors in human and mouse. Genomics. 2006;88:263–273. doi: 10.1016/j.ygeno.2006.04.001. [DOI] [PubMed] [Google Scholar]
- 2.Anantharaman V, Abhiman S, de Souza RF, Aravind L. Comparative genomics uncovers novel structural and functional features of the heterotrimeric GTPase signaling system. Gene. 2011;475:63–78. doi: 10.1016/j.gene.2010.12.001. [DOI] [PMC free article] [PubMed] [Google Scholar]
- 3.Southan C, et al. The IUPHAR/BPS Guide to PHARMACOLOGY in 2016: towards curated quantitative interactions between 1300 protein targets and 6000 ligands. Nucleic Acids Res. 2016;44:D1054–1068. doi: 10.1093/nar/gkv1037. [DOI] [PMC free article] [PubMed] [Google Scholar]
- 4.Isberg V, et al. Generic GPCR residue numbers - aligning topology maps while minding the gaps. Trends Pharmacol Sci. 2015;36:22–31. doi: 10.1016/j.tips.2014.11.001. [DOI] [PMC free article] [PubMed] [Google Scholar]
- 5.Neves SR, Ram PT, Iyengar R. G protein pathways. Science. 2002;296:1636–1639. doi: 10.1126/science.1071550. [DOI] [PubMed] [Google Scholar]
- 6.Marinissen MJ, Gutkind JS. G-protein-coupled receptors and signaling networks: emerging paradigms. Trends Pharmacol Sci. 2001;22:368–376. doi: 10.1016/s0165-6147(00)01678-3. [DOI] [PubMed] [Google Scholar]
- 7.Oldham WM, Hamm HE. Heterotrimeric G protein activation by G-protein-coupled receptors. Nat Rev Mol Cell Biol. 2008;9:60–71. doi: 10.1038/nrm2299. [DOI] [PubMed] [Google Scholar]
- 8.Frielle T, et al. Cloning of the cDNA for the human beta 1-adrenergic receptor. Proc Natl Acad Sci U S A. 1987;84:7920–7924. doi: 10.1073/pnas.84.22.7920. [DOI] [PMC free article] [PubMed] [Google Scholar]
- 9.Ruat M, et al. A novel rat serotonin (5-HT6) receptor: molecular cloning, localization and stimulation of cAMP accumulation. Biochem Biophys Res Commun. 1993;193:268–276. doi: 10.1006/bbrc.1993.1619. [DOI] [PubMed] [Google Scholar]
- 10.Li F, De Godoy M, Rattan S. Role of adenylate and guanylate cyclases in beta1-, beta2-, and beta3-adrenoceptor-mediated relaxation of internal anal sphincter smooth muscle. J Pharmacol Exp Ther. 2004;308:1111–1120. doi: 10.1124/jpet.103.060145. [DOI] [PubMed] [Google Scholar]
- 11.Wess J. Molecular basis of receptor/G-protein-coupling selectivity. Pharmacol Ther. 1998;80:231–264. doi: 10.1016/s0163-7258(98)00030-8. [DOI] [PubMed] [Google Scholar]
- 12.Horn F, van der Wenden EM, Oliveira L, AP IJ, Vriend G. Receptors coupling to G proteins: is there a signal behind the sequence? Proteins. 2000;41:448–459. doi: 10.1002/1097-0134(20001201)41:4<448::aid-prot30>3.0.co;2-c. [DOI] [PubMed] [Google Scholar]
- 13.Wong SK. G protein selectivity is regulated by multiple intracellular regions of GPCRs. Neurosignals. 2003;12:1–12. doi: 10.1159/000068914. [DOI] [PubMed] [Google Scholar]
- 14.Kruse AC, et al. Structure and dynamics of the M3 muscarinic acetylcholine receptor. Nature. 2012;482:552–556. doi: 10.1038/nature10867. [DOI] [PMC free article] [PubMed] [Google Scholar]
- 15.Rasmussen SG, et al. Crystal structure of the beta2 adrenergic receptor-Gs protein complex. Nature. 2011;477:549–555. doi: 10.1038/nature10361. [DOI] [PMC free article] [PubMed] [Google Scholar]
- 16.Carpenter B, Nehme R, Warne T, Leslie AG, Tate CG. Structure of the adenosine A(2A) receptor bound to an engineered G protein. Nature. 2016;536:104–107. doi: 10.1038/nature18966. [DOI] [PMC free article] [PubMed] [Google Scholar]
- 17.Krishnan A, et al. Evolutionary hierarchy of vertebrate-like heterotrimeric G protein families. Mol Phylogenet Evol. 2015;91:27–40. doi: 10.1016/j.ympev.2015.05.009. [DOI] [PubMed] [Google Scholar]
- 18.Krishnan A, Schioth HB. The role of G protein-coupled receptors in the early evolution of neurotransmission and the nervous system. J Exp Biol. 2015;218:562–571. doi: 10.1242/jeb.110312. [DOI] [PubMed] [Google Scholar]
- 19.Krishnan A, Almen MS, Fredriksson R, Schioth HB. The origin of GPCRs: identification of mammalian like Rhodopsin, Adhesion, Glutamate and Frizzled GPCRs in fungi. PLoS One. 2012;7:e29817. doi: 10.1371/journal.pone.0029817. [DOI] [PMC free article] [PubMed] [Google Scholar]
- 20.Mirny LA, Gelfand MS. Using orthologous and paralogous proteins to identify specificity determining residues. Genome Biol. 2002;3 doi: 10.1186/gb-2002-3-3-preprint0002. PREPRINT0002. [DOI] [PubMed] [Google Scholar]
- 21.Flock T, et al. Universal allosteric mechanism for Galpha activation by GPCRs. Nature. 2015;524:173–179. doi: 10.1038/nature14663. [DOI] [PMC free article] [PubMed] [Google Scholar]
- 22.Sun D, et al. Probing Galphai1 protein activation at single-amino acid resolution. Nat Struct Mol Biol. 2015;22:686–694. doi: 10.1038/nsmb.3070. [DOI] [PMC free article] [PubMed] [Google Scholar]
- 23.Conklin BR, Farfel Z, Lustig KD, Julius D, Bourne HR. Substitution of three amino acids switches receptor specificity of Gq alpha to that of Gi alpha. Nature. 1993;363:274–276. doi: 10.1038/363274a0. [DOI] [PubMed] [Google Scholar]
- 24.Komatsuzaki K, et al. A novel system that reports the G-proteins linked to a given receptor: a study of type 3 somatostatin receptor. FEBS Lett. 1997;406:165–170. doi: 10.1016/s0014-5793(97)00257-3. [DOI] [PubMed] [Google Scholar]
- 25.Sasamura H, et al. Analysis of Galpha protein recognition profiles of angiotensin II receptors using chimeric Galpha proteins. Mol Cell Endocrinol. 2000;170:113–121. doi: 10.1016/s0303-7207(00)00333-6. [DOI] [PubMed] [Google Scholar]
- 26.Janin J, Chothia C. The structure of protein-protein recognition sites. J Biol Chem. 1990;265:16027–16030. [PubMed] [Google Scholar]
- 27.Venkatakrishnan AJ, et al. Molecular signatures of G-protein-coupled receptors. Nature. 2013;494:185–194. doi: 10.1038/nature11896. [DOI] [PubMed] [Google Scholar]
- 28.Reichmann D, et al. The modular architecture of protein-protein binding interfaces. Proc Natl Acad Sci U S A. 2005;102:57–62. doi: 10.1073/pnas.0407280102. [DOI] [PMC free article] [PubMed] [Google Scholar]
- 29.Kleinau G et al. Principles and determinants of G-protein coupling by the rhodopsin-like thyrotropin receptor. PLoS One. 2010;5:e9745. doi: 10.1371/journal.pone.0009745. [DOI] [PMC free article] [PubMed] [Google Scholar]
- 30.Isberg V, et al. GPCRdb: an information system for G protein-coupled receptors. Nucleic Acids Res. 2016;44:D356–364. doi: 10.1093/nar/gkv1178. [DOI] [PMC free article] [PubMed] [Google Scholar]
- 31.Wichard JD, et al. Chemogenomic analysis of G-protein coupled receptors and their ligands deciphers locks and keys governing diverse aspects of signalling. PLoS One. 2011;6:e16811. doi: 10.1371/journal.pone.0016811. [DOI] [PMC free article] [PubMed] [Google Scholar]
- 32.Pawson AJ, et al. The IUPHAR/BPS Guide to PHARMACOLOGY: an expert-driven knowledgebase of drug targets and their ligands. Nucleic Acids Res. 2014;42:D1098–1106. doi: 10.1093/nar/gkt1143. [DOI] [PMC free article] [PubMed] [Google Scholar]
- 33.Finn RD, et al. The Pfam protein families database: towards a more sustainable future. Nucleic Acids Res. 2016;44:D279–285. doi: 10.1093/nar/gkv1344. [DOI] [PMC free article] [PubMed] [Google Scholar]
- 34.UniProt, C. UniProt: a hub for protein information. Nucleic Acids Res. 2015;43:D204–212. doi: 10.1093/nar/gku989. [DOI] [PMC free article] [PubMed] [Google Scholar]
- 35.Wuster A, Venkatakrishnan AJ, Schertler GF, Babu MM. Spial: analysis of subtype-specific features in multiple sequence alignments of proteins. Bioinformatics. 2010;26:2906–2907. doi: 10.1093/bioinformatics/btq552. [DOI] [PMC free article] [PubMed] [Google Scholar]
- 36.Fredriksson R, Schioth HB. The repertoire of G-protein-coupled receptors in fully sequenced genomes. Mol Pharmacol. 2005;67:1414–1425. doi: 10.1124/mol.104.009001. [DOI] [PubMed] [Google Scholar]
- 37.Altenhoff AM, Schneider A, Gonnet GH, Dessimoz C. OMA 2011: orthology inference among 1000 complete genomes. Nucleic Acids Res. 2011;39:D289–294. doi: 10.1093/nar/gkq1238. [DOI] [PMC free article] [PubMed] [Google Scholar]
- 38.Vilella AJ, et al. EnsemblCompara GeneTrees: Complete, duplication-aware phylogenetic trees in vertebrates. Genome Res. 2009;19:327–335. doi: 10.1101/gr.073585.107. [DOI] [PMC free article] [PubMed] [Google Scholar]
- 39.Finn RD, et al. HMMER web server: 2015 update. Nucleic Acids Res. 2015;43:W30–38. doi: 10.1093/nar/gkv397. [DOI] [PMC free article] [PubMed] [Google Scholar]
- 40.Putnam NH, et al. Sea anemone genome reveals ancestral eumetazoan gene repertoire and genomic organization. Science. 2007;317:86–94. doi: 10.1126/science.1139158. [DOI] [PubMed] [Google Scholar]
- 41.Srivastava M, et al. The Trichoplax genome and the nature of placozoans. Nature. 2008;454:955–960. doi: 10.1038/nature07191. [DOI] [PubMed] [Google Scholar]
- 42.Paradis E, Claude J, Strimmer K. APE: Analyses of Phylogenetics and Evolution in R language. Bioinformatics. 2004;20:289–290. doi: 10.1093/bioinformatics/btg412. [DOI] [PubMed] [Google Scholar]
- 43.Ruan J, et al. TreeFam: 2008 Update. Nucleic Acids Res. 2008;36:D735–740. doi: 10.1093/nar/gkm1005. [DOI] [PMC free article] [PubMed] [Google Scholar]
- 44.Pei J, Sadreyev R, Grishin NV. PCMA: fast and accurate multiple sequence alignment based on profile consistency. Bioinformatics. 2003;19:427–428. doi: 10.1093/bioinformatics/btg008. [DOI] [PubMed] [Google Scholar]
- 45.Krissinel E, Henrick K. Inference of macromolecular assemblies from crystalline state. J Mol Biol. 2007;372:774–797. doi: 10.1016/j.jmb.2007.05.022. [DOI] [PubMed] [Google Scholar]
- 46.Rost B, Sander C. Conservation and prediction of solvent accessibility in protein families. Proteins. 1994;20:216–226. doi: 10.1002/prot.340200303. [DOI] [PubMed] [Google Scholar]
- 47.Shannon P, et al. Cytoscape: a software environment for integrated models of biomolecular interaction networks. Genome Res. 2003;13:2498–2504. doi: 10.1101/gr.1239303. [DOI] [PMC free article] [PubMed] [Google Scholar]
- 48.Shannon PT, Grimes M, Kutlu B, Bot JJ, Galas DJ. RCytoscape: tools for exploratory network analysis. BMC Bioinformatics. 2013;14:217. doi: 10.1186/1471-2105-14-217. [DOI] [PMC free article] [PubMed] [Google Scholar]
- 49.Su G, Kuchinsky A, Morris JH, States DJ, Meng F. GLay: community structure analysis of biological networks. Bioinformatics. 2010;26:3135–3137. doi: 10.1093/bioinformatics/btq596. [DOI] [PMC free article] [PubMed] [Google Scholar]
- 50.Morris JH, et al. clusterMaker: a multi-algorithm clustering plugin for Cytoscape. BMC Bioinformatics. 2011;12:436. doi: 10.1186/1471-2105-12-436. [DOI] [PMC free article] [PubMed] [Google Scholar]
- 51.Doncheva NT, Assenov Y, Domingues FS, Albrecht M. Topological analysis and interactive visualization of biological networks and protein structures. Nat Protoc. 2012;7:670–685. doi: 10.1038/nprot.2012.004. [DOI] [PubMed] [Google Scholar]
- 52.Liu Y, Schmidt B, Maskell DL. MSAProbs: multiple sequence alignment based on pair hidden Markov models and partition function posterior probabilities. Bioinformatics. 2010;26:1958–1964. doi: 10.1093/bioinformatics/btq338. [DOI] [PubMed] [Google Scholar]
- 53.Konagurthu AS, Whisstock JC, Stuckey PJ, Lesk AM. MUSTANG: a multiple structural alignment algorithm. Proteins. 2006;64:559–574. doi: 10.1002/prot.20921. [DOI] [PubMed] [Google Scholar]
- 54.Price MN, Dehal PS, Arkin AP. FastTree 2--approximately maximum-likelihood trees for large alignments. PLoS One. 2010;5:e9490. doi: 10.1371/journal.pone.0009490. [DOI] [PMC free article] [PubMed] [Google Scholar]
- 55.Kumar S, Stecher G, Tamura K. MEGA7: Molecular Evolutionary Genetics Analysis Version 7.0 for Bigger Datasets. Mol Biol Evol. 2016 doi: 10.1093/molbev/msw054. [DOI] [PMC free article] [PubMed] [Google Scholar]
- 56.Crooks GE, Hon G, Chandonia JM, Brenner SE. WebLogo: a sequence logo generator. Genome Res. 2004;14:1188–1190. doi: 10.1101/gr.849004. [DOI] [PMC free article] [PubMed] [Google Scholar]
- 57.Letunic I, Bork P. Interactive tree of life (iTOL) v3: an online tool for the display and annotation of phylogenetic and other trees. Nucleic Acids Res. 2016 doi: 10.1093/nar/gkw290. [DOI] [PMC free article] [PubMed] [Google Scholar]
- 58.Grant BJ, Rodrigues AP, ElSawy KM, McCammon JA, Caves LS. Bio3d: an R package for the comparative analysis of protein structures. Bioinformatics. 2006;22:2695–2696. doi: 10.1093/bioinformatics/btl461. [DOI] [PubMed] [Google Scholar]
- 59.Barker D, Meade A, Pagel M. Constrained models of evolution lead to improved prediction of functional linkage from correlated gain and loss of genes. Bioinformatics. 2007;23:14–20. doi: 10.1093/bioinformatics/btl558. [DOI] [PubMed] [Google Scholar]
Associated Data
This section collects any data citations, data availability statements, or supplementary materials included in this article.


