

Abstract
Genetic defects in the synaptic scaffolding protein gene, SHANK2, are linked to a variety of neuropsychiatric disorders, including autism spectrum disorders, schizophrenia, intellectual disability, and bipolar disorder, but the molecular mechanisms underlying the pleotropic effects of SHANK2 mutations are poorly understood. We generated and characterized a line of Shank2 mutant mice by deleting exon 24 (Δe24). Shank2Δe24–/– mice engage in significantly increased locomotor activity, display abnormal reward-seeking behavior, are anhedonic, have perturbations in circadian rhythms, and show deficits in social and cognitive behaviors. While these phenotypes recapitulate the pleotropic behaviors associated with human SHANK2-related disorders, major behavioral features in these mice are reminiscent of bipolar disorder. For instance, their hyperactivity was augmented with amphetamine but was normalized with the mood stabilizers lithium and valproate. Shank2 deficiency limited to the forebrain recapitulated the bipolar mania phenotype. The composition and functions of NMDA and AMPA receptors were altered at Shank2-deficient synapses, hinting toward the mechanism underlying these behavioral abnormalities. Human genetic findings support construct validity, and the behavioral features in Shank2 Δe24 mice support face and predictive validities of this model for bipolar mania. Further genetic studies to understand the contribution of SHANK2 deficiencies in bipolar disorder are warranted.
Keywords: Genetics, Neuroscience
Keywords: Psychiatric diseases
Shank2 mutant mice with exon 24 deletion engage in increased locomotor activity, display abnormal reward-seeking behavior, and show deficits in social and cognitive behavior.
Introduction
The SHANK (ProSAP) family, SHANK1–SHANK3, are scaffolding proteins enriched in the postsynaptic density (PSD) of excitatory synapses (1, 2). Early genetic studies implicated SHANK family genes in both autism spectrum disorders (ASDs) and intellectual disability (3–6). Increasing evidence supports a role for SHANK family genes in a broad spectrum of neuropsychiatric disorders (7). For instance, rare genetic variants in both SHANK2 and SHANK3 have been described in individuals presenting with primary diagnoses of schizophrenia or bipolar disorder (8–11). A 276-kb duplication that encompasses the 3′ coding region of exons 17–25 and likely disrupts the SHANK2 gene has been identified in a proband with bipolar disorder (8). Bipolar disorder has been reported also in individuals with 22q13.3 deletion (Phelan-McDermid syndrome), for which SHANK3 is included in the deleted interval (12–14).
While genetic variants in many neuronal and synaptic genes are widely reported in genomics studies, these variants are shared frequently among common neuropsychiatric conditions (15–17). To date, there is little understanding as to how defects within a single gene can be associated with risk for multiple neuropsychiatric illnesses or for a broad spectrum of clinical presentations. That SHANK genes are implicated in bipolar disorder is particularly interesting, since the molecular basis of bipolar disorder remains obscure, despite recognition of its high heritability (16, 18–21). At present, few animal models proposed for bipolar disorder satisfy both construct and face validity. This limitation has hindered our ability both to understand its pathophysiology and to develop new treatments for the condition (22–25). In two previous studies, Shank2 mice bearing deletions of exon 6 or exons 6–7 displayed autism-like behaviors and cognitive impairment (26, 27). Since mutations in SHANK2 have been associated with various neuropsychiatric presentations, we reasoned that a more comprehensive analysis of Shank2 mutations in mice might provide new insights into the complex role that SHANK2 plays in neuropsychiatric disorders. To this purpose, we generated a new line of Shank2 exon 24 mutant mice by global deletion or by floxing the exon (which enabled us to delete this gene in a temporally and spatially restricted fashion). While Shank2 e24 mutant mice displayed a broad spectrum of abnormal behaviors resembling the phenotypes associated with human SHANK2 defects, the most prominent behavioral features in the mutant mice recapitulate the mania seen in bipolar disorder. In the present report, we have identified both a brain region and a molecular mechanism that likely contribute to the abnormal behavioral phenotypes seen in Shank2 e24 mutant mice.
Results
Generation and molecular characterization of Shank2 exon 24 deletion mice.
Several de novo protein-truncating mutations have been found within exon 24 of the SHANK2 gene in children with ASDs and intellectual disability (4, 5). A duplication encompassing exons 17–25, which likely disrupts the SHANK2 gene, was found in a proband with bipolar disorder (ref. 8 and Supplemental Figure 1, A and C; supplemental material available online with this article; https://doi.org/10.1172/jci.insight.92052DS1). Exon 24 (2,407 bp), the largest coding exon in this gene, encodes a proline-rich domain (PRR) containing the Homer- and cortactin-binding sites (Figure 1A and Supplemental Figure 1B). Upon obtaining Shank2 exon 24–floxed mutant mice (e24flox) (Figure 1B), these Shank2 e24flox mice were mated with CMV-Cre mice to obtain germline transmission with exon 24 deletion (Δe24) (Figure 1C). RT-PCR analysis confirmed the deletion of exon 24–containing mRNA (Supplemental Figure 1D), and Western blotting showed the absence of SHANK2 proteins in multiple brain regions, including hippocampus, cortex, and striatum (Figure 1D). Following backcrossing to C57BL/6J mice for more than 5 generations, the naturally occurring Disc1 mutation from 129R1 was segregated out (28). Seven cohorts of Shank2Δe24–/–, herein referred to as Δe24–/–, mice (n = 54 male and n = 32 female at 3–5 months of age) were generated from heterozygous matings, and WT littermates from these breeding (WT or e24+/+) males (n = 51) and females (n = 50) were used as controls for all experiments (Supplemental Table 1). For ease of study and analysis, we focused on comparing Δe24–/– with e24+/+ mice. While haploinsufficiency of SHANK2 is commonly associated with human patients, defects found in Δe24–/– mice may predict a similar but milder phenotype in Δe24+/– mice. The investigators were blinded to the genotype or treatment assignments of the mice in all behavioral and drug treatment studies, and the major findings were replicated in different sets of animals. A summarized detailed description of the statistical analyses is provided for all behavioral experiments in the Supplemental Table 5.
Figure 1. Generation of Shank2Δe24 mutant mice and mania-like behaviors in these mutants.

(A) Generation strategy for e24 floxed (e24flox) mice and deletion of exon 24 (Δe24) (arrows show genotyping primers X, Y, and Z listed in Supplemental Table 2). The construct shows the loxP (green), FRT (blue), and the Neo cassette (yellow) sites. (B) Genotyping of Δe24+/flox mice by Southern blot using a 5′ flanking probe. WT, wild type. MT, mutant. (C) Genotyping e24+/+, Δe24+/–, and Δe24–/– mice by PCR using primers X, Y, and Z as diagramed. (D) Absence of SHANK2 protein by western blotting in hippocampus, neocortex, and striatum in e24+/+ and Δe24–/– mice. (E) Augmented open-field locomotor activity in Δe24–/– mice compared with Δe24+/– and e24+/+ animals depicted in 5-minute segments (left) or as cumulative distance traveled (0–60 minutes) (right). The data are presented as mean ± SEM. *P < 0.05, +/+ vs. –/–; #P < 0.05, +/– vs. –/–; n = 8–9 mice/genotype (see Supplemental Table 1 for details of the animal cohorts used for the behavioral analysis and Supplemental Table 5 for details of the statistical analyses for all behavioral tests). (F) Profiles of locomotion in first and last 15 minutes during the 60-minute test in open field show that Δe24–/– mice were hyperactive and failed to exhibit habituation during exposure to the open field relative to e24+/+ control. (G) Locomotor activity in the open field in 10-minute segments (left) and as cumulative distance traveled (right) in Δe24–/– mice were higher than that for e24+/+ and Δe24+/– mice during both the light and dark phases over a 48-hour period (RMANOVA: *P < 0.05, +/+ vs. –/–; #P < 0.05, +/– vs. –/–; n = 8–9 mice/genotype). (H) Latency to fall from the rotarod was decreased in Δe24–/– mice compared with e24+/+ mice (RMANOVA: *P < 0.05, +/+ vs. –/–; n = 20–21 mice). (I) Acute treatment with amphetamine (AMPH) augmented the hyperactivity in Δe24–/– mice relative to untreated animals. The percentage increase in the cumulative distance traveled in Δe24–/– mice relative to baseline (2-way ANOVA: &P < 0.05, AMPH treated vs. vehicle; *P < 0.05, AMPH treated +/+ vs. –/–; n = 7–9 mice/genotype).
Shank2 Δe24–/– mice display mania-like behaviors.
Δe24–/– mice were viable, fertile, born at the expected Mendelian ratios, and exhibited no apparent developmental defects, differences in body weight, or spontaneous seizures. In the home cage, Δe24–/– mice were observed to be hyperactive. In the open field, Δe24–/– mice engaged in significantly increased locomotor (Figure 1E) and rearing activities relative to e24+/+ controls (Supplemental Figure 2A). Locomotion and rearing activity in Δe24+/– animals was also higher than that for the Δe24+/+ mice, though these differences were not statistically significant. Locomotor activities in both e24+/+ and Δe24+/– mice habituated over the 60-minute test, whereas activity in the Δe24–/– animals did not change over the 60-minute test (Figure 1E). To examine locomotion in greater detail, activities in the center and peripheral zones were analyzed in 15-minute bins across the 60-minute test (Supplemental Figure 2B). Here, it can be seen that locomotion in both the peripheral and central zone of the open field was significantly augmented in each of the four 15-minute bins for Δe24–/– mice relative to their e24+/+ controls. Similarly, locomotor activities in the peripheral zone were increased in Δe24–/– animals at 16–30, 31–45, and 46–60 minutes and at all 4 time bins for center zone activities compared with the Δe24+/– mice. The profiles of locomotor activities were examined over the first 15 and the last 15 minutes of the 60-minute test (Figure 1F). Compared with e24+/+ mice, Δe24–/– mice were hyperactive and did not show apparent habituation. To examine motor activity over longer times, responses were monitored over 48 hours, revealing that increased locomotion in Δe24–/– mice persisted (Figure 1G). To determine whether other motor responses were abnormal, we tested the mice on the rotarod and found that the latency to fall from the rod was reduced in the Δe24–/– mice compared with their e24+/+ controls (Figure 1H). In summary, the Δe24–/– mice were hyperactive in the open field and had difficulty with balance and coordination on the rotarod.
To assess if the hyperactivity in Δe24–/– mice resembled that of attention-deficit hyperactivity disorder (ADHD) or bipolar-associated mania, we treated Δe24–/– mice with amphetamine (AMPH), which attenuates the hyperactivity associated with ADHD while exacerbating the mania of bipolar disorder (29). An acute dose of AMPH (2 mg/kg) augmented the hyperactivity in both Δe24–/– and Δe24+/+ mice over that of their respective vehicle groups (Figure 1I and Supplemental Figure 2, C–E). Accordingly, we conclude that the AMPH-stimulated hyperactivity in the Δe24–/– mice is inconsistent with an ADHD phenotype but is similar to the manic behavior seen in individuals with bipolar disorder.
In humans, bipolar disorder is often associated not only with increased psychomotor responses, but also with intermittent depression. These depressive episodes are common, though not essential for a diagnosis of bipolar I disorder (30). We conducted a sucrose preference test to assess possible anhedonia in Shank2 mutant mice. Δe24–/– mice consumed less during the 2-day test compared with the e24+/+ controls; however, the change was not significant (Figure 2A, left). When adjusted for the total volume consumed, the preference for sucrose was significantly depressed in Δe24–/– mice, suggesting anhedonia-like behavior in these mutants (Figure 2A, right). In contrast, we found no significant genotype differences in the tail suspension and forced swim tests (Supplemental Figure 3, A and B), two tests commonly used to evaluate antidepressant effects (31, 32).
Figure 2. Anhedonia, lever pressing, circadian rhythms, and responses to lithium and VPA in Shank2Δe24 mice.

(A) Δe24–/– and e24+/+ mice consume similar volumes of liquid, but Δe24–/– mice show a significantly reduced preference for sucrose (2-tailed t test: *P < 0.01, +/+ vs. –/–; n = 26–28 mice/genotype). (B) Under the continuous reinforcement schedule of 1:1, numbers of total lever presses were similar for e24+/+ and Δe24–/– mice. (C) Δe24–/– mice had significantly more food cup entries than e24+/+ controls. (D) Under the RR20 schedule of reinforcement, Δe24–/– mice pressed at a higher rate than e24+/+ controls. (E) Press rates between genotypes were similar during extinction (unrewarded) but were significantly different during reward and reinstatement phases. (F) Breakpoints were similar between e24+/+ and Δe24–/– mice during a progressive ratio test (2-tailed t test: *P < 0.05, +/+ vs. –/–; n = 16–17 mice/genotype). (G and H) Δe24–/– mice have abnormal circadian rhythms. Representative actograms of motor activity for e24+/+ (F) and Δe24–/– (G) mice. Mice were first entrained to a 12:12-hour-light/dark cycle before being placed into continuous darkness for a free-run period. After 32–34 days, mice were exposed to a 6-hour light pulse (red arrow). e24+/+ mice entrained, whereas Δe24–/– mice did not entrain to the pulse. Both genotypes reentrained to the 12:12-hour-light/dark cycle following the free-run period. (I) Lithium reversed abnormal circadian rhythm in Δe24–/– mice and enabled mutants to respond to the 6-hour light pulse (n = 8–10 mice/genotype/treatment). (J–L) Phase shift (J), but not Tau (K) or phase angle (L), was abnormal in Δe24–/– mice. Lithium restored this parameter (I) to levels of e24+/+ mice (RMANOVA: *P < 0.05, +/+ vs. –/–; #P < 0.05+/+ vs. +/+ lithium treated within genotype; ^P < 0.05, –/– vs. –/– lithium treated within genotype; n = 8–10 mice/genotype/treatment for F–K). (M) Acute administration of VPA reduced locomotor activity of Δe24–/– mice in open field to that of e24+/+ vehicle controls (2-way ANOVA: *P < 0.05, +/+ VEH vs. –/– VEH treated; ^P < 0.05, –/– VEH vs. –/– VPA treated; n = 11 mice/genotype/treatment). (N) Lithium partially reduced hyperlocomotion in Δe24–/– mice to that of e24+/+ controls (2-way ANOVA: *P < 0.05, +/+ VEH vs. –/– VEH-treated; #P < 0.05, –/– VEH vs. –/– lithium-treated; &P < 0.05, +/+ lithium vs. –/– lithium treated. P = 0.027 for treatment × genotype interaction; n = 5–12 mice/genotype/treatment).
Another feature characteristic of bipolar disorder is enhanced reward-seeking behavior. To assess this trait, mice were tested in an operant conditioning paradigm. During initial acquisition under continuous reinforcement, each bar press was reinforced with a food pellet for 8 sessions. During this phase, the total number of lever presses was not different between Δe24–/– and e24+/+ mice (Figure 2B). In contrast, the rate of food cup entries was increased significantly in the mutants (Figure 2C). More importantly, under a random ratio 20 (RR20) schedule (i.e., the number of bar presses required for reinforcement was random and averaged 1 reinforcement per 20 presses), the number of lever press per minute was significantly higher for the Δe24–/– mice compared with the e24+/+ mice (Figure 2D). The rate of lever pressing was higher in the Δe24–/– mice during RR20-reinforced sessions and during reinstatement (reward delivered after extinction) but not during extinction (no reward delivered, Figure 2E). These results suggest that the enhanced reward-seeking behavior in Δe24–/– mice was specific to reinforced conditions. Thus, while the Δe24–/– mice engaged in more perseverative behaviors (e.g., increased food cup entries and bar presses) than the e24+/+ controls, these increases cannot be attributed to differences in motivation, since the breakpoints on the progressive ratio schedule, a measure for the sensitivity to extinction (Figure 2F), and the overall food intake were not different between genotypes (Supplemental Figure 2F). Together, these results suggest that under continuous reinforcement the Δe24–/– mice have higher reward-seeking behaviors, in the form of food cup entries, than the e24+/+ controls, and this becomes more obvious under partial reinforcement conditions (RR20), when most lever presses were not rewarded.
Disruption of sleep patterns and circadian rhythms is frequently associated with bipolar disorder (33, 34). To evaluate the circadian rhythms of the mutant mice, we utilized running wheels. Both e24+/+ and Δe24–/– mice exhibited robust running wheel activity when first entrained to a 12:12-hour-light/dark cycle over the first 10 days of testing (Figure 2, G and H). Next, mice were placed into constant darkness and allowed to “free run” over 32–34 days. During this period, the e24+/+ animals exhibited a forward shift in the onset of their running period; this shift was less evident in Δe24–/– mice, whose records showed a general fragmentation of activity each day. When the mice were exposed to a 6-hour light pulse after 32–34 days of darkness, the e24+/+ mice entrained to the pulse, whereas the Δe24–/– mice showed little response. Nevertheless, after approximately 2 more weeks of free run, both e24+/+ and Δe24–/– mice were readily reentrained to the 12:12-hour-light/dark cycle. An examination of phase shift, tau, and phase angle of the circadian rhythm during the periods of entrainment, free run, and following the light pulse revealed that only the phase shift differed significantly between the e24+/+ and Δe24–/– mice (Figure 2, J–L).
Mood stabilizers like lithium and valproic acid (VPA) have therapeutic and diagnostic value in human patients experiencing mania (35, 36). We tested whether lithium could ameliorate the circadian phenotype observed in the Δe24–/– mice. Mice were fed lithium-containing chow using a protocol that has been shown to result in serum lithium levels comparable to those in the therapeutic range for humans (37, 38). We found that lithium rendered the circadian rhythms of the Δe24–/– mice similar to those of the e24+/+ controls (Figure 2I). Further examination of the data revealed that lithium produced significant changes in the phase shift and phase angle in the free-run phase of the Δe24–/– mice (Figure 2, K and L). Mice were also evaluated in the open field. Acute treatment with VPA or chronic treatment with lithium significantly reduced the hyperactivity in the Δe24–/– mice while exerting no effects in the e24+/+ mice (Figure 2, M and N). Together, these results indicate that lithium restored circadian rhythms in the Δe24–/– mice and that both VPA and lithium reduced the hyperactivity in the Δe24–/– mutants.
Shank2Δe24 mice display impaired social and cognitive behaviors.
Human genetic studies have implicated SHANK2 in ASDs (5), and previous rodent experiments have reported autism-like behaviors in two different lines of Shank2 mutant mice (26, 27). We conducted a series of behavioral tests to assess whether Δe24–/– mice would display ASD-like and intellectual disability–like phenotypes similar to those associated with SHANK2 mutations in humans (4, 5, 39). We tested social behaviors using a sociability paradigm, which revealed no significant deficiencies in the Δe24–/– mice of either sex (Figure 3A and Supplemental Figure 3C). Social behavior was assessed also in a dyadic experiment. The e24+/+ controls engaged in significantly more bidirectional than unidirectional social interactions with their C3H partners, whereas bidirectional and unidirectional interactions were not distinguished in either the Δe24+/– or Δe24–/– mice (Figure 3B), providing some evidence for abnormal social behavior in the Shank2 mutant mice in this particular context.
Figure 3. Social, repetitive, stereotyped, and cognitive behaviors in Shank2Δe24 mutant mice.

(A) In the sociability test, no genotype or sex differences were observed for preference between two identical nonsocial (NS-NS) stimuli. In the NS-social 1 (NS-S1) pairing, there was a trend (RMANOVA: P = 0.08) for social affiliation to be reduced in male, but not in female, Δe24–/– mice compared with e24+/+ controls (n = 11–14 mice/genotype/sex). (B) In the social dyadic test, e24+/+ mice engaged in significantly more bidirectional than unidirectional interaction behaviors, while Δe24+/– and Δe24–/– mice showed no distinctions between bidirectional and unidirectional interactions (RMANOVA: *P < 0.05, bidirectional vs. unidirectional interaction; n = 8 for e24+/–, n = 10 for Δe24–/– and Δe24+/+ mice). (C) The duration of grooming and numbers of grooming bouts in Δe24–/– mice were decreased compared with those in e24+/+ mice before water spray and in both e24+/+ and e24+/– mice after water spray (RMANOVA: *P < 0.05, +/+ vs. –/–; #P < 0.05, +/– vs. –/–; n = 21 for +/+, n = 20 for –/–, and n = 8 for +/– mice). (D) In the hole board test, Δe24–/– mice had a significantly higher ratio of nose pokes to number of holes than e24+/+ controls. There were no genotype differences in the number of pokes (RMANOVA: *P < 0.05, +/+ vs. –/–; n = 28 for +/+, n = 30 for –/–; #P < 0.05 for +/– vs. –/–; n = 13 for +/– mice). (E and F) Acquisition and reversal performance in the Morris water maze (MWM). Acquisition swim times (E) were longer for the Δe24–/– mice to reach the hidden platform than for the e24+/+ animals. A similar finding was observed during reversal (F) (RMANOVA: *P < 0.05, +/+ vs. –/–; #P < 0.05, +/– vs. –/–; n = 8–9 mice/genotype).
To further examine evidence for an ASD-like phenotype, repetitive and stereotyped behaviors were examined in two tests. Surprisingly, in the induced grooming test, the duration of self-grooming prior to and after misting with water was significantly shorter in the Δe24–/– mice than in the e24+/+ controls (Figure 3C). Similarly, the numbers of grooming bouts before and after spray in Δe24–/– mice and grooming bouts after spray in Δe24+/– mice were significantly abbreviated compared with those in e24+/+ controls (Figure 3C). In the hole-board test, Δe24–/– mice investigated a significantly greater number of holes than e24+/+ controls. However, no genotype differences were observed for the total number of head pokes (Figure 3D). Hence, while social behaviors in certain contexts are abnormal in the Δe24 mutants, they displayed changes in induced grooming and hole-board tests that are not consistent with increased repetitive behaviors but instead suggest that these results may be cofounded by their hyperactivity.
The hyperactivity of the Δe24–/– mice in the open field could be related to a schizophrenia-like phenotype, as some patients with SHANK2 have been diagnosed with psychosis (9, 11). To test this possibility, we examined prepulse inhibition (PPI), which is frequently decreased in schizophrenic patients (40). We found no significant PPI differences in the Δe24–/– and e24+/+ mice compared with e24+/+ controls for the 4, 8, or 12 dB prepulses (Supplemental Figure 3D). In addition, no significant genotype effects were observed in response to a 120-dB startle stimulus.
Cognitive impairment is commonly associated with SHANK2 mutations in humans (4, 5). To determine whether the Shank2 mutant mice also presented with this deficiency, they were tested in the Morris water maze (MWM). Relative to the e24+/+ and Δe24+/– mice, the Δe24–/– animals were significantly impaired in spatial learning in the MWM, as demonstrated by their increased swim distances and swim times to locate the hidden platform during acquisition and reversal testing (Figure 3, E and F, and Supplemental Figure 4, A and B). In probe tests, the deficiency in the Δe24–/– mice was evident on day 4 of acquisition and on days 10 and 12 of reversal testing (Supplemental Figure 4, C and D). In contrast, no genotype distinctions were noted in the visible platform test (Supplemental Figure 4E), indicating that the impaired performance of the Δe24–/– mice could not be attributed to alterations in sensory or motor performance or reduced motivation.
Shank2 deficiency in the forebrain results in mania-like behaviors.
To examine whether certain brain regions might be responsible for the observed mania-like behaviors, we took advantage of the e24flox line and various lines of Cre mice (Figure 4A). Shank2 is highly expressed in Purkinje cells (PCs) of the cerebellar cortex as well as in the neocortex and hippocampus (ref. 41 and Supplemental Figure 5A). We therefore generated mice with Shank2 selectively disrupted either in cerebellar PCs or in excitatory neurons of the neocortex and hippocampus by crossing e24flox mice to Pcp2-Cre (Δe24Pcp2–/–) or to Emx1-Cre (Δe24Emx1–/–) mice, respectively. Expression of Pcp2-Cre begins at postnatal day 6 specifically in cerebellar PCs (42), whereas Emx1-Cre is first expressed in excitatory neurons in the neocortex and hippocampus at embryonic day E10.5 (43). The Pcp2-Cre– and Emx1-Cre–induced deletions of Shank2 were confirmed by DNA and protein analyses in the respective brain regions (Figure 4, B and C). Similar to the global Δe24–/– mice, the latency to fall from the rotarod was significantly abbreviated in Δe24Pcp2–/– mice (Figure 5A) but not in Δe24Emx1–/– mice compared with their e24+/+ controls (Figure 5B). In the open field, no differences in locomotor activity were observed between the Δe24Pcp2–/– and the e24+/+ mice (Figure 5C), whereas activities in the Δe24Emx1–/– mice recapitulated the hyperactivity phenotype seen in the global Δe24–/– mice (Figure 1E and Figure 5D).
Figure 4. Generation of Shank2 deficiency in the cerebellum, neocortex, and hippocampus.

(A) Scheme for generating Δe24Pcp2–/–, Δe24Emx1–/–, and Δe24CKII–/– mice. Each of the Cre drivers deleted exon 24 of Shank2 in the respective cerebellum, neocortex, and hippocampus. (B) PCR genotyping from Δe24Pcp2–/–, Δe24Emx1–/–, and Δe24CKII–/– brain tissues. H, hippocampus; CB, cerebellum; CX, cortex; STR, striatum. (C) Western blots for SHANK2 demonstrate cerebellar-specific loss in Δe24Pcp2–/– mice and cortical and hippocampal loss in Δe24Emx1–/– mice. LIV, liver.
Figure 5. Shank2 deficiency in the neocortex and hippocampus recapitulates the mania-like behavior in global Δe24–/– mice.

(A and B) Motor performance on the rotarod was abnormal (A) in Δe24Pcp2–/– mice (RMANOVA: *P < 0.05, +/+ vs. Pcp2–/– mice; n = 6 for Pcp2–/– and n = 15 for +/+ mice), whereas (B) Δe24Emx1–/– mice were unaffected on this task (n = 12–13 mice/genotype). (C and D) Locomotor activities in the open field for (C) Δe24Pcp2–/– mice were indistinguishable from e24+/+ controls, whereas locomotion was augmented (D) in Δe24Emx1–/– mice relative to e24+/+ mice (RMANOVA: *P < 0.05, +/+ vs. Emx1–/– mice; n = 14–15 for Pcp2–/– and +/+ mice and n = 7–9 for Emx1–/– and +/+ mice). (E) Locomotor activities in the open field for Δe24CKII–/– mice were not different from their e24+/+ controls (n = 8–12 mice/genotype). (F) In the Morris water maze, acquisition of the task was prolonged in Δe24Emx1–/– mice relative to e24+/+ controls (RMANOVA: *P < 0.05, +/+ vs. Emx1–/– mice; n = 11–13 mice/genotype). (G) In the sociability test, the social affiliation preference score of Δe24Emx1–/– was borderline higher (RMANOVA: P = 0.067) in male and significantly higher in female (RMANOVA: *P < 0.05) Δe24Emx1–/– mice. NSNS, nonsocial-nonsocial pairing; NSS1, nonsocial-novel social 1 pairing (n = 8–11 mice/genotype/sex). (H) Acute administration of VPA attenuated the hyperactivity in Δe24Emx1–/– mice compared with that of vehicle-treated (VEH-treated) mutants (2-way ANOVA: *P < 0.05, +/+ vs. –/–; &P < 0.05, +/+ vs. –/– VPA-treated; ^P < 0.05, VPA-treated vs. vehicle-treated –/–), whereas locomotion in e24+/+ mice was unaffected by this treatment (n = 11–15 mice/genotype/treatment).
To study the developmental onset of the hyperactivity phenotype, Shank2flox mice were also bred with CamKII-Cre mice, since Cre is not expressed in forebrain pyramidal neurons until approximately P20. In the CamKII-Cre Shank2 mice, Shank2 deletion was evident at the genomic DNA level by PCR (Figure 4B) but the loss of SHANK2 protein by immunoblot was not apparent, because this Cre is only expressed in a small percentage of pyramidal neurons (data not shown). Likewise, we could not directly confirm the cell-type–specific changes in SHANK2 expression, because of the poor performance of the antibody for immunocytochemistry. Interestingly, the hyperactivity phenotype was not observed in the Δe24CamKII–/– mice (Figure 5E). These observations support a temporal and spatial origin for SHANK2 deficiency producing mania-like behavior in mice.
To determine whether other behaviors in the Δe24Emx1–/– mice also phenocopied the mania-like responses of the global Δe24–/– mice, we subjected these mutants to additional tests. The Δe24Emx1–/– mice were deficient in the MWM task (Figure 5F and Supplemental Figure 5B). In contrast to Δe24–/– male mice, which had a borderline low social preference score (Figure 3A), the social preference score in the social affiliation test was borderline but also significant in male Δe24Emx1–/– mice and significantly higher in Δe24Emx1–/– female mice (Figure 5G); it is unclear whether this increased social affiliation behavior arises from a disruption in local circuitry or some other factor. To ascertain whether the hyperactivity in the Δe24Emx1–/– mice was responsive to mood stabilizers, mice were treated acutely with VPA and tested in the open field; VPA reduced the hyperactivity of the Δe24Emx1–/– mice (Figure 5H). Hence, the behaviors of the Δe24Emx1–/– mice bore some similarities to the global Δe24–/– mice. Together, our findings indicate that Shank2 plays an important role in the excitatory neurons of the forebrain during early brain development and that alterations in the expression of this gene may predispose the subject to mania-like behavior as an adult.
Reduction in PSD thickness in hippocampi of Shank2 mutant mice.
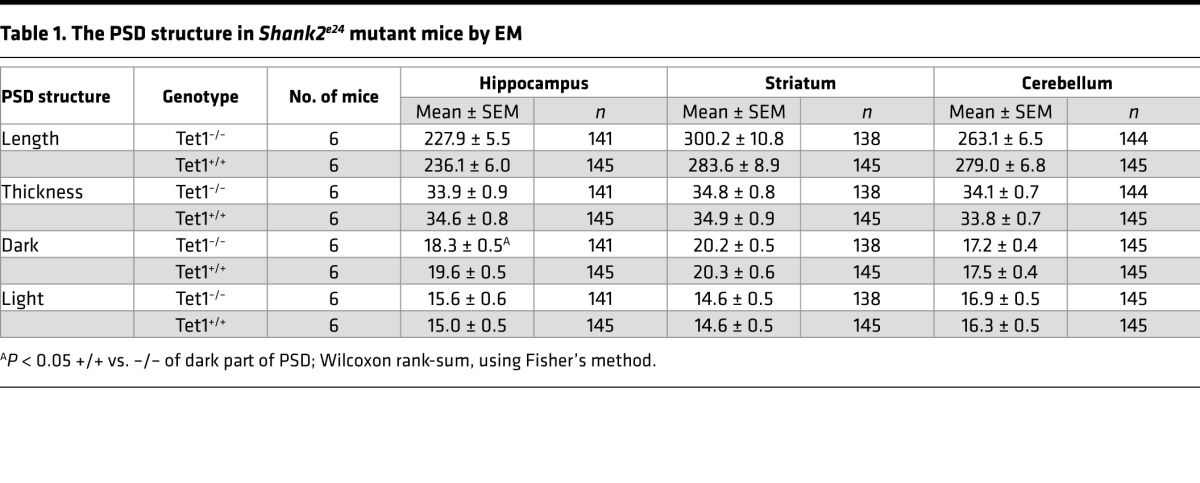
Since SHANK2 protein is highly enriched in the PSD, we hypothesized that the molecular mechanism underlying mania-like behavior in Shank2-deficient mice may involve the disruption of synaptic scaffolds. We performed electron microscopy, focusing on the glutamatergic axospinous synapses from the CA1 hippocampus, dorsal striatum, and cerebellum (Figure 6A). No significant differences in PSD structure between Shank2 Δe24–/– and Δe24+/+ mice were seen in the cerebellum and striatum, whereas a slight but significant reduction in the dark part of PSD (where the NMDA receptor [NMDAR] is localized) (44) was seen in hippocampal CA1 synapses from Δe24–/– mice (Table 1).
Figure 6. Altered PSD ultrastructure, NMDAR- and AMPAR-mediated currents, and the expression of NMDAR subunits in Δe24–/– hippocampus.

(A) PSD structure in synapses of hippocampus CA1, striatum, and cerebellum of e24+/+ and Δe24–/– mice by electron microscopy. Note the slight but statistically significant reduction of dark part of PSD in hippocampal CA1 synapses but not striatal and cerebellar synapses in Δe24–/– mice (see Table 1). Scale bar: 200 mm. (B and C) The NMDA currents in hippocampal CA1 neurons of Δe24–/– mice were reduced in response to the bath application of NMDA than those from e24+/+ mice. Traces and image of a cell being patched for recording in B (original magnification, ×40) and quantification of NMDA-induced currents for e24+/+ and Δe24–/– mice in B (unpaired 2-tailed t test, *P < 0.05, +/+ vs. –/– mice; n = 14–16 cells /genotype). (D) Representative traces of evoked NMDAR eEPSCs (at +40 mV) and AMPAR EPSCs (at –70 mV) from whole cells recorded in hippocampal CA1 neurons from Δe24+/+ (black) and Δe24–/– (red) mice. Both of NMDA and AMPA currents were elicited by a 0.25-ms duration and 300-μA stimulation intensity. (E) Reduced NMDAR-mediated eEPSCs in hippocampal CA1 neurons of Δe24–/– mice (+/+ vs. –/–; P = 0.001, unpaired 2-tailed t test). (F) Increased AMPAR-mediated EPSCs in hippocampal CA1 neurons of Δe24–/– mice (+/+ vs. –/–; P = 0.006, unpaired 2-tailed t test). (G) Reduced NMDA/AMPA ratio in neurons of Δe24–/– mice (+/+ vs. –/–; P = 0.0009, unpaired t test) (n = 19 neurons from 4 Δe24+/+ mice and n = 15 neurons from 3 Δe24–/– animals; error bars show SEM; unpaired 2-tailed t test, *P < 0.01). (H) NR1 protein was reduced in PSD fractions of Δe24–/– hippocampi compared with Δe24+/+ hippocampi. (I and J) NR2A and NR2B subunit proteins were increased in PSD fractions of Δe24–/– hippocampi compared with Δe24+/+ hippocampi. (K and L) NR2C and NR2D subunit proteins were not significantly altered in PSD fractions of Δe24–/– hippocampi compared with Δe24+/+ hippocampi (n = 3–6 mice/genotype, unpaired 2-tailed t test, *P < 0.01 +/+ vs. –/–). (See complete unedited blots in the supplemental material.)
Table 1. The PSD structure in Shank2e24 mutant mice by EM.
NMDAR composition and function are altered in Shank2 Δe24–/– neurons.
The SHANK family proteins function as scaffolds at the PSD; they interact with NMDAR and AMPAR receptors through other synaptic proteins (1). We hypothesized that the disruption of SHANK2 in the PSD might alter NMDAR- or AMPAR-mediated synaptic function. To test this hypothesis, we conduced electrophysiological studies using the patch clamp method in hippocampal slices. We found that Δe24–/– neurons had significantly reduced NMDA-induced currents in response to bath application of NMDA (Figure 6, B and C). To further examine whether AMPA current may also be affected in hippocampal neurons, we conduced whole-cell recording. By measuring NMDA and AMPA currents in the same cells, we could also compute the ratio of NMDA to AMPA currents. We found that Δe24–/– neurons had significantly reduced NMDA currents but increased AMPA current (Figure 6, D–F). Accordingly, the NMDA to AMPA ratio was significantly reduced (Figure 6G). To determine possible biochemical mechanisms underlying the altered function of NMDA and AMPA receptors, we separated the PSD from other cellular components and used Western blotting to examine the levels of different NMDAR and AMPA receptor subunits in this fraction. We found that the common NR1 subunit was significantly decreased in the hippocampal PSD fraction (Figure 6H). Interestingly, levels of the NR2A and NR2B subunits were significantly increased in the PSD from Δe24–/– hippocampi relative to e24+/+ hippocampi (Figure 6, I and J). In contrast, the levels of NR2C and NR2D subunits were comparable between Δe24–/– and e24+/+ fractions (Figure 6, K and L). However, we did not detect any significant difference for the AMPAR GluA1 and GluA2 subunits between the Δe24–/– and e24+/+ hippocampi by quantitative immunoblot (Supplemental Figure 6). We conclude that depletion of SHANK2 protein at hippocampal CA1 synapses leads to a complex dysregulation of NMDARs but did not affect AMPAR subunit expression by immunoblot.
Discussion
Human genetic studies have implicated SHANK2 in a wide spectrum of neuropsychiatric conditions, including ASDs, schizophrenia, intellectual disability, and bipolar disorders (4, 8, 10, 13, 45, 46). Of particular interest to the present study, a small 270-kb duplication that involves SHANK2 exons 17–25 has been identified from a genome-wide copy-number analysis in a proband with bipolar disorder (8). This duplication may disrupt the 3′ portion of the SHANK2 gene, including exon 24 if it occurs in tandem to endogenous SHANK2 (Supplemental Figure 1C). In addition, protein-truncating mutations in exon 24 of SHANK2 have been identified in individuals with ASDs (4, 5, 8, 47). Like many other recent findings in the human genetics of neuropsychiatric disorders, the molecular mechanism underlying the pleotropic effects associated with mutations in single genes is poorly understood (16, 17). The findings of pleotropic behavioral phenotypes in both SHANK2-related disorders in humans and Shank2 mutant mice, however, provide a unique opportunity to dissect the contribution of this gene to mental disorders using the newly proposed Research Domain Criteria framework that aims to understand how molecules are linked to behavior and circuitry (48).
Here, we report results from a line of Shank2Δe24 mice with molecular construct validity for human SHANK2-related disorders that maybe superior to that of the existing lines of Shank2 mutant mice bearing deletions of exon 6 (Δe6) or exons 6–7 (Δe6–7) related to bipolar disorder (26, 27). Shank2Δe24 mice are hyperactive in the open field, display abnormalities in coordination and balance, have perturbed circadian rhythms, engage in increased reward-seeking behaviors, display anhedonia-like behavior, have altered social behaviors, and are impaired in cognitive function. While the phenotypic profile of our mice is generally consistent with the spectrum of clinical features ascribed to SHANK2-related disorders in humans, it is noteworthy that a number of prominent phenotypic traits in our mice resemble behaviors seen in bipolar mania. First, the hyperactivity of the Δe24 mice in the open field is dramatic. In a similar open-field paradigm, individuals with bipolar disorder showed a pattern of locomotor activity strikingly similar to that observed in our Δe24 mice (49). Second, the abnormal circadian rhythm of motor performance in Δe24 mice resembles the disruption of sleep patterns commonly encountered in episodes of bipolar mania (33, 50). Third, Δe24–/– mice display elevated press rates on the RR20 schedule during operant conditioning. The increased press rate is abolished by extinction and returns during reinstatement, suggesting an enhancement in reward-seeking behavior that is distinct from hyperlocomotion in this specific situation. However, we noted that both the press rates on a continuous reinforcement schedule and the progressive ratio breakpoints are similar between genotypes. This finding may suggest that hypermotivated behavior is only within a certain range of lever press/reward ratios. Fourth, the Δe24 mice show anhedonia-like behavior, which is considered a feature of depression in human. These abnormal behaviors provide support for the face validity of our model for bipolar disorder (51). The behavioral responses to VPA and lithium, two common mood stabilizers used in treating human bipolar disorder (52), support the predictive validity of Δe24 mutant mice as a model of the illness.
Our findings with Δe24 mice are consistent with the possibility that SHANK2 plays a role in bipolar disorder in humans (8). Shank2Δe24 mice represent a valuable model for dissecting the pathophysiology of SHANK2-related disorders in humans and may assist in the development of new treatments for bipolar mania. The behavioral abnormalities observed in the Shank2 mutant mice also suggest that further genetic studies of SHANK2 in patients with bipolar disorder are warranted. Because of the high GC content in the SHANK2 gene, the coverage in whole-exome sequencing using a standard capture kit is not optimal; thus, Sanger sequencing may be necessary to search for SHANK2 mutations in individuals with bipolar disorder.
Similar to the pleotropic phenotypes seen in human SHANK2-related disorders, different Shank2 mutations in mice also resulted in varied phenotypes. Two separate mutations, Δe6 and Δe6–7, have been introduced into mice globally or specifically in the cerebellar PCs (26, 27, 53, 54). While the molecular consequences of the Δe6 and the Δe6–7 deletions may be expected to be similar, there are significant differences in the behaviors and synaptic functions in these two lines of Shank2 mutant mice (Supplemental Table 4). For example, open-field hyperactivity was observed in the Δe6 and Δe6–7 mutant mice. However, the hyperactivity in Δe6–7–/– mice habituated rapidly over time (27), unlike that in the Δe24–/– mice. Studies with Shank2 Δe6–/– or Δe6–7–/– deficiency restricted to cerebellar PCs also revealed different phenotypes using different lines of Cre-transgenic mice (53, 54). In addition, although change in synaptic proteins and synaptic function related to NMDAR responses has also been reported also in both Δe6–/– and Δe6–7–/– mice, differences were observed between them (Supplemental Table 4).
The nature of the mutations in different lines of Shank2 mutant mice and the possible gene interactions in their genetic backgrounds may contribute to these phenotypic differences. For instance, the presence of more than one promoter at the 5′ end and the alternative splicing of coding exons in Shank2 (55, 56) may contribute to the mouse line distinctions, due to isoform-specific disruption from the targeted mutations in exons 6, 7, and 24. Alternatively, genetic or nongenetic modifiers can modulate the penetrance and expressivity of various phenotypes. For example, in some families with ASDs, a “two-hit” genetic model involving SHANK2 and a CYFIP1-related copy number variant may explain the variable penetrance (57). The various lines of Shank2 mutant mice make it possible to test the two-hit and other hypotheses and to dissect the molecular mechanisms underlying the shared genetic susceptibilities among SHANK2 patients presenting with different neuropsychiatric phenotypes.
Understanding alterations in the neural circuitry may help to dissect the heterogeneity in presentation of SHANK2 patients. While the neural circuitry and pathophysiology underlying bipolar disorder and autism remain poorly defined, neuroimaging studies of patients with bipolar disorder suggest that at least two separate neural circuits are dysfunctional: a prefrontal-hippocampal-amygdala circuit implicated in empathy and a ventrolateral/orbitofrontal-ventral striatal pathway that subserves reward processing (58–60). For example, the open-field hyperactivity and abnormal operant responses in the global Δe24–/– mice support a role for the ventrolateral/orbitofrontal-ventral striatal circuitry in the expression of the bipolar mania-like and risk-taking/reward-seeking behaviors. In contrast, alterations in social behavior and cognition may be due to changes within the prefrontal-hippocampal-amygdala pathway. Additionally, the impaired performance of the Shank2EMX–/– mice in the MWM suggests that SHANK2 in the prefrontal-hippocampal circuit is critical for cognitive functions in these mice. However, more definitive studies will need to be conducted in the future to identify which and what parts of neural circuits are dysfunctional in the Shank2 e24 mutant mice.
NMDARs have long been known to play a key role in cognitive behaviors. The composition of NMDAR subunits at Δe24–/– hippocampal CA1 synapses is modified and NMDAR function is attenuated in mutants, suggesting that alterations in NMDA-mediated responses in excitatory neurons in the Shank2EMX–/– forebrain may underlie some of the observed comorbidities in these mutants. For instance, it is well-known that inhibition of NMDAR function through pharmacologic or genetic manipulation can lead to hyperactivity in the open field (40, 61, 62). Since both Shank2 and Shank3 mutant mice have alterations in NMDAR subunit expression and NMDA responses (1, 63–65), comparative studies between these lines of mutant mice may reveal whether the same neural circuitry and molecular mechanisms modulate their abnormal behaviors.
To date, modeling of bipolar disorders in animals has been challenging (24, 66–68). Few animal models have met criteria as adequate preclinical models for the disorder. Here, we present evidence in support of the Shank2Δe24 mouse as a credible model with construct, face, and some predictive validity for bipolar mania-like behavior. This line of Shank2 mice provides an opportunity to dissect the molecular and neural circuit mechanisms that underlie bipolar disorder, and it offers a pathophysiological model for the development of new treatments.
Methods
Generation of Shank2e24flox mice.
A Shank2-targeting construct was prepared using a recombineering method (69). A 129SvEv BAC clone (bMQ457K21) covering the entire Shank2 gene was first identified in silico using the Ensembl mouse genome browser (http://www.ensembl.org/index.html), and the clone was obtained from Geneservice (https://www.uk.com/) (70) A 12.2-kb genomic fragment containing exon 24 (2,407 bp) of the Shank2 gene was retrieved into a plasmid from the BAC clone. A neomycin selectable marker was inserted into plasmid Shank2-X that was flanked by FRT sites. Two loxP sites were inserted into the plasmid flanking exon 24 (Figure 1A). The final targeting plasmid (Shank2-XY) was linearized with NotI and electroporated into 1 × 10⁷ 129R1 embryonic stem (ES) cells as previously described (71). Neomycin-resistant colonies were picked after 7–8 days of selection. DNA from ES cells was analyzed by a mini-Southern blot hybridization using the 5′ probe to identify clones undergoing homologous recombination. Shank2e24flox ES cells were expanded and injected into C57BL/6J blastocysts to obtain germline transmission of e24flox mice.
Generation of Shank2 exon 24 deletion.
Δe24+/– mice were generated by breeding e24flox mice to CMV-Cre mice. Δe24+/– mice were backcrossed to C57BL/6J mice for at least 5 generations prior to conducting all studies. The naturally occurring Disc1 mutation in 129R1 ES cells was segregated from the Shank2-targeted mutation during backcrossing. The Δe24–/–, Δe24+/–, and Δe24+/+ mice used for the experiments were produced from the breeding between Δe24+/– male and Δe24+/– female mice. WT littermates of Δe24–/– and Δe24+/– mice were used as controls for all experiments. Genotyping was performed by PCR using the primers listed in Supplemental Table 2. Three primers were used (SH2-F, SH2-R1 and SH2-R2), resulting in the WT (571 bp), floxed (666 bp), and mutant (951 bp) bands (Figure 1, A–C).
Production of Shank2Δe24, Shank2Δe24–Pcp2, Shank2Δe24–Emx1, and Shank2Δe24–CKIImice. Shank2Δe24–Pcp2, Shank2Δe24–Emx1, and Shank2Δe24–CamKII mutant mice were generated by crossing Shank2e24–flox mice to Pcp2-Cre, Emx1-Cre mice that were purchased from the Jackson Laboratory [4146, PCP2-cre mice (Tg(Pcp2-cre)2Mpin; 5628, B6.129S2-Emx1tm1(cre)Krj/J; and 5359, B6.Cg-Tg(Camk2a-cre)T29-1Stl/J mice, respectively]. WT littermates for each breeding were used as controls for all experiments.
RNA isolation and RT-PCR analysis.
Total RNA was isolated using the Trizol method (72). For RT-PCR analysis, DNase I–treated total RNA was reverse transcribed with Superscript RNase H-reverse transcriptase (Invitrogen) using random hexamers. PCR was performed in 50 μl reactions using the primers listed in Supplemental Table 2.
Preparation of synaptic plasma membranes and PSD fraction and quantitative immunoblot analysis.
Isolation of PSDs was performed as outlined previously (73) with some modifications. Protease and phosphatase inhibitors were used throughout except in the final centrifugation step. Briefly, brains from 2- to 4-month-old mice were homogenized in HEPES-buffered sucrose (0.32 M sucrose, 4 mM HEPES, pH 7.4) and centrifuged at 800 g for 10 minutes at 4°C. After washing the pellet (P1) and sedimenting it under the same conditions (P2), the P3 membrane fraction was separated from the cytosolic fraction by centrifugation at 25,000 g for 20 minutes. This was followed by sucrose density gradient (0.8:1.0:1.2 M sucrose) centrifugation for 120 minutes at 150,000 g; synaptic plasma membranes (SPMs) were collected at the 1.0–1.2 M interface. SPMs were resuspended in 50 mM HEPES (pH 7.4), 2 mM EDTA. The PSD-I fraction was obtained by a 15-minute incubation of the SPM at 4°C in a buffer containing 0.5% Triton X-100, followed by centrifugation at 32,000 g for 20 minutes.
Quantitative immunoblot analyses.
Equal amounts of brain cytosolic proteins or proteins from the PSD and synaptosomal (i.e., SPM) fractions were separated by SDS-PAGE. Proteins were transferred to PVDF membranes (Bio-Rad). After blocking the membranes at room temperature for 1 hour in TBS (Tris-buffered saline) with 5% nonfat dry milk, the blots were incubated with corresponding antibodies at 4°C overnight. Next, the blots were washed in TBS containing 0.1% Tween-20 (TBST) and incubated with HRP-conjugated secondary antibodies for 60 minutes. Following another 3 washes in TBST, the blots were reacted with reagents in an ECL detection kit (GE Healthcare Life Sciences) and exposed to Kodak X-ray film. For quantification, the films were scanned by a UVP image system, and the gray values of each band were quantified by ImageJ (NIH; http://rsb.info.nih.gov/ij/) and normalized to the gray value of tubulin or actin. The detail dilution and other information for each antibody is provided in Supplemental Table 3.
Electron microscopy.
Anesthetized animals were perfused with a mixture of 2% glutaraldehyde and 2% depolymerized paraformaldehyde in 0.1 M PBS. Brains were removed, post-fixed overnight in the same fixative at 4°C, and transferred to PBS. Fifty-μm-thick sections were cut on a Vibratome (Leica). Sections containing regions of interest were treated with osmium tetroxide and uranyl acetate and then dehydrated, infiltrated with Spurr’s resin, flat-embedded between sheets of ACLAR plastic sandwiched between glass coverslips, and polymerized for 48 hours at 60°C. Chips of tissue from regions of interest in CA1 hippocampus and striatum were glued to plastic blocks. Ultrathin (~80-nm-thick) sections were cut on an ultramicrotome, collected on copper mesh grids, post-stained with uranyl acetate and Sato’s lead, and examined with a Philips Tecnai 12 TEM operated at 80 KV. For each grid, we photographed 20 synapses with a Gatan 1,024 × 1,024 pixels 12-bit cooled CCD. Synapses were selected that exhibited clear membrane appositions, suggesting that they were cut approximately normal to the plane of the synaptic membrane. All data collection and analyses were performed in a blinded manner. Measurement was performed offline, using ImageJ software. For each synapse, we measured the length of the synaptic apposition, and the estimated thicknesses of the “dark” (membrane-facing) and “light” (cytoplasm-facing) parts of the PSD. Data were compiled and analyzed using Kaleidagraph software (Synergy Software Inc).
Behavioral analyses.
The Δe24+/+, Δe24+/–, and Δe24–/– mice of both sexes were maintained during behavioral testing under a 14-hour-light/10-hour-dark cycle, with the onset of lights at 0800 hours. All housing and test rooms were maintained on this light cycle, and except for tests requiring a 12:12-hour-light/dark cycle or complete darkness (circadian rhythm), testing was conducted between 0900 and 1500 hours. For studies requiring testing for 24 hours or more, testing began between 1100 and 1200 hours. WT littermates from breeding of e24+/– mice were used as controls for all experiments. Multiple cohorts of mice were used, and the majority of mice were tested with more than one behavioral test, as diagramed Supplemental Table 1. The order of sequential behavior tests has been described previously(71, 74). As a general principle, the least stress test was performed first and sufficient resting time was allowed between the tests. The detailed behavioral protocols can be found in the Supplemental Methods. All behavioral studies were conducted with approved protocols from the Duke University Animal Care and Use Committee, which were in accordance with the NIH Guidelines for the Care and Use of Laboratory Animals (75).
Operant conditioning behavior.
Mice were maintained at 85%–90% of free-feeding body weight. All testing took place in mouse sound- and light-attenuated operant chambers (Med Associates) containing a retractable lever and food cup in which food pellets (14 mg; Rodent Purified Diet; BioServ) could be delivered. At the beginning of each daily test session, the lever was extended and a house light was turned on. At the end of each session the lever retracted and the house light was extinguished. Mice were first trained on a continuous reinforcement schedule in which each lever press yielded one food pellet. Sessions ended after 60 minutes had elapsed or 50 pellets had been earned. Following 7 sessions on a continuous reinforcement schedule, mice were tested on a progressive ratio 5 schedule in which the number of lever presses required to earn a pellet increased by 5 each time a pellet was earned. The breakpoint was calculated as the highest ratio for which mice earned a pellet during a 60-minute session. Mice were then trained on a random ratio schedule of reinforcement in which a pellet was delivered after a randomly chosen number of presses. Mice were trained for 7 sessions on a RR10 schedule (data not shown) in which each press had a 10% probability of yielding a reward followed by 7 sessions of RR20 in which each press had a 5% chance of yielding a reward. Sessions lasted 60 minutes or until mice earned 25 pellets. On the day following the seventh session on the RR20 schedule, mice were tested in extinction (60-minute session), in which the house light was turned on and the lever was extended, but no rewards could be earned. The following day, a rewarded session of RR20 was conducted (reinstatement).
Recording of NMDA-induced current in hippocampal neurons.
Mice at 2–3 months of age were deeply anesthetized with isoflurane and decapitated. Brains were removed and placed into ice-cold cutting solution containing 245 sucrose; 3.0 mM KCl; 7.0 mM MgCl2; 0.5 mM CaCl2; 26 mM NaHCO3; 1.25 mM NaH2PO4; 11 mM glucose (pH 7.4, when bubbled with 95% O2/5% CO2). Transverse hippocampal slices (300 μm) were prepared using a vibrotome (Leica VT1200 S; Leica Microsystems GmbH) and collected into a slice chamber containing artificial cerebrospinal fluid (aCSF) composed of 126 mM NaCl; 3.0 mM KCl; 1.3 mM MgCl2; 2.5 mM CaCl2; 26 mM NaHCO3; 1.25 mM NaH2PO4; 11 mM glucose (pH 7.4, when bubbled with 95% O2 and 5% CO2). The slices were incubated at room temperature (25°C ± 1°C) at least 1 hour before recording.
Slices were transferred to a recording chamber where they were continuously superfused with oxygenated aCSF at a flow rate of 5 ml/min. Neurons located approximately 30–60 μm beneath the hippocampal CA1 area were visualized under infrared differential interference contrast microscopy using Slicescope pro 6000 (Scientifica). The data were acquired using an EPC-10 amplifier (HEKA) and Patchmaster (HEKA). Identified CA1 neurons were recorded using microelectrodes of 5–8 M Ω pulled from borosilicate capillaries (World Precision Instruments) on a micropipette puller (P-97; Sutter Instrument). Whole-cell patch clamp recordings were performed at room temperature (25°C ± 1°C). NMDA-induced currents were recorded at –40 mV holding potentials using an internal solution containing 136 mM K-gluconate; 10 mM NaCl; 1 mM MgCl2; 10 mM EGTA; 10 mM HEPES; 2 mM Mg-ATP; 0.1 mM Na-GTP (pH 7.33 with KOH) and modified aCSF consisting of 126 mM NaCl; 3 mM KCl; 2 mM CaCl2; 26 mM NaHCO3; 1.25 mM NaH2PO4; 11 mM glucose (pH 7.4, when bubbled with 95% O2 and 5% CO2 and with an osmolarity of 305–310 mOsmol), with a cocktail of inhibitors for neurotransmission 100 μM picrotoxin, 2 μM strychnine, and 0.5 μM tetrodotoxin. The amplitude of NMDA currents was measured by the first NMDA application without any repeated administration.
Whole-cell recordings from hippocampal neurons.
Adult mice (2–4 months) were deeply anesthetized with halothane (Sigma-Aldrich) and were euthanized by decapitation. The brains were rapidly removed and placed in ice-cold (<4°C) modified aCSF containing 120 mM NaCl; 3.3 mM KCl; 1.23 mM NaH2PO4; 1 mM MgSO4; 2 mM CaCl2; 25 mM NaHCO3; and 10 mM D-glucose at pH 7.3, previously saturated with 95%O2–5%CO2. Sagittal hippocampal slices (300-μm thick) were cut using a Vibratome series 1000 sectioning system (Vibratome). The brain slices were allowed to recover in oxygenated (95% O2–5% CO2) aCSF at 32°C–33°C for 60 minutes and then kept at room temperature for a further 30 minutes before experiments were conducted. Slices were then transferred to the recording chamber and were perfused by oxygenated aCSF maintained at 30°C with a 2 ml/min flow rate.
Whole-cell recordings were made from hippocampal CA1 pyramidal neurons using IR/differential interference contrast techniques. Signals were recorded using the Multiclamp 700B amplifier (Molecular Devices, Axon Instruments Inc). The responses were filtered at 10 kHz and acquired using Digidata 1440A and pClamp 10.7 (Axon Instruments, Molecular Devices). All data were analyzed by Clampfit 10.7. The pipette solution consisted of 130 mM CsMeSO4; 1 mM MgCl2; 10 mM HEPES; 0.5 mM EGTA; 4 mM Mg-ATP; 0.5 mM Na-GTP; 10 mM phosphocreatine; and 4 mM lidocaine N-ethyl bromide (QX314) (pH adjusted to 7.3 with CsOH [290 mOsm]). The access resistance was monitored throughout each experiment, and only recordings with stable access and holding current for at least 3 minutes were used. Data were excluded from analysis when the series resistance changed by >15%. Evoked postsynaptic currents (eEPSCs) were elicited by stimuli at 0.1 Hz in 0.25-ms duration and 300-μA stimulation intensity. The stimulating electrode was placed within 60–100 μm from the recording neuron under voltage-clamp mode. The eEPSCs were performed in the presence of the GABA-A receptor antagonist picrotoxin (30 μM; Sigma-Aldrich). To obtain the NMDAR to AMPA receptor EPSC ratio, the AMPA receptor EPSC was first recorded in the aCSF solution.
Statistics.
The data were analyzed with SPSS 23 (SPSS Inc.) and expressed as mean ± SEM. Simple comparisons between Shank2e24+/+ and Shank2Δe24–/– mice without regard to sex on single dependent measures or for total consumption or the preference scores for the anhedonia-like study were conducted with 2-tailed independent t tests. In cases in which differences between genotypes were dependent upon sex or test condition, ANOVA tests were used. When comparisons between genotype or sex were made for within-subject measurements across different phases of the same test (e.g., test days, locations within a test arena, or different intensities of stimuli), the data were analyzed with repeated-measures ANOVA (RMANOVA). For all ANOVA and RMANOVA, Bonferroni-corrected pair-wise comparisons were used for the post-hoc analyses. Statistical significance was defined as P < 0.05.
Study approval.
The present studies were approved by the Duke Animal Care and Use Program.
Author contributions
ALP and YHJ conceived the project. ALP generated the Shank2 mutant mice and conducted most of the experiments. change this sentence to WCW and RMR helped design the behavioral studies, and ALP, ALB, and RMR performed the tests. HY, YHK, and RRJ conducted the electrophysiology experiments. ALP, LJD, SMP, and XW conducted the molecular and biochemical experiments. XC did the mouse genotyping. JDD prepared animals for EM study, and RJW analyzed the EM data. ALP, ALB, FP, and RMR performed the statistical analysis. MR and HHY conducted the lever press test. ALP, ALB, RJW, WCW, and YHJ wrote the manuscript.
Supplementary Material
Acknowledgments
We would like to thank Susan Burette and Kristen Phend for their help with histological processing and measurements of the electron microscopy studies, Vineet Nadkarni for help with statistical analysis of some behavioral data, and Elizabeth Ruzzo for critical reading of the manuscript. In addition, we thank P.J. Nichols of the Department of Cell Biology, Duke University, for his insightful discussions pertaining to the lithium and valproate open-field studies. Christopher Means and Theodore Rhodes provided technical support, training of researchers, and husbandry of the mice during behavioral studies. YHJ was supported by NIH grants MH098114, MH104316, and HD087795 as well as awards from Autism Speaks and the Ruth K. Broad Foundation. XW was supported by a fellowship from the Phelan-McDermid Syndrome Foundation. RJW was supported by NIH grant NS039444. ALB was supported by the Ruth K. Broad and Autism Science Foundations and the Duke Medical Scientist Training Program (T32 GM007171). WCW was supported by NIH grant U19MH082441. HHY was supported by NIH grants DA040701, MH112883, and NS094754. YHJ and WCW were supported by an incubator award from the Duke Institute for Brain Science.
Version 1. 10/19/2017
Electronic publication
Footnotes
Conflict of interest: The authors have declared that no conflict of interest exists.
Reference information: JCI Insight. 2017;2(19):e92052. https://doi.org/10.1172/jci.insight.92052.
Contributor Information
Xiaoming Wang, Email: xiaoming.wang@duke.edu.
Mark Rossi, Email: markrossi21@gmail.com.
Yong Ho Kim, Email: eruo16@gmail.com.
Haidun Yan, Email: haidun.yan@duke.edu.
Fiona Porkka, Email: fiona.porkka@duke.edu.
Lara J. Duffney, Email: lara.duffney@duke.edu.
Samantha M. Phillips, Email: sphillips1093@gmail.com.
Xinyu Cao, Email: xinyu.cao@duke.edu.
Jin-dong Ding, Email: jindong.ding@duke.edu.
Richard J. Weinberg, Email: rjw@med.unc.edu.
Ru-Rong Ji, Email: ru-rong.ji@duke.edu.
Yong-hui Jiang, Email: yong-hui.jiang@duke.edu.
References
- 1.Jiang YH, Ehlers MD. Modeling autism by SHANK gene mutations in mice. Neuron. 2013;78(1):8–27. doi: 10.1016/j.neuron.2013.03.016. [DOI] [PMC free article] [PubMed] [Google Scholar]
- 2.Boeckers TM, et al. Proline-rich synapse-associated proteins ProSAP1 and ProSAP2 interact with synaptic proteins of the SAPAP/GKAP family. Biochem Biophys Res Commun. 1999;264(1):247–252. doi: 10.1006/bbrc.1999.1489. [DOI] [PubMed] [Google Scholar]
- 3.Durand CM, et al. SHANK3 mutations identified in autism lead to modification of dendritic spine morphology via an actin-dependent mechanism. Mol Psychiatry. 2012;17(1):71–84. doi: 10.1038/mp.2011.57. [DOI] [PMC free article] [PubMed] [Google Scholar]
- 4.Berkel S, et al. Mutations in the SHANK2 synaptic scaffolding gene in autism spectrum disorder and mental retardation. Nat Genet. 2010;42(6):489–491. doi: 10.1038/ng.589. [DOI] [PubMed] [Google Scholar]
- 5.Leblond CS, et al. Meta-analysis of SHANK mutations in autism spectrum disorders: a gradient of severity in cognitive impairments. PLoS Genet. 2014;10(9):e1004580. doi: 10.1371/journal.pgen.1004580. [DOI] [PMC free article] [PubMed] [Google Scholar]
- 6.Sato D, et al. SHANK1 deletions in males with autism spectrum disorder. Am J Hum Genet. 2012;90(5):879–887. doi: 10.1016/j.ajhg.2012.03.017. [DOI] [PMC free article] [PubMed] [Google Scholar]
- 7.Guilmatre A, Huguet G, Delorme R, Bourgeron T. The emerging role of SHANK genes in neuropsychiatric disorders. Dev Neurobiol. 2014;74(2):113–122. doi: 10.1002/dneu.22128. [DOI] [PubMed] [Google Scholar]
- 8.Noor A, et al. Copy number variant study of bipolar disorder in Canadian and UK populations implicates synaptic genes. Am J Med Genet B Neuropsychiatr Genet. 2014;165B(4):303–313. doi: 10.1002/ajmg.b.32232. [DOI] [PubMed] [Google Scholar]
- 9.Peykov S, et al. Identification and functional characterization of rare SHANK2 variants in schizophrenia. Mol Psychiatry. 2015;20(12):1489–1498. doi: 10.1038/mp.2014.172. [DOI] [PMC free article] [PubMed] [Google Scholar]
- 10.Gauthier J, et al. De novo mutations in the gene encoding the synaptic scaffolding protein SHANK3 in patients ascertained for schizophrenia. Proc Natl Acad Sci U S A. 2010;107(17):7863–7868. doi: 10.1073/pnas.0906232107. [DOI] [PMC free article] [PubMed] [Google Scholar]
- 11.Homann OR, et al. Whole-genome sequencing in multiplex families with psychoses reveals mutations in the SHANK2 and SMARCA1 genes segregating with illness. Mol Psychiatry. 2016;21(12):1690–1695. doi: 10.1038/mp.2016.24. [DOI] [PMC free article] [PubMed] [Google Scholar]
- 12.Vucurovic K, et al. Bipolar affective disorder and early dementia onset in a male patient with SHANK3 deletion. Eur J Med Genet. 2012;55(11):625–629. doi: 10.1016/j.ejmg.2012.07.009. [DOI] [PubMed] [Google Scholar]
- 13.Denayer A, et al. Neuropsychopathology in 7 patients with the 22q13 deletion syndrome: presence of bipolar disorder and progressive loss of skills. Mol Syndromol. 2012;3(1):14–20. doi: 10.1159/000339119. [DOI] [PMC free article] [PubMed] [Google Scholar]
- 14.Verhoeven WM, Egger JI, Willemsen MH, de Leijer GJ, Kleefstra T. Phelan-McDermid syndrome in two adult brothers: atypical bipolar disorder as its psychopathological phenotype? Neuropsychiatr Dis Treat. 2012;8:175–179. doi: 10.2147/NDT.S30506. [DOI] [PMC free article] [PubMed] [Google Scholar]
- 15.Geschwind DH, Flint J. Genetics and genomics of psychiatric disease. Science. 2015;349(6255):1489–1494. doi: 10.1126/science.aaa8954. [DOI] [PMC free article] [PubMed] [Google Scholar]
- 16.O’Donovan MC, Owen MJ. The implications of the shared genetics of psychiatric disorders. Nat Med. 2016;22(11):1214–1219. doi: 10.1038/nm.4196. [DOI] [PubMed] [Google Scholar]
- 17.Zhu X, Need AC, Petrovski S, Goldstein DB. One gene, many neuropsychiatric disorders: lessons from Mendelian diseases. Nat Neurosci. 2014;17(6):773–781. doi: 10.1038/nn.3713. [DOI] [PubMed] [Google Scholar]
- 18.Kerner B. Toward a deeper understanding of the genetics of bipolar disorder. Front Psychiatry. 2015;6:105. doi: 10.3389/fpsyt.2015.00105. [DOI] [PMC free article] [PubMed] [Google Scholar]
- 19.O’Donovan MC, Craddock NJ, Owen MJ. Genetics of psychosis; insights from views across the genome. Hum Genet. 2009;126(1):3–12. doi: 10.1007/s00439-009-0703-0. [DOI] [PubMed] [Google Scholar]
- 20.Rao AR, Yourshaw M, Christensen B, Nelson SF, Kerner B. Rare deleterious mutations are associated with disease in bipolar disorder families. Mol Psychiatry. 2017;22(7):1009–1014. doi: 10.1038/mp.2016.181. [DOI] [PMC free article] [PubMed] [Google Scholar]
- 21.Goes FS, et al. Exome sequencing of familial bipolar disorder. JAMA Psychiatry. 2016;73(6):590–597. doi: 10.1001/jamapsychiatry.2016.0251. [DOI] [PMC free article] [PubMed] [Google Scholar]
- 22.Slattery DA, Cryan JF. The ups and downs of modelling mood disorders in rodents. ILAR J. 2014;55(2):297–309. doi: 10.1093/ilar/ilu026. [DOI] [PubMed] [Google Scholar]
- 23.Chen G, Henter ID, Manji HK. Translational research in bipolar disorder: emerging insights from genetically based models. Mol Psychiatry. 2010;15(9):883–895. doi: 10.1038/mp.2010.3. [DOI] [PMC free article] [PubMed] [Google Scholar]
- 24.Perry W, et al. A reverse-translational study of dysfunctional exploration in psychiatric disorders: from mice to men. Arch Gen Psychiatry. 2009;66(10):1072–1080. doi: 10.1001/archgenpsychiatry.2009.58. [DOI] [PMC free article] [PubMed] [Google Scholar]
- 25.Henry BL, Minassian A, Young JW, Paulus MP, Geyer MA, Perry W. Cross-species assessments of motor and exploratory behavior related to bipolar disorder. Neurosci Biobehav Rev. 2010;34(8):1296–1306. doi: 10.1016/j.neubiorev.2010.04.002. [DOI] [PMC free article] [PubMed] [Google Scholar]
- 26.Schmeisser MJ, et al. Autistic-like behaviours and hyperactivity in mice lacking ProSAP1/Shank2. Nature. 2012;486(7402):256–260. doi: 10.1038/nature11015. [DOI] [PubMed] [Google Scholar]
- 27.Won H, et al. Autistic-like social behaviour in Shank2-mutant mice improved by restoring NMDA receptor function. Nature. 2012;486(7402):261–265. doi: 10.1038/nature11208. [DOI] [PubMed] [Google Scholar]
- 28.Clapcote SJ, Roder JC. Deletion polymorphism of Disc1 is common to all 129 mouse substrains: implications for gene-targeting studies of brain function. Genetics. 2006;173(4):2407–2410. doi: 10.1534/genetics.106.060749. [DOI] [PMC free article] [PubMed] [Google Scholar]
- 29.Minassian A, Young JW, Cope ZA, Henry BL, Geyer MA, Perry W. Amphetamine increases activity but not exploration in humans and mice. Psychopharmacology (Berl) 2016;233(2):225–233. doi: 10.1007/s00213-015-4098-4. [DOI] [PMC free article] [PubMed] [Google Scholar]
- 30. American Psychiatric Association. Diagnostic And Statistical Manual Of Mental Disorders. Arlington, Virginia, USA: American Psychiatric Publishing; 2013. [Google Scholar]
- 31.Petit-Demouliere B, Chenu F, Bourin M. Forced swimming test in mice: a review of antidepressant activity. Psychopharmacology (Berl) 2005;177(3):245–255. doi: 10.1007/s00213-004-2048-7. [DOI] [PubMed] [Google Scholar]
- 32.Steru L, Chermat R, Thierry B, Simon P. The tail suspension test: a new method for screening antidepressants in mice. Psychopharmacology (Berl) 1985;85(3):367–370. doi: 10.1007/BF00428203. [DOI] [PubMed] [Google Scholar]
- 33.Melo MC, et al. Sleep and circadian alterations in people at risk for bipolar disorder: a systematic review. J Psychiatr Res. 2016;83:211–219. doi: 10.1016/j.jpsychires.2016.09.005. [DOI] [PubMed] [Google Scholar]
- 34.Abreu T, Bragança M. The bipolarity of light and dark: a review on Bipolar Disorder and circadian cycles. J Affect Disord. 2015;185:219–229. doi: 10.1016/j.jad.2015.07.017. [DOI] [PubMed] [Google Scholar]
- 35.Pacchiarotti I, et al. The International Society for Bipolar Disorders (ISBD) task force report on antidepressant use in bipolar disorders. Am J Psychiatry. 2013;170(11):1249–1262. doi: 10.1176/appi.ajp.2013.13020185. [DOI] [PMC free article] [PubMed] [Google Scholar]
- 36.Bauer MS, Miller CJ, Li M, Bajor LA, Lee A. A population-based study of the comparative effectiveness of second-generation antipsychotics vs older antimanic agents in bipolar disorder. Bipolar Disord. 2016;18(6):481–489. doi: 10.1111/bdi.12425. [DOI] [PubMed] [Google Scholar]
- 37.Han K, et al. SHANK3 overexpression causes manic-like behaviour with unique pharmacogenetic properties. Nature. 2013;503(7474):72–77. doi: 10.1038/nature12630. [DOI] [PMC free article] [PubMed] [Google Scholar]
- 38.Einat H. Establishment of a battery of simple models for facets of bipolar disorder: a practical approach to achieve increased validity, better screening and possible insights into endophenotypes of disease. Behav Genet. 2007;37(1):244–255. doi: 10.1007/s10519-006-9093-4. [DOI] [PubMed] [Google Scholar]
- 39.Berkel S, et al. Inherited and de novo SHANK2 variants associated with autism spectrum disorder impair neuronal morphogenesis and physiology. Hum Mol Genet. 2012;21(2):344–357. doi: 10.1093/hmg/ddr470. [DOI] [PMC free article] [PubMed] [Google Scholar]
- 40. Geyer MA, Moghaddam B. Animal Models Relevant To Schizophrenia Disorders. Philadelphia, Pennsylvania, USA: Lippincott Williams & Wilkins; 2002. [Google Scholar]
- 41.Böckers TM, et al. Differential expression and dendritic transcript localization of Shank family members: identification of a dendritic targeting element in the 3′ untranslated region of Shank1 mRNA. Mol Cell Neurosci. 2004;26(1):182–190. doi: 10.1016/j.mcn.2004.01.009. [DOI] [PubMed] [Google Scholar]
- 42.Barski JJ, Dethleffsen K, Meyer M. Cre recombinase expression in cerebellar Purkinje cells. Genesis. 2000;28(3–4):93–98. [PubMed] [Google Scholar]
- 43.Gorski JA, Talley T, Qiu M, Puelles L, Rubenstein JL, Jones KR. Cortical excitatory neurons and glia, but not GABAergic neurons, are produced in the Emx1-expressing lineage. J Neurosci. 2002;22(15):6309–6314. doi: 10.1523/JNEUROSCI.22-15-06309.2002. [DOI] [PMC free article] [PubMed] [Google Scholar]
- 44.Valtschanoff JG, Weinberg RJ. Laminar organization of the NMDA receptor complex within the postsynaptic density. J Neurosci. 2001;21(4):1211–1217. doi: 10.1523/JNEUROSCI.21-04-01211.2001. [DOI] [PMC free article] [PubMed] [Google Scholar]
- 45.Costas J. The role of SHANK2 rare variants in schizophrenia susceptibility. Mol Psychiatry. 2015;20(12):1486. doi: 10.1038/mp.2015.119. [DOI] [PubMed] [Google Scholar]
- 46.Durand CM, et al. Mutations in the gene encoding the synaptic scaffolding protein SHANK3 are associated with autism spectrum disorders. Nat Genet. 2007;39(1):25–27. doi: 10.1038/ng1933. [DOI] [PMC free article] [PubMed] [Google Scholar]
- 47.Leblond CS, et al. Genetic and functional analyses of SHANK2 mutations suggest a multiple hit model of autism spectrum disorders. PLoS Genet. 2012;8(2):e1002521. doi: 10.1371/journal.pgen.1002521. [DOI] [PMC free article] [PubMed] [Google Scholar]
- 48.Insel T, et al. Research domain criteria (RDoC): toward a new classification framework for research on mental disorders. Am J Psychiatry. 2010;167(7):748–751. doi: 10.1176/appi.ajp.2010.09091379. [DOI] [PubMed] [Google Scholar]
- 49.Perry W, Minassian A, Henry B, Kincaid M, Young JW, Geyer MA. Quantifying over-activity in bipolar and schizophrenia patients in a human open field paradigm. Psychiatry Res. 2010;178(1):84–91. doi: 10.1016/j.psychres.2010.04.032. [DOI] [PMC free article] [PubMed] [Google Scholar]
- 50.Young JW, Minassian A, Paulus MP, Geyer MA, Perry W. A reverse-translational approach to bipolar disorder: rodent and human studies in the Behavioral Pattern Monitor. Neurosci Biobehav Rev. 2007;31(6):882–896. doi: 10.1016/j.neubiorev.2007.05.009. [DOI] [PMC free article] [PubMed] [Google Scholar]
- 51.van Enkhuizen J, Geyer MA, Minassian A, Perry W, Henry BL, Young JW. Investigating the underlying mechanisms of aberrant behaviors in bipolar disorder from patients to models: rodent and human studies. Neurosci Biobehav Rev. 2015;58:4–18. doi: 10.1016/j.neubiorev.2015.08.008. [DOI] [PMC free article] [PubMed] [Google Scholar]
- 52.Schloesser RJ, Martinowich K, Manji HK. Mood-stabilizing drugs: mechanisms of action. Trends Neurosci. 2012;35(1):36–46. doi: 10.1016/j.tins.2011.11.009. [DOI] [PubMed] [Google Scholar]
- 53.Peter S, et al. Dysfunctional cerebellar Purkinje cells contribute to autism-like behaviour in Shank2-deficient mice. Nat Commun. 2016;7:12627. doi: 10.1038/ncomms12627. [DOI] [PMC free article] [PubMed] [Google Scholar]
- 54.Ha S, et al. Cerebellar Shank2 regulates excitatory synapse density, motor coordination, and specific repetitive and anxiety-like behaviors. J Neurosci. 2016;36(48):12129–12143. doi: 10.1523/JNEUROSCI.1849-16.2016. [DOI] [PMC free article] [PubMed] [Google Scholar]
- 55.McWilliams RR, Gidey E, Fouassier L, Weed SA, Doctor RB. Characterization of an ankyrin repeat-containing Shank2 isoform (Shank2E) in liver epithelial cells. Biochem J. 2004;380(pt 1):181–191. doi: 10.1042/BJ20031577. [DOI] [PMC free article] [PubMed] [Google Scholar]
- 56.Lim S, et al. Characterization of the Shank family of synaptic proteins. Multiple genes, alternative splicing, and differential expression in brain and development. J Biol Chem. 1999;274(41):29510–29518. doi: 10.1074/jbc.274.41.29510. [DOI] [PubMed] [Google Scholar]
- 57.Leblond CS, et al. Genetic and functional analyses of SHANK2 mutations suggest a multiple hit model of autism spectrum disorders. PLoS Genet. 2012;8(2):e1002521. doi: 10.1371/journal.pgen.1002521. [DOI] [PMC free article] [PubMed] [Google Scholar]
- 58.Phillips ML, Swartz HA. A critical appraisal of neuroimaging studies of bipolar disorder: toward a new conceptualization of underlying neural circuitry and a road map for future research. Am J Psychiatry. 2014;171(8):829–843. doi: 10.1176/appi.ajp.2014.13081008. [DOI] [PMC free article] [PubMed] [Google Scholar]
- 59.Cerullo MA, Adler CM, Delbello MP, Strakowski SM. The functional neuroanatomy of bipolar disorder. Int Rev Psychiatry. 2009;21(4):314–322. doi: 10.1080/09540260902962107. [DOI] [PubMed] [Google Scholar]
- 60.Lim CS, Baldessarini RJ, Vieta E, Yucel M, Bora E, Sim K. Longitudinal neuroimaging and neuropsychological changes in bipolar disorder patients: review of the evidence. Neurosci Biobehav Rev. 2013;37(3):418–435. doi: 10.1016/j.neubiorev.2013.01.003. [DOI] [PubMed] [Google Scholar]
- 61.Badanich KA, Doremus-Fitzwater TL, Mulholland PJ, Randall PK, Delpire E, Becker HC. NR2B-deficient mice are more sensitive to the locomotor stimulant and depressant effects of ethanol. Genes Brain Behav. 2011;10(7):805–816. doi: 10.1111/j.1601-183X.2011.00720.x. [DOI] [PMC free article] [PubMed] [Google Scholar]
- 62.Moghaddam B, Javitt D. From revolution to evolution: the glutamate hypothesis of schizophrenia and its implication for treatment. Neuropsychopharmacology. 2012;37(1):4–15. doi: 10.1038/npp.2011.181. [DOI] [PMC free article] [PubMed] [Google Scholar]
- 63.Hulbert SW, Jiang YH. Monogenic mouse models of autism spectrum disorders: Common mechanisms and missing links. Neuroscience. 2016;321:3–23. doi: 10.1016/j.neuroscience.2015.12.040. [DOI] [PMC free article] [PubMed] [Google Scholar]
- 64.Duffney LJ, et al. Shank3 deficiency induces NMDA receptor hypofunction via an actin-dependent mechanism. J Neurosci. 2013;33(40):15767–15778. doi: 10.1523/JNEUROSCI.1175-13.2013. [DOI] [PMC free article] [PubMed] [Google Scholar]
- 65.Peça J, et al. Shank3 mutant mice display autistic-like behaviours and striatal dysfunction. Nature. 2011;472(7344):437–442. doi: 10.1038/nature09965. [DOI] [PMC free article] [PubMed] [Google Scholar]
- 66.Cryan JF, Slattery DA. Animal models of mood disorders: Recent developments. Curr Opin Psychiatry. 2007;20(1):1–7. doi: 10.1097/YCO.0b013e3280117733. [DOI] [PubMed] [Google Scholar]
- 67.Einat H. Strategies for the development of animal models for bipolar disorder: new opportunities and new challenges. Curr Top Behav Neurosci. 2011;5:69–87. doi: 10.1007/7854_2010_49. [DOI] [PubMed] [Google Scholar]
- 68.Young JW, Henry BL, Geyer MA. Predictive animal models of mania: hits, misses and future directions. Br J Pharmacol. 2011;164(4):1263–1284. doi: 10.1111/j.1476-5381.2011.01318.x. [DOI] [PMC free article] [PubMed] [Google Scholar]
- 69.Liu P, Jenkins NA, Copeland NG. A highly efficient recombineering-based method for generating conditional knockout mutations. Genome Res. 2003;13(3):476–484. doi: 10.1101/gr.749203. [DOI] [PMC free article] [PubMed] [Google Scholar]
- 70.Adams DJ, et al. A genome-wide, end-sequenced 129Sv BAC library resource for targeting vector construction. Genomics. 2005;86(6):753–758. doi: 10.1016/j.ygeno.2005.08.003. [DOI] [PubMed] [Google Scholar]
- 71.Wang X, et al. Altered mGluR5-Homer scaffolds and corticostriatal connectivity in a Shank3 complete knockout model of autism. Nat Commun. 2016;7:11459. doi: 10.1038/ncomms11459. [DOI] [PMC free article] [PubMed] [Google Scholar]
- 72.Jiang YH, et al. Mutation of the Angelman ubiquitin ligase in mice causes increased cytoplasmic p53 and deficits of contextual learning and long-term potentiation. Neuron. 1998;21(4):799–811. doi: 10.1016/S0896-6273(00)80596-6. [DOI] [PubMed] [Google Scholar]
- 73.Cohen RS, Blomberg F, Berzins K, Siekevitz P. The structure of postsynaptic densities isolated from dog cerebral cortex. I. Overall morphology and protein composition. J Cell Biol. 1977;74(1):181–203. doi: 10.1083/jcb.74.1.181. [DOI] [PMC free article] [PubMed] [Google Scholar]
- 74.Wang X, et al. Synaptic dysfunction and abnormal behaviors in mice lacking major isoforms of Shank3. Hum Mol Genet. 2011;20(15):3093–3108. doi: 10.1093/hmg/ddr212. [DOI] [PMC free article] [PubMed] [Google Scholar]
- 75. National Research Council. Guide For The Care And Use Of Laboratory Animals. 8th ed. Washington, DC, USA: National Academies Press; 2011. [Google Scholar]
Associated Data
This section collects any data citations, data availability statements, or supplementary materials included in this article.