Abstract
In rodent models, obesity and hyperglycemia alter cerebral glucose metabolism and glucose transport into the brain, resulting in disordered cerebral function as well as inappropriate responses to homeostatic and hedonic inputs. Whether similar findings are seen in the human brain remains unclear. In this study, 25 participants (9 healthy participants; 10 obese nondiabetic participants; and 6 poorly controlled, insulin- and metformin-treated type 2 diabetes mellitus (T2DM) participants) underwent 1H magnetic resonance spectroscopy scanning in the occipital lobe to measure the change in intracerebral glucose levels during a 2-hour hyperglycemic clamp (glucose ~220 mg/dl). The change in intracerebral glucose was significantly different across groups after controlling for age and sex, despite similar plasma glucose levels at baseline and during hyperglycemia. Compared with lean participants, brain glucose increments were lower in participants with obesity and T2DM. Furthermore, the change in brain glucose correlated inversely with plasma free fatty acid (FFA) levels during hyperglycemia. These data suggest that obesity and poorly controlled T2DM progressively diminish brain glucose responses to hyperglycemia, which has important implications for understanding not only the altered feeding behavior, but also the adverse neurocognitive consequences associated with obesity and T2DM.
Keywords: Endocrinology, Neuroscience
Keywords: Diabetes, Glucose metabolism, Obesity
Obesity and poorly controlled type 2 diabetes are associated with progressively blunted rise in intracerebral glucose levels during acute elevations in plasma glucose.
Introduction
The current obesity and type 2 diabetes epidemics in the US and across the world show no signs of abating, and with a growing number of individuals diagnosed at a younger age, there is greater exposure to the long-term adverse effects of these disorders. The lack of effective, long-term treatment options lends a particular urgency to understanding the underlying physiologic mechanisms driving obesity and diabetes development.
Dysregulation of cerebral cellular metabolic processes is thought to play an important role in the pathogenesis of obesity as well as obesity- and type 2 diabetes mellitus–associated (T2DM-associated) neurodegenerative diseases (1, 2). However, the underlying mechanisms linked to these associations remain unclear. Glucose is the primary energy source for the brain, which consumes more glucose (~60% of total glucose-derived energy) than any other organ in the body (3). Glucose is supplied across the blood-brain barrier (BBB) via facilitated diffusion through glucose transporters, predominately GLUT1 (4). Studies in healthy, lean subjects using magnetic resonance spectroscopy (MRS), a powerful, noninvasive technique to measure concentrations of metabolites within living tissue, have shown that brain glucose levels rise in a linear fashion with rising plasma glucose levels (5, 6).
However, fundamental questions regarding the effects of obesity and type 2 diabetes on glucose entry into the brain remain unresolved. Animal studies have suggested that chronic hyperglycemia decreases glucose transport through downregulation of GLUT1 at the BBB (7, 8). However, data in humans using MRS have mainly focused on type 1 diabetes (T1DM) and suggest a more complex picture. Men with T1DM were reported to have lower glucose uptake during acute hyperglycemia in the thalamus compared with control subjects (9). In another study, poorly controlled diabetic patients (T1DM and T2DM together) tended to have modest decreases in brain glucose levels compared with control subjects following a hyperglycemic clamp at 300 mg/dl (10). In contrast, other studies in well-controlled T1DM patients have found that an increased frequency of hypoglycemia may lead to increased glucose entry into the brain (11, 12). No studies, however, have directly examined in the human brain how glucose transport into the brain in response to acute increases in plasma glucose is modified by obesity and T2DM, despite evidence that insulin (13, 14) and free fatty acid (FFA) (15) may also modulate glucose transport across the BBB. It is noteworthy in this regard that in rats high-fat feeding for 3 days suppresses brain glucose uptake by downregulating GLUT1 independently from effects of blood glucose (15). Whether similar changes in cerebral glucose entry occur among obese, nondiabetic individuals remains unknown. This study was therefore undertaken to determine how obesity and poorly controlled T2DM modify changes in brain glucose levels in response to acute hyperglycemia using 1H MRS scanning.
Results
Participant characteristics.
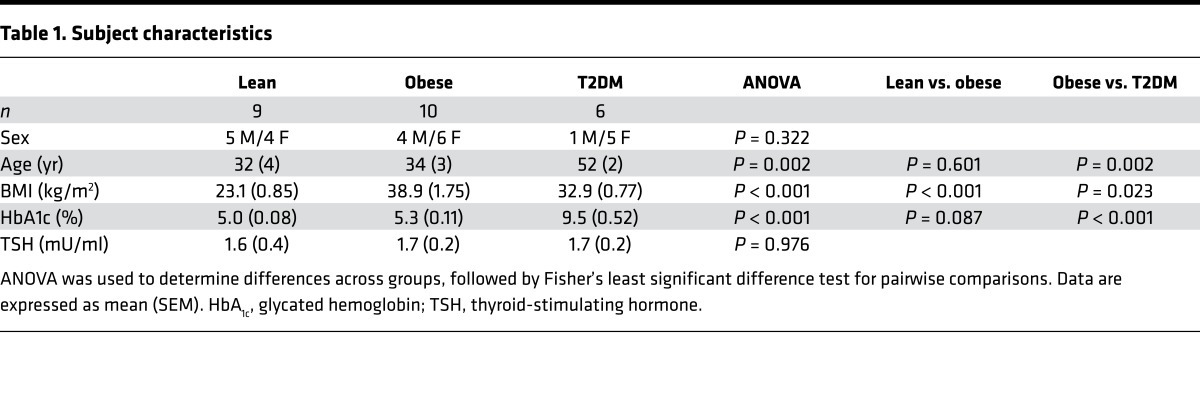
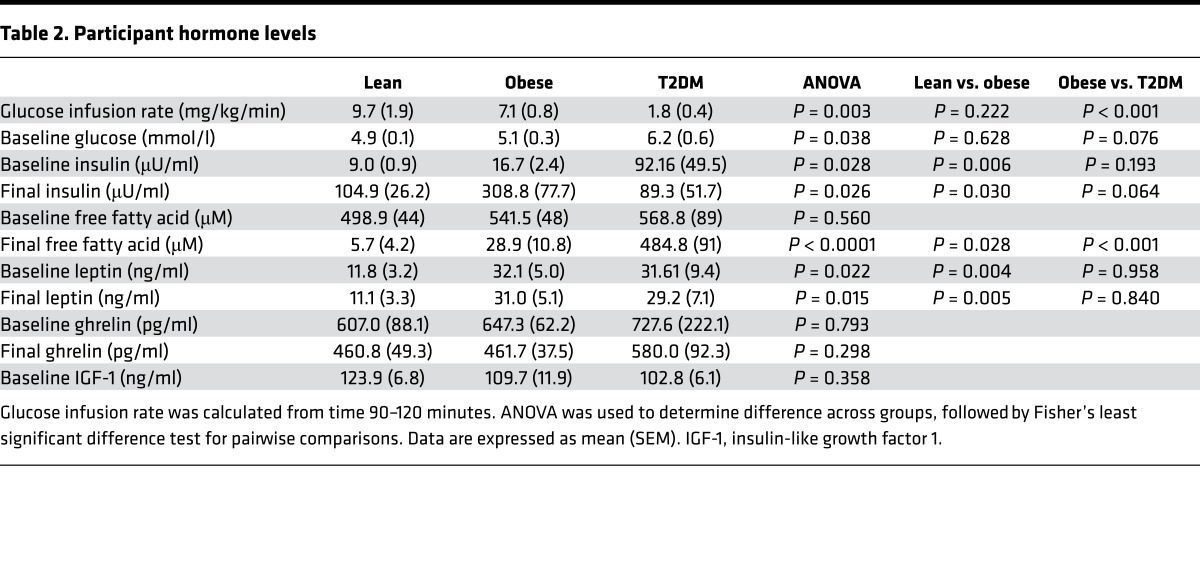
The lean and obese groups were similar in age and HbA1C levels; however, T2DM participants were older and had poor glycemic control with HbA1C levels of 9.5% ± 0.5% (Table 1). As expected, the mean glucose infusion rate during the clamp (P = 0.003) was progressively lower when comparing lean participants to obese participants and comparing obese participants to T2DM participants. Lean individuals had significantly lower fasting insulin and leptin levels compared with the obese and T2DM groups. There were no significant differences in fasting FFA, ghrelin, and IGF-1 levels between the groups (Table 2).
Table 1. Subject characteristics.
Table 2. Participant hormone levels.
Plasma and brain glucose levels.
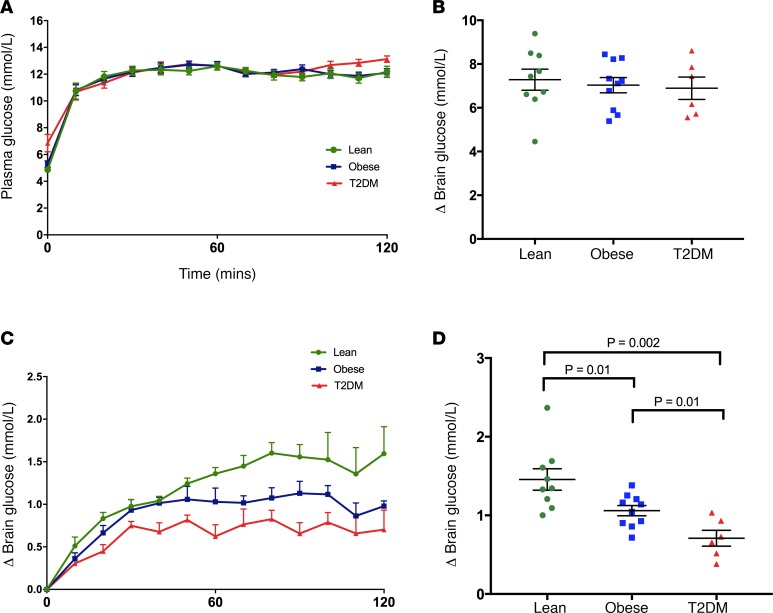
Using a mixed-effects regression model, plasma glucose levels during the study did not differ across the 3 groups and rose comparably in all groups (Figure 1, A and B). Despite a lack of differences in absolute or change in plasma glucose levels, the change in intracerebral glucose was significantly different across groups (P = 0.0001) (Figure 1C). Moreover, when plasma and brain glucose levels had reached steady state (between 60 and 120 minutes), individuals with obesity and those with T2DM had significantly reduced increments in brain glucose concentrations compared with lean controls (lean 1.46 ± 0.1 mmol/l vs. obese 1.06 ± 0.06 mmol/l vs. T2DM 0.71 ± 0.1 mmol/l) (Figure 1D). Individuals with poorly controlled T2DM showed a further blunting of brain glucose levels compared with obese individuals (P = 0.04).
Figure 1. Plasma and intracerebral glucose levels.
(A) Mean plasma glucose levels over time. Mixed-effects regression model controlling for age and sex, P = 0.09. (B) Mean change in plasma glucose (between time 60–120 minutes). P = 0.83 across groups. (C) Mean change in intracerebral glucose concentrations over time. Mixed-effects regression model controlling for age and sex, P = 0.0001. (D) Mean change in intracerebral glucose concentrations (between times 60–120 minutes). ANOVA was used to determine statistical differences among the three groups followed by Fisher’s least significant difference test for pairwise comparisons. All subjects (lean, n = 9; obese, n = 10; T2DM, n = 6) were included in analysis. Data represent mean ± SEM.
Hormone and metabolite response to hyperglycemia.
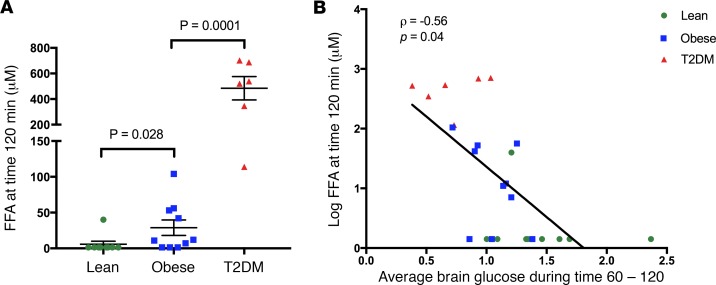
To begin to assess what factors might be driving these differences, we looked at relationships between changes in brain glucose levels and plasma levels of hormones or metabolites. In response to hyperglycemia, there were significant differences in insulin and FFA levels across the groups. Lean and obese nondiabetic individuals had a predictable rise in plasma insulin levels during hyperglycemia, but obese individuals had a much more pronounced rise in insulin levels (Table 2). Individuals with poorly controlled T2DM (who were receiving exogenous insulin) had no significant changes in insulin levels in response to hyperglycemia (Table 2). As expected, while lean individuals had virtually undetectable FFA levels after hyperglycemia, the obese and T2DM individuals did not suppress FFA levels to a similar extent (Figure 2A). Furthermore, the FFA levels during hyperglycemia were inversely correlated with the mean change in brain glucose level between time 60 and 120 minutes (ρ = –0.56, P = 0.04) (Figure 2B).
Figure 2. Relationships between plasma free fatty acids and intracerebral glucose.
(A) Free fatty acid (FFA) levels at the end of the study (120 minutes). ANOVA followed by Fisher’s least significant difference test for pairwise comparisons. Data represent mean ± SEM. (B) FFA levels were log transformed and correlated using a Spearman’s correlation with average brain glucose levels at steady state (time 60–120 minutes). Of note, 11 participants (3 obese and 8 lean) had FFA levels below the detection limits of the assay.
Hunger and fullness ratings.
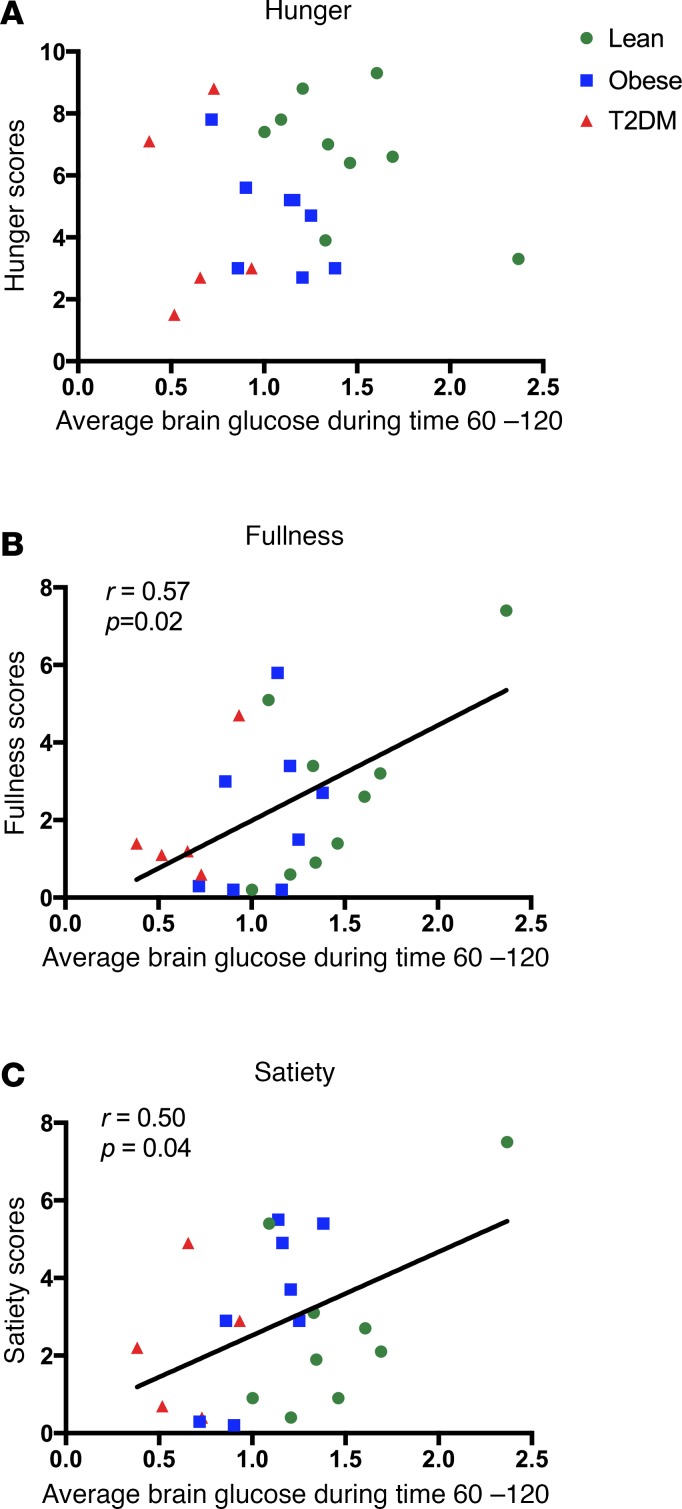
Hunger, satisfaction, and fullness ratings were scored immediately before and after the hyperglycemia clamp and MRS scan. There were no differences across groups in baseline measures of hunger (P = 0.121), satisfaction (P = 0.715), or fullness (P = 0.687). Furthermore, there were no reported differences across groups in the hunger (P = 0.305), satisfaction (P = 0.858), and fullness (P = 0.834) ratings, which were obtained immediately after the scan. However, in an exploratory analysis, changes in brain glucose levels during the hyperglycemia clamp were correlated against hunger and fullness scores obtained immediately upon exiting the scanner and prior to any meals. The average brain glucose levels (between 60 and 120 minutes) correlated positively and significantly with feelings of fullness (r = 0.57, P = 0.02) and satiety (r = 0.50, P = 0.04) but not hunger (P = 0.33) (Figure 3).
Figure 3. Relationships between intracerebral glucose and hunger, fullness, and satiety ratings.
Intracerebral glucose levels and hunger (A), fullness (B), and satiety (C) ratings taken immediately after scanning. Intracerebral glucose levels were correlated using Pearson’s correlation with hunger, satiety, and fullness ratings.
Discussion
Understanding how obesity and type 2 diabetes affect the ability of the brain to detect changes in circulating glucose is central to defining the downstream metabolic changes contributing to disordered eating behavior in obesity and T2DM. This study demonstrates that obese individuals without diabetes and poorly controlled T2DM individuals have significantly and progressively diminished elevations of intracerebral glucose levels in response to identical increments in plasma glucose as compared with healthy nondiabetic subjects. Most prior human studies examining glucose entry into the brain have focused on the effects of hypoglycemia on brain glucose transport and found that patients with T1DM and frequent episodes of hypoglycemia have augmented brain glucose entry (12, 16), presumably to minimize the adverse effects of acute hypoglycemia. The current data provide evidence that the reverse is true in poorly controlled patients with T2DM, suggesting that this may be a protective adaptation to reduce the brain’s exposure to excessive circulating levels of glucose. These findings are consistent with studies in diabetic rodents showing that glucose entry into the brain is decreased following hyperglycemia via downregulation of GLUT1 expression (17). Thus, our findings add another facet to a growing body of evidence indicating that glucose entry into the human brain is plastic and able to adapt to peripheral metabolic factors associated with poorly controlled diabetes.
What is less intuitive is our finding that obesity alone, in the absence of diabetes and chronic exposure to hyperglycemia, can also significantly blunt the rise of brain glucose during comparable acute elevations in plasma glucose levels. Prior human studies have provided indirect evidence that, at euglycemia, obesity may be associated with decreased brain metabolic activity. A study that utilized 31P-MRS brain scanning reported that lower levels of cerebral high-energy phosphates (18) are measured in obese individuals. Another study involving a cohort of 21 healthy individuals (including 3 obese participants) found that BMI was inversely correlated with brain metabolic activity, as measured by 18F-FDG PET scanning in the prefrontal cortex (19). Taken together with the current data, these observations suggest that obesity might be associated with defects in cerebral glucose metabolism stemming from decreased glucose transport across the BBB, a finding that might limit the brain’s ability to sense and respond appropriately to increments in peripheral glucose. This obesity-induced defect may be driven by increasing insulin resistance, which is then further magnified by progression to T2DM, leading to further blunting of the brain glucose response to elevations in peripheral glucose.
Our findings in the human brain are consistent with a recent study in rats showing that high-fat diet feeding for 3 days suppresses glucose transport across the BBB via downregulation of GLUT1, in conjunction with decreased functional glucose uptake, as measured by 18F-FDG scanning (15). Interestingly, in the study by Jais and colleagues, FFA, particularly palmitic acid, were sufficient to downregulate GLUT1 expression in brain endothelial cells. In rodents, hypothalamic FFA sensing has been associated with control of energy balance (20) and glucose homeostasis (21, 22). Moreover, humans with metabolic syndrome have been found to have higher cerebral FFA uptake (23). Thus, it is notable that, in our human study, we observed that higher plasma FFA levels correlate significantly with reduced brain glucose levels. Because FFA levels have been reported to mediate peripheral insulin resistance (24, 25) and are also directly regulated by plasma insulin levels, further studies will be needed to help clarify how plasma insulin levels modulate the association we observed between FFA levels and brain glucose.
In our study design, we elected not to standardize plasma insulin levels by using somatostatin in order to more closely mimic normal physiologic responses and avoid potential confounding somatostatin-induced effects on the brain. Whether insulin regulates BBB passage of glucose remains the subject of some debate, with some studies suggesting that it increases BBB glucose transport (13), while others failed to detect such effects (26, 27). In a study using MRS to assess the effects of insulin on brain glucose in lean, healthy subjects, insulin was shown to have no effect on intracerebral glucose levels during hyperglycemic clamps (26). Furthermore, our obese participants were nondiabetic, and there were no differences in HbA1C percentage or fasting plasma glucose levels compared with lean controls; however, it is theoretically possible that the more insulin-resistant obese individuals would have slightly higher postprandial elevations in blood glucose levels in real-life conditions. Nonetheless, it seems unlikely that if such modest increases in postprandial plasma glucose levels occurred they would be of sufficient magnitude to induce reductions in GLUT1 at the BBB.
It should be noted that the T2DM subjects were also significantly older than the lean and obese nondiabetic individuals, and although we controlled for age and sex in our statistical analysis, we cannot exclude the possibility that cerebrovascular changes related to chronic diabetes may also be associated with changes in brain glucose transport. However, when examining the relationship between age and brain glucose in nondiabetic lean and obese individuals (and thereby excluding the effects of diabetes and chronic hyperglycemia), we noted no correlations between age and change in brain glucose (P = 0.72), despite a wide range of ages (22–56 years) for the lean and obese groups. Nonetheless, our findings highlight the need for future studies designed to identify the additional factors that may be driving the magnified difference seen among T2DM individuals.
It is noteworthy that our brain glucose measurements were obtained in the occipital cortex due to its relative ease and reliability for spectral acquisition. However, there might be regional differences in cerebral glucose uptake, and thus further studies will be needed to determine if obesity might specifically alter brain glucose uptake in regions important for energy homeostasis, food intake, or cognitive function. This possibility is, however, not supported by rodent studies showing that high-fat diets caused comparable downregulation of GLUT1 in cortical and hippocampal endothelial cells (15). Because only steady-state levels of glucose were measured, it is not possible to know if the differences resulted from decreased transport of glucose across the BBB or increased rates of glucose utilization. However, given the large body of evidence that obesity is associated with relative cerebral hypometabolism (18, 19, 28), increased cerebral glucose utilization among obese and T2DM individuals appears unlikely, thus suggesting decreases in transport activity are driving the observed changes.
A potential limitation of the study is that, in order to maximize measurement accuracy, we measured the change in brain glucose as opposed to the absolute level. However, as shown in Supplemental Figure 1 (supplemental material available online with this article; https://doi.org/10.1172/jci.insight.95913DS1), the ratio of transport to metabolism can be derived from the changes in steady-state brain and plasma glucose levels from euglycemic values (6) (Supplemental Figure 1 and Supplemental Table 1). Furthermore, it is possible to derive the absolute intracellular glucose concentration from the change in brain glucose and the Michaelis-Menten constant, Kt, using a previously published reversible Michaelis-Menten model for glucose transport across the human BBB (6, 29).
Studies using 13C-MRS have established that absolute brain glucose levels are roughly 0.5 –1.5 mmol/l at euglycemia (5, 26) in lean, healthy individuals. We estimate that the baseline brain glucose concentrations among our healthy control subjects (assuming plasma glucose 5 mmol/l) range from 0.84 ± 0.1 mmol/l using Kt = 0.6 mM (6) to 0.7 ± 0.1 mmol/l using Kt = 1.1 mM (29); both of which are consistent with prior reports (5, 26) (Supplemental Table 2). Moreover, using these models, we calculate that at a plasma glucose of 12 mmol/l, healthy lean individuals would have an estimated absolute brain glucose concentration of 2.3 ± 0.2 mmol/l (with Kt = 0.6 mM) and 2.1 ± 0.2 mmol/l (with Kt = 1.1 mM), which is also consistent with prior reports (5, 26). Whether obesity and T2DM alter glucose transport across the BBB and/or alter absolute baseline concentrations of glucose in the brain remains unknown. However, the possibility that the obese and diabetic subjects had higher brain glucose levels specifically at euglycemia would be very unlikely, since, based upon glucose transport kinetics, a decreased increment would be consistent with lower brain glucose concentrations at all plasma levels (29).
Blunted increments in cerebral glucose levels in response to acute elevations in plasma glucose levels in obese and T2DM patients could have wide-ranging clinical implications. Circulating glucose levels are known to regulate human feeding behavior through modulation of brain activity in regions associated with reward and motivation (30). Thus, it is interesting that those individuals with higher brain glucose levels during the study also reported higher ratings of fullness and satiety after the study, despite having fasted for nearly 12 hours. The blunted intracerebral glucose levels may thus be one mechanism by which postprandial satiety signaling may be diminished in obesity. Finally, defective cerebral glucose entry across the BBB may also be one mechanism contributing to the pathogenesis of Alzheimer’s disease (and other neurodegenerative disorders), which is associated with obesity (31) and cerebral hypometabolism (32).
In summary, we demonstrate that obese and poorly controlled T2DM individuals have a blunted rise in brain glucose concentrations in response to comparable increases in plasma glucose levels. These findings have potential implications for not only regulation of feeding behavior and body weight, but also for understanding the increased risk of neurocognitive deficits in patients with obesity and poorly controlled T2DM.
Methods
Participants.
Nine healthy individuals with normal weight, ten obese individuals, and six individuals with poorly controlled T2DM were recruited from the greater New Haven area and participated in the study (Table 1). Exclusion criteria included inability to enter the MRI, smoking, illicit drug or recent steroid use, known psychiatric or neurological disorders, active infection, malignancy, abnormal thyroid function, cerebrovascular disease, cardiovascular disease, hepatobiliary disease, or weight change in last 3 months. For lean and obese participants, any medication use (other than contraceptives for women) was exclusionary. All T2DM individuals were treated with metformin as well as with basal/bolus insulin regimens; one individual was also using a GLP-1 agonist. Women who were breastfeeding, seeking pregnancy, or shown to be pregnant by urine test were also excluded.
Experimental protocol.
On the evening prior to MRS scanning, individuals with T2DM were admitted to the Yale University Hospital Research Unit and placed on a standard hospital protocol insulin drip overnight to normalize plasma glucose levels. T2DM participants received an average of 8.4 ± 2 units of insulin overnight, and mean plasma glucose levels were 126 ± 6 mg/dl overnight. The insulin infusion was maintained until the start of the scanning. At the start of scanning, the insulin infusion rate was fixed at 1 unit/hour for the duration of the study in order to minimize risk of ketosis. Neither lean nor obese participants received any exogenous insulin.
Hyperglycemia (target plasma glucose 220 mg/dl) was maintained using a variable 20% dextrose infusion, adjusted every 5–10 minutes for 2 hours. Insulin, leptin, ghrelin, and FFA were measured every 60 minutes. Immediately before and after the study, subjects rated their subjective feelings of hunger, fullness, and satiety/satisfaction (33) using a visual analog scale (10 cm).
1H MRS scanning.
Participants were positioned supine in a 4.0 T whole-body magnet interfaced to a Bruker AVANCE spectrometer (Bruker Instruments), with the head immobilized using foam inserts on top of a radiofrequency probe with a 1H circular coil as previously described (34, 35). After tuning, calibration, and acquisition of scout images for anatomical localization, intracerebral glucose concentration signals were obtained using stimulated echo acquisition mode localization (36) in 30 × 20 × 30 mm3 voxels in the occipital lobe for 20 minutes at baseline and then every 10 minutes for at least 2 hours of hyperglycemia. The sequence parameters were TR = 2,000 ms, TE/TM = 15 ms/10 ms, bandwidth = 5,000 Hz, sampling points = 2,048. Spectra were acquired with B0-lock and retrospective frequency adjustment for motion correction.
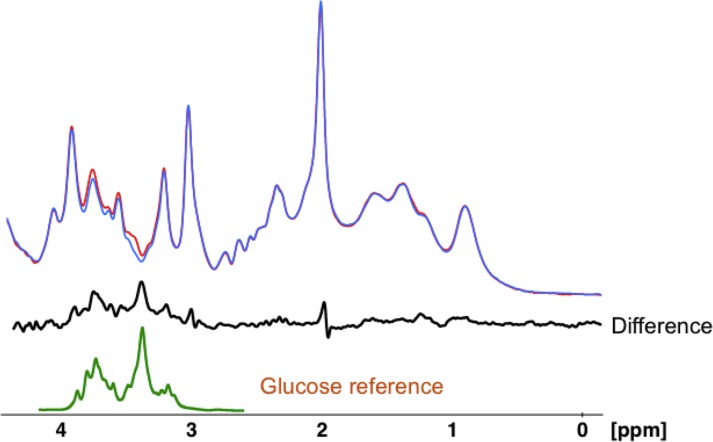
Baseline spectra were subtracted from subsequently obtained spectra to eliminate overlap from other brain metabolites as previously described (9, 10) (Figure 4). Changes in glucose levels were measured by peak integration referenced to creatine using baseline spectra to determine concentration. Glucose integrals were obtained by integrating the large peak from 3.32 to 3.54 ppm and scaled back to total intensity from 3.10 to 3.96 ppm in the free glucose spectrum (1:2.9), which contains 11 protons. The concentration of glucose was then compared with the creatine CH3 peak in the in vivo spectrum, which was assumed to be 10 mmol/kg and which contains 3 protons.
Figure 4. Spectral processing for intracerebral glucose.
An example using one representative lean subject of how an individual time point is calculated for change in brain glucose levels using difference spectra. The blue spectrum was obtained at baseline, and the red spectrum was obtained 10 minutes later. The black spectrum underneath is the difference between the red and blue spectra. The green spectrum represents a glucose reference spectrum obtained under in vivo conditions of temperature 37°C, pH 7.4, and ionic strength of 150 mM.
Laboratory analysis.
Plasma glucose levels were measured via glucose oxidase (YSI Inc.). Plasma free insulin, leptin, and ghrelin were measured by double-antibody radioimmunoassay (Millipore), IGF-1 was measured by enzyme-linked immunosorbent assay (R&D Systems), and FFA was measured using a colorimetric assay (WAKO).
Statistics.
One-way ANOVA was used to determine whether there were statistical differences among the three groups for all normally distributed hormones and metabolites as well as average brain and plasma glucose levels between times 60 and 120 minutes, followed by Fisher’s least significant difference test for pairwise comparisons. For nonparametric variables, the corresponding Kruskal-Wallis and Mann-Whitney U tests were used. Analyses of every repeatedly measured variable, including intracerebral glucose and plasma metabolite levels, were performed using the mixed-effects regression model method, taking into account both between-subject and within-subject correlations of repeated measures using the combination of a prespecified compound symmetry covariance matrix and an autoregressive covariance matrix. Age and sex were adjusted as covariates (i.e., as fixed effects). All analyses were performed using SAS, version 9.4, and SPSS, version 22. A 2-tailed P value of less than 0.05 was considered to be statistically significant.
Study approval.
The Yale University Human Investigation Committee approved the protocol, and all participants provided written informed consent prior to study participation.
Author contributions
JJH and RSS had full access to all of the data in the study and take responsibility for the integrity of the data and the accuracy of the data analysis. JJH, LJ, DLR, GM, and RSS conceived and designed the study. JJH, LJ, MH, ESR, LP, RBD, and BBK acquired data. JJH, LJ, MH, FD, DLR, GM, and RSS analyzed and interpreted data. JJH, LJ, MH, ESR, FD, RBD, LP, BBK, DLR, GM, and RSS wrote the manuscript. JJH, LJ, and FD performed statistical analysis.
Supplementary Material
Acknowledgments
This study was supported in part by grants from the NIH (KL2TR000140 and K23DK109284 to JJH, R01DK020495 and P30DK045735 to RSS, R01AA021984 to GM, R01NS087568 to DLR, and shared instrument grant 11S10OD010613-01), and the Yale Center for Clinical Investigation, supported by the Clinical Translational Science Award (UL1 RR024139) as well as the Endocrine Fellows Foundation (to JJH) and the American Diabetes Association (to JJH). The funding agencies had no role in the design and conduct of the study; collection, management, analysis, and interpretation of the data; or the preparation, review, or approval of the manuscript. We gratefully acknowledge the help of the Yale Core lab staff, Mikhail Smolgovsky, Irene Chernyak, Ralph Jacob, Doreen Nemeth, Maria Batsu, and Codruta Todeasa, as well as the Yale Hospital Research Unit nurses and staff, Joanne Caprio-Adams, Gina Solomon, Anne O’Connor, Catherine Parmelee, Mary Scanlon, Lynda Knaggs, Carmen Galarza, Elizabeth O’Neal, Joyce Russell, Gayle Pietrogallo, and Cynthia Smith. We also thank Catherine Yeckel for critical reading of the manuscript.
Version 1. 10/19/2017
Electronic publication
Footnotes
Conflict of interest: J.J. Hwang reports receipt of research support from Pfizer and Regeneron. D.L. Rothman reports receipt of research support from Pfizer. R. Belfort-DeAguiar reports receipt of research support from GlaxoSmithKline. R.S. Sherwin reports receipt of research support from Regeneron.
Reference information: JCI Insight. 2017;2(20):e95913. https://doi.org/10.1172/jci.insight.95913.
Contributor Information
Lihong Jiang, Email: lihong.jiang@yale.edu.
Muhammad Hamza, Email: muhammad.hamza@yale.edu.
Elizabeth Sanchez Rangel, Email: elizabeth.sanchezrangel@yale.edu.
Feng Dai, Email: feng.dai@yale.edu.
Lisa Parikh, Email: lisa.parikh@yale.edu.
Douglas L. Rothman, Email: douglas.rothman@yale.edu.
Graeme Mason, Email: graeme.mason@yale.edu.
Robert S. Sherwin, Email: robert.sherwin@yale.edu.
References
- 1.Strachan MW, Reynolds RM, Marioni RE, Price JF. Cognitive function, dementia and type 2 diabetes mellitus in the elderly. Nat Rev Endocrinol. 2011;7(2):108–114. doi: 10.1038/nrendo.2010.228. [DOI] [PubMed] [Google Scholar]
- 2.Cukierman T, Gerstein HC, Williamson JD. Cognitive decline and dementia in diabetes--systematic overview of prospective observational studies. Diabetologia. 2005;48(12):2460–2469. doi: 10.1007/s00125-005-0023-4. [DOI] [PubMed] [Google Scholar]
- 3. Stryer L. Biochemistry. 4th ed. New York: W.H. Freeman; 1995. [Google Scholar]
- 4.Takata K, Kasahara T, Kasahara M, Ezaki O, Hirano H. Erythrocyte/HepG2-type glucose transporter is concentrated in cells of blood-tissue barriers. Biochem Biophys Res Commun. 1990;173(1):67–73. doi: 10.1016/S0006-291X(05)81022-8. [DOI] [PubMed] [Google Scholar]
- 5.Gruetter R, et al. Direct measurement of brain glucose concentrations in humans by 13C NMR spectroscopy. Proc Natl Acad Sci USA. 1992;89(3):1109–1112. doi: 10.1073/pnas.89.3.1109. [DOI] [PMC free article] [PubMed] [Google Scholar]
- 6.Gruetter R, Ugurbil K, Seaquist ER. Steady-state cerebral glucose concentrations and transport in the human brain. J Neurochem. 1998;70(1):397–408. doi: 10.1046/j.1471-4159.1998.70010397.x. [DOI] [PubMed] [Google Scholar]
- 7.Pardridge WM, Triguero D, Farrell CR. Downregulation of blood-brain barrier glucose transporter in experimental diabetes. Diabetes. 1990;39(9):1040–1044. doi: 10.2337/diab.39.9.1040. [DOI] [PubMed] [Google Scholar]
- 8.Cornford EM, Hyman S, Cornford ME, Clare-Salzler M. Down-regulation of blood-brain glucose transport in the hyperglycemic nonobese diabetic mouse. Neurochem Res. 1995;20(7):869–873. doi: 10.1007/BF00969700. [DOI] [PubMed] [Google Scholar]
- 9.Heikkilä O, Lundbom N, Timonen M, Groop PH, Heikkinen S, Mäkimattila S. Evidence for abnormal glucose uptake or metabolism in thalamus during acute hyperglycaemia in type 1 diabetes--a 1H MRS study. Metab Brain Dis. 2010;25(2):227–234. doi: 10.1007/s11011-010-9199-5. [DOI] [PubMed] [Google Scholar]
- 10.Seaquist ER, Tkac I, Damberg G, Thomas W, Gruetter R. Brain glucose concentrations in poorly controlled diabetes mellitus as measured by high-field magnetic resonance spectroscopy. Metab Clin Exp. 2005;54(8):1008–1013. doi: 10.1016/j.metabol.2005.02.018. [DOI] [PubMed] [Google Scholar]
- 11.van de Ven KC, Tack CJ, Heerschap A, van der Graaf M, de Galan BE. Patients with type 1 diabetes exhibit altered cerebral metabolism during hypoglycemia. J Clin Invest. 2013;123(2):623–629. doi: 10.1172/JCI62742. [DOI] [PMC free article] [PubMed] [Google Scholar]
- 12.Boyle PJ, Kempers SF, O’Connor AM, Nagy RJ. Brain glucose uptake and unawareness of hypoglycemia in patients with insulin-dependent diabetes mellitus. N Engl J Med. 1995;333(26):1726–1731. doi: 10.1056/NEJM199512283332602. [DOI] [PubMed] [Google Scholar]
- 13.Hertz MM, Paulson OB, Barry DI, Christiansen JS, Svendsen PA. Insulin increases glucose transfer across the blood-brain barrier in man. J Clin Invest. 1981;67(3):597–604. doi: 10.1172/JCI110073. [DOI] [PMC free article] [PubMed] [Google Scholar]
- 14.Daniel PM, Love ER, Pratt OE. Insulin and the way the brain handles glucose. J Neurochem. 1975;25(4):471–476. doi: 10.1111/j.1471-4159.1975.tb04352.x. [DOI] [PubMed] [Google Scholar]
- 15.Jais A, et al. Myeloid-cell-derived VEGF maintains brain glucose uptake and limits cognitive impairment in obesity. Cell. 2016;166(5):1338–1340. doi: 10.1016/j.cell.2016.08.010. [DOI] [PubMed] [Google Scholar]
- 16.Criego AB, Tkac I, Kumar A, Thomas W, Gruetter R, Seaquist ER. Brain glucose concentrations in patients with type 1 diabetes and hypoglycemia unawareness. J Neurosci Res. 2005;79(1-2):42–47. doi: 10.1002/jnr.20296. [DOI] [PubMed] [Google Scholar]
- 17.Duelli R, Maurer MH, Staudt R, Heiland S, Duembgen L, Kuschinsky W. Increased cerebral glucose utilization and decreased glucose transporter Glut1 during chronic hyperglycemia in rat brain. Brain Res. 2000;858(2):338–347. doi: 10.1016/S0006-8993(00)01942-9. [DOI] [PubMed] [Google Scholar]
- 18.Schmoller A, et al. Evidence for a relationship between body mass and energy metabolism in the human brain. J Cereb Blood Flow Metab. 2010;30(7):1403–1410. doi: 10.1038/jcbfm.2010.48. [DOI] [PMC free article] [PubMed] [Google Scholar]
- 19.Volkow ND, et al. Inverse association between BMI and prefrontal metabolic activity in healthy adults. Obesity (Silver Spring) 2009;17(1):60–65. doi: 10.1038/oby.2008.469. [DOI] [PMC free article] [PubMed] [Google Scholar]
- 20.Obici S, Feng Z, Morgan K, Stein D, Karkanias G, Rossetti L. Central administration of oleic acid inhibits glucose production and food intake. Diabetes. 2002;51(2):271–275. doi: 10.2337/diabetes.51.2.271. [DOI] [PubMed] [Google Scholar]
- 21.Lam TK, et al. Hypothalamic sensing of circulating fatty acids is required for glucose homeostasis. Nat Med. 2005;11(3):320–327. doi: 10.1038/nm1201. [DOI] [PubMed] [Google Scholar]
- 22.Pocai A, et al. Restoration of hypothalamic lipid sensing normalizes energy and glucose homeostasis in overfed rats. J Clin Invest. 2006;116(4):1081–1091. doi: 10.1172/JCI26640. [DOI] [PMC free article] [PubMed] [Google Scholar]
- 23.Karmi A, et al. Increased brain fatty acid uptake in metabolic syndrome. Diabetes. 2010;59(9):2171–2177. doi: 10.2337/db09-0138. [DOI] [PMC free article] [PubMed] [Google Scholar]
- 24.Guilherme A, Virbasius JV, Puri V, Czech MP. Adipocyte dysfunctions linking obesity to insulin resistance and type 2 diabetes. Nat Rev Mol Cell Biol. 2008;9(5):367–377. doi: 10.1038/nrm2391. [DOI] [PMC free article] [PubMed] [Google Scholar]
- 25.Boden G. Role of fatty acids in the pathogenesis of insulin resistance and NIDDM. Diabetes. 1997;46(1):3–10. [PubMed] [Google Scholar]
- 26.Seaquist ER, Damberg GS, Tkac I, Gruetter R. The effect of insulin on in vivo cerebral glucose concentrations and rates of glucose transport/metabolism in humans. Diabetes. 2001;50(10):2203–2209. doi: 10.2337/diabetes.50.10.2203. [DOI] [PubMed] [Google Scholar]
- 27.Hasselbalch SG, et al. No effect of insulin on glucose blood-brain barrier transport and cerebral metabolism in humans. Diabetes. 1999;48(10):1915–1921. doi: 10.2337/diabetes.48.10.1915. [DOI] [PubMed] [Google Scholar]
- 28.Jauch-Chara K, et al. Blunted brain energy consumption relates to insula atrophy and impaired glucose tolerance in obesity. Diabetes. 2015;64(6):2082–2091. doi: 10.2337/db14-0421. [DOI] [PubMed] [Google Scholar]
- 29.de Graaf RA, et al. Differentiation of glucose transport in human brain gray and white matter. J Cereb Blood Flow Metab. 2001;21(5):483–492. doi: 10.1097/00004647-200105000-00002. [DOI] [PubMed] [Google Scholar]
- 30.Page KA, et al. Circulating glucose levels modulate neural control of desire for high-calorie foods in humans. J Clin Invest. 2011;121(10):4161–4169. doi: 10.1172/JCI57873. [DOI] [PMC free article] [PubMed] [Google Scholar]
- 31.Winkler EA, et al. GLUT1 reductions exacerbate Alzheimer’s disease vasculo-neuronal dysfunction and degeneration. Nat Neurosci. 2015;18(4):521–530. doi: 10.1038/nn.3966. [DOI] [PMC free article] [PubMed] [Google Scholar]
- 32.Small GW, et al. Apolipoprotein E type 4 allele and cerebral glucose metabolism in relatives at risk for familial Alzheimer disease. JAMA. 1995;273(12):942–947. [PubMed] [Google Scholar]
- 33.Flint A, Raben A, Blundell JE, Astrup A. Reproducibility, power and validity of visual analogue scales in assessment of appetite sensations in single test meal studies. Int J Obes Relat Metab Disord. 2000;24(1):38–48. doi: 10.1038/sj.ijo.0801083. [DOI] [PubMed] [Google Scholar]
- 34.Gruetter R, Novotny EJ, Boulware SD, Rothman DL, Shulman RG. 1H NMR studies of glucose transport in the human brain. J Cereb Blood Flow Metab. 1996;16(3):427–438. doi: 10.1097/00004647-199605000-00009. [DOI] [PubMed] [Google Scholar]
- 35.Gruetter R, Rothman DL, Novotny EJ, Shulman GI, Prichard JW, Shulman RG. Detection and assignment of the glucose signal in 1H NMR difference spectra of the human brain. Magn Reson Med. 1992;27(1):183–188. doi: 10.1002/mrm.1910270118. [DOI] [PubMed] [Google Scholar]
- 36.Thompson RB, Allen PS. Response of metabolites with coupled spins to the STEAM sequence. Magn Reson Med. 2001;45(6):955–965. doi: 10.1002/mrm.1128. [DOI] [PubMed] [Google Scholar]
Associated Data
This section collects any data citations, data availability statements, or supplementary materials included in this article.


