
Figure 1. Transformation of chromatin accessibility landscape at DHSs.
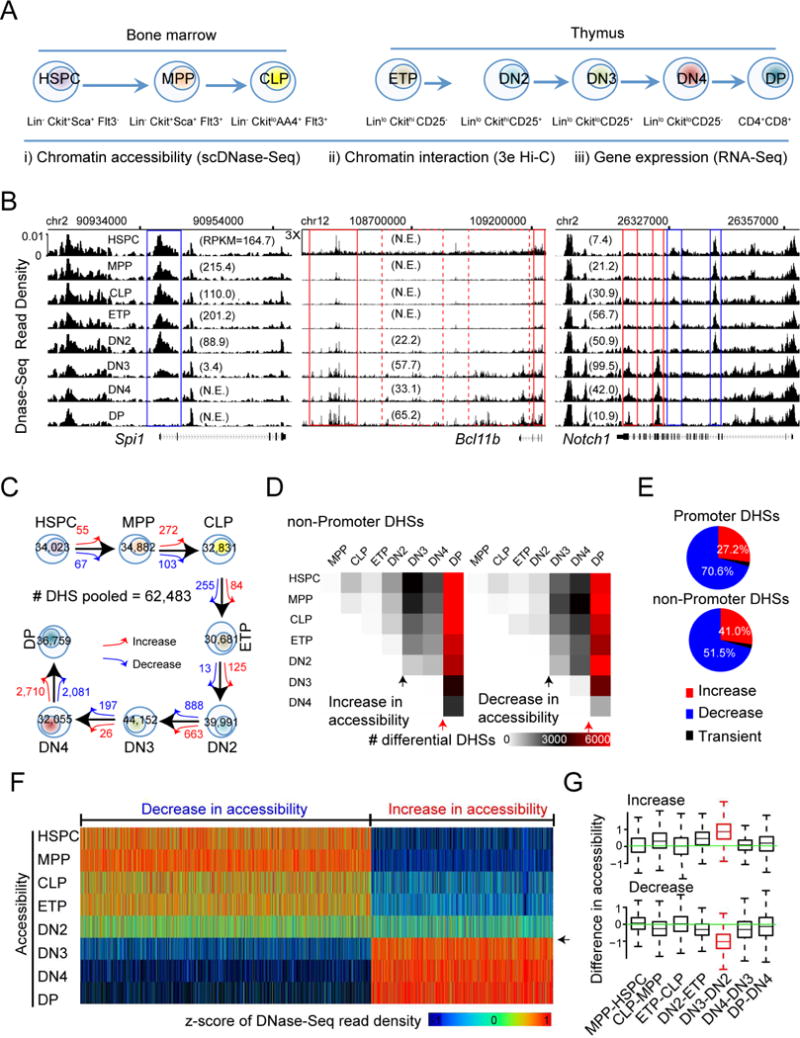
(A) The combination of cell surface markers used to purify HSPC, MPP and CLP cells from mouse bone marrow, and ETP, DN2, DN3, DN4 and DP cells from mouse thymus. Indicated at the bottom are the techniques for genome-wide profiles of chromatin accessibility, chromatin interaction and gene expression.
(B) UCSC genome browser images showing the distribution of normalized scDNase-Seq reads for all developmental stages from HSPC to DP for genomic regions harboring Spi1 (left panel), Bcl11b (middle panel) and Notch1 (right panel). Number of independent experiments = 2. Numbers in parenthesis: gene expression value by RPKM; N.E. not expressed (RPKM<1); 3X: zoom-in 3-folder on y-axis.
(C) Number of DHSs identified for each stage and numbers of differential DHSs, showing an increase (red arrow) or decrease (blue arrow) in chromatin accessibility between consecutive stages.
(D) Heat map showing the numbers of differential DHSs in non-promoter regions, increasing (left panel) or decreasing (right panel) in chromatin accessibility, between any two stages from HSPC to DP. Black and red arrow heads marked the DN2-to-DN3 transition and the DN4-to-DP transition, respectively.
(E) Distributions of concordant differential DHSs in promoter regions (upper panel) and in non-promoter regions (lower panel).
(F) Heat map visualization of scDNase-Seq read across all developmental stages for non-promoter DHSs showing concordant change in chromatin accessibility from HSPC to DP cells but no remarkable difference in chromatin accessibility at the DN4-to-DP transition. The read densities were transformed into z-scores per DHS (column). Arrowhead marks the DN2 to DN3 transition.
(G) Box plot for the distribution of the difference in the z-scored scDNase-seq read density between two neighboring stages for DHSs that exhibited a concordant increase (upper panel) or decrease (lower panel) in accessibility from HSPC to DP cells but not at the DN4-to-DP transition. Highlighted in red referred to the DN2-to-DN3 transition. The top and bottom of the box represent 25th and 75th percentile, respectively. The upper whisker represents the smaller of the maximum and upper quartile plus 1.5 IQR (interquartile range), while the lower whisker represents the larger of the minimum and lower quartile minus 1.5 IQR.