
Figure 3. Key regulators of T cells exhibit a substantial increase in interaction.
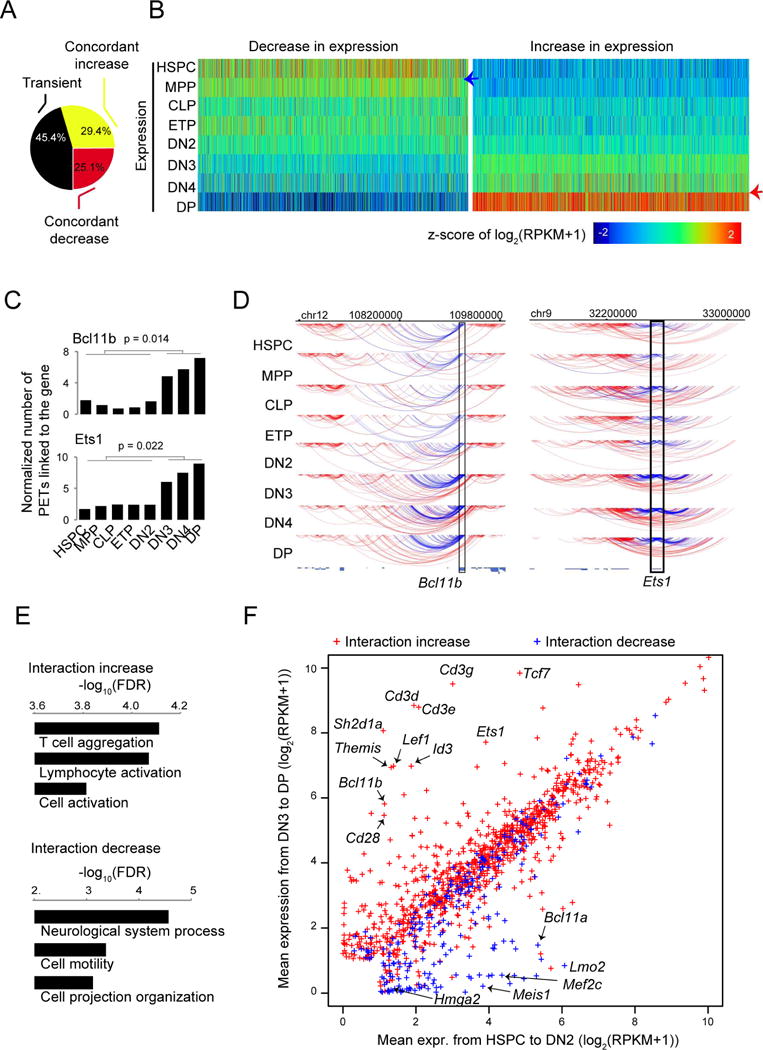
(A) Distribution of genes showing concordant increase, concordant decrease or transient changes in expression from HSPC to DP.
(B) Heatmap for the distribution of expression for genes showing concordant increase or decrease in expression from HSPC to DP cells.
(C) Bar graphs showing examples of genes with a substantial increase (Bc1llb and Ets1) in the number of gross interacting PETs linked to the gene pooled from 2 to 5 independent experiments before and after T cell commitment. P value by t-test.
(D) Arc plot from WashU epigenome browser showing the gross interacting PETs of Bcl11b (left panel) and Ets1 (right panel) from HSPC to DP cells, down-sampled to the limiting stage. Blue lines: PETs with at least one end linking to the target locus (rectangle); Red lines: other PETs in the region. Pooled from 2-5 independent experiments.
(E) Gene ontology enrichment analysis for genes exhibiting an increase (upper panel) or decrease (lower panel) in gross interaction before and after T cell commitment.
(F) Scatter plot of the averaged expression values from HSPC to DN2 and from DN3 to DP for genes that exhibit a significant change in gross interaction before and after T cell commitment. Arrows: examples of genes with coordinated change in gross interaction and expression.