
Figure 4. Transformation of compartment organization.
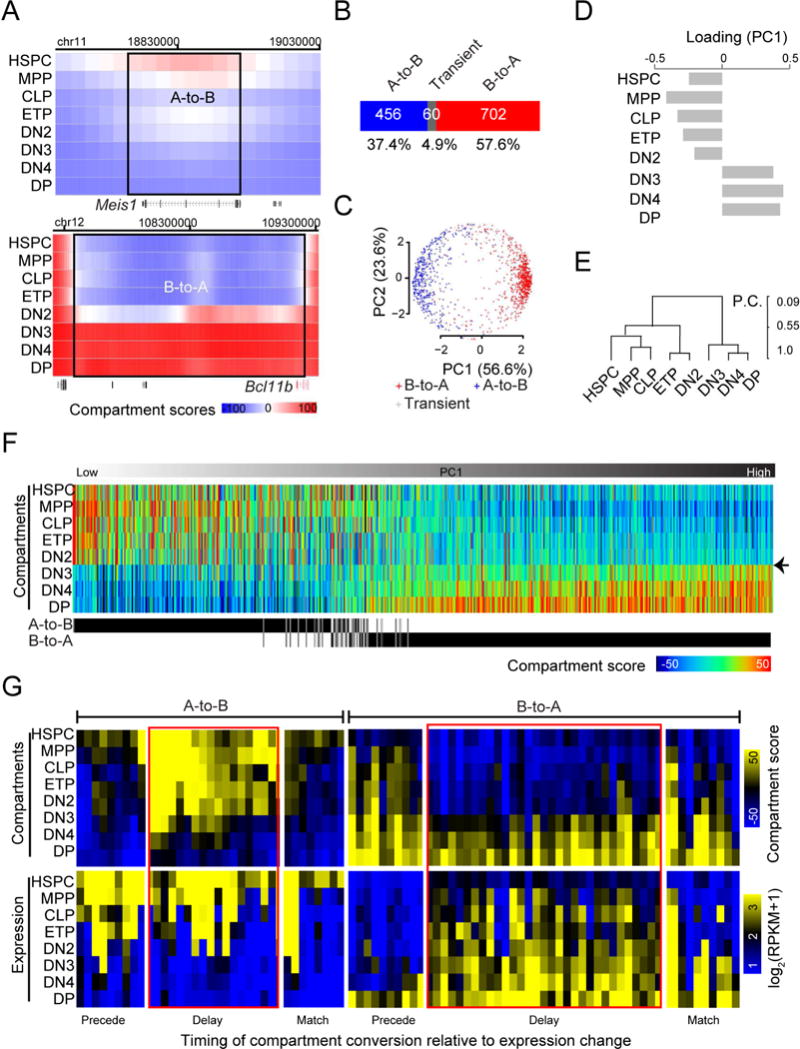
(A) Heat maps showing the distributions of compartment score across genomic regions encompassing Meis1 (upper panel) and Bcl11b for each developmental stage from HSPC to DP. Rectangles: genomic regions with compartment flip. Pooled from 2-5 independent experiments.
(B) Distribution of genomic regions showing concordant A-to-B compartment flips, concordant B-to-A flips or transient flips.
(C) Projection of genomic regions with compartment flips from a high dimensional space constituted by the compartment scores across all developmental stages onto a two-dimensional space by PCA analysis. In parenthesis is the portion of variance explained by each principal component.
(D) Bar graph showing the contribution (or loading) of each developmental stage to the first principal component from the PCA analysis in panel C.
(E) Hierarchical clustering analysis of development stages from HSPC to DP based on compartment scores of concordantly flipped genomic regions. P.C.: Pearson’s coefficient.
(F) Heat map visualization of compartment scores from HSPC to DP for genomic regions (columns) with concordant compartment flips, sorted based on the PC1 value from panel C. The A-to-B or B-to-A compartment flip of each genomic region is indicated at the bottom. Arrowhead: the DN2-to-DN3 transition.
(G) Heat map visualization of expression values and compartment scores across genes from HSPC to DP cells for genes located in A-to-B flipped compartments, expressed in HSPCs and silenced in DPs with a fold-change over 2 (left panel) and for genes located in B-to-A flipped compartments, silenced in HSPCs and expressed in DPs with a fold-change over 2 (right panel), sorted first based on a manual annotation on the timing of compartment conversion in relative to expression on or off (indicated in the bottom) and then hierarchically clustered based on compartment scores. Red rectangle: genes with a delay in compartment conversion.