Abstract
Biological tissues have complex 3D collagen fiber architecture that cannot be fully visualized by conventional second harmonic generation (SHG) microscopy due to electric dipole considerations. We have developed a multi-view SHG imaging platform that successfully visualizes all orientations of collagen fibers. This is achieved by rotating tissues relative to the excitation laser plane of incidence, where the complete fibrillar structure is then visualized following registration and reconstruction. We evaluated high frequency and Gaussian weighted fusion reconstruction algorithms, and found the former approach performs better in terms of the resulting resolution. The new approach is a first step toward SHG tomography.
1. INTRODUCTION
Second harmonic generation (SHG) microscopy has been highly successful in visualizing and quantifying complex collagen assembly as it specifically targets fibrillar collagen with high sensitivity and specificity. For example, macromolecular information can be elucidated using polarization resolved methods, and fibril size and spacing can be inferred from exploiting the coherence of the process [1]. The collagen fibers are the structures viewed in the microscope and can be analyzed through image analysis approaches. Using these types of metrics, SHG imaging has been used for revealing extracellular matrix (ECM) structural changes in a wide range of diseases such as cancers, connective tissue disorders, and fibroses [2–7]. For example, we have shown that different ovarian tumors are morphologically distinct from normal tissues, as well as benign tumors and tissues at high risk for developing high grade cancer [8].
Although very powerful for visualizing collagen fibers with high contrast, microscope-based SHG imaging has its limitations. Specifically, SHG microscopy obtains sequential en face optical section images through the depth (z axis) of tissue volumes to build 3D data sets. However, SHG in this configuration is not a true 3D modality. This is because fully axially oriented fibers (aligned with the direction of laser propagation) are transparent, as SHG is electric dipole forbidden for this alignment. Also, fibers at high tilt angles will appear at lower intensities. This is a significant limitation as the native ECM in most tissues has intrinsic 3D architecture, where not all the collagen fibers lie in the plane of incidence or at small tilt angles relative to the plane. For example, the dermis and ovarian stroma in normal tissues have 3D mesh-like morphologies [9,10], and SHG will not visualize the entire structure. We previously have shown that 3D texture analysis provides significantly improved discrimination between ovarian tumors over the analogous 2D approach even using the incomplete information in 3D stacks [8]. Similar results were found by Georgakoudi and co-workers using a different image analysis approach [11]. We thus postulate new collagen organization patterns that are diagnostic and prognostic may result from true 3D analysis and provide superior quantitative performance in discriminating normal and diseased tissues. Additionally, imaging of collagen and other SHG active scaffolds (e.g., cellulose and silk) [12,13] in tissue engineering applications would be enhanced through this capability. To achieve this goal, a new SHG imaging approach is necessary that can acquire data from different views to reveal fibers of all orientations.
We have previously demonstrated the underlying physics of the SHG constraints by imaging at two orthogonal views using two reflective micro-prisms located adjacent to the tissue [14]. Using a mouse tail tendon in different geometries, we unequivocally showed that axially oriented fibers were missing in SHG contrast, while fluorescence labeling of collagen resulted in strong fluorescence for all orientations. While this was a successful step in developing a 3D SHG microscope, this configuration has significant limitations. First, this setup allows only two orthogonal views. Second, this affords detection only of backward SHG emission, where retroreflected photons are collected by the excitation objective. This limits the SHG signal that can be collected, as the majority of photons are emitted in the forward direction, as well as precludes the use of directional-based metrics, which can be used for structural analysis [9,10].
Here we take steps toward developing 3D SHG imaging tomography by drawing some analogies with light sheet microscopy [15] and optical projection tomographies [16]. Our approach cylindrically rotates the specimen, and then images tissue by conventional laser scanning galvanometers and single point collection. For this purpose, we have developed a novel stage-insertable platform and demonstrate multi-view imaging as well as evaluate different registration/reconstruction approaches that are necessary to visualize fibers at the intensity that corresponds to the structure.
2. SHG THEORETICAL CONSIDERATIONS
The theory regarding this phenomenon has previously been reported by others and further discussed in this specific context by Wen et al. [14]. Briefly, the second-order-induced polarization of a medium subjected to an electromagnetic field can be related to the field strength E by the equation
| (1) |
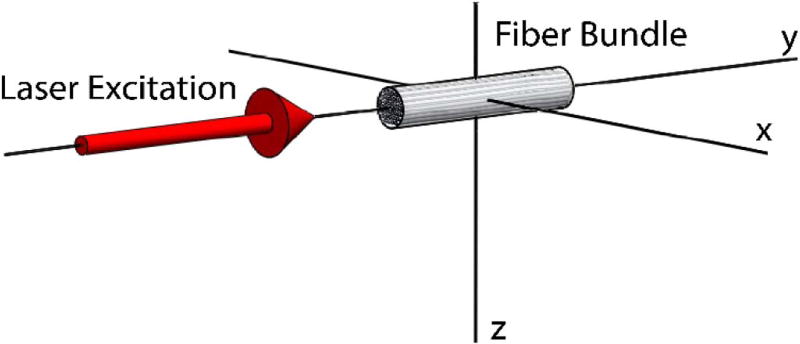
where P(2) is the second-order-induced polarization, ε0 is the permittivity of vacuum, and denotes the second-order susceptibility tensor, where SHG can be represented by the third-rank d-tensor given by . When Kleinman symmetry is valid, j and k are interchangeable and dijk can be reduced to form the 3 × 6 matrix dij. Collagen fibrils are assumed to have C∞ mm symmetry (x = z) along the fiber axis (y axis shown in Fig. 1), simplifying the treatment relative to the exact C3v symmetry [17]. For C∞ cylindrical symmetry, certain elements of the d-matrix reduce to zero. The polarization dependence of SHG is proportional to the effective hyperpolarizability coefficient and can be described by deff = ê2ωdij:êωêω and written out in matrix notation as follows [18,19]:
| (2) |
where e1, e2 and e3 are the components of the unit vector, ê = (e1, e2, e3), of the laser electric field related to the collagen fiber. Cylindrical symmetry (x = z) allows d16 = d34 and d21 = d23, and Kleinman symmetry allows further simplification and gives d16 = d21. We can therefore assume d16 = d34 = d21 = d23. After matrix multiplication and applying symmetry assumptions, Eq. (2) then simplifies to
| (3) |
Fig. 1.
Assigned axes configuration showing fiber bundle oriented along the y axis relative to the direction of laser excitation.
For circular polarization as commonly used [1], if the laser electric field propagates along the axis of the collagen fiber, as depicted by the y axis in Fig. 1, the laser electric field unit vector can be described by the equation
| (4) |
and, in this case, e2 = 0 and so deff = 0, and SHG emission will be forbidden. By contrast, if the laser excitation travels along the z axis and perpendicular to the collagen fiber, the laser electric field unit vector is (sin(ωt), cos(ωt), 0), and the following applies:
| (5) |
where the predominant y axis polarization fiber components will result in non-vanishing SHG emission. Thus, excitation from different angles will result in different contrast, and further, with a range of angles, all collagen fibers in the tissue can be visualized. We note this is rigorously valid only if all the dipole moments align exactly along the fiber/fibril axis direction. Previous work suggests the collagen molecules lie at a slight angle with respect to the fibril axis, and, as a result, the SHG emission will not completely vanish but the intensity will be greatly diminished [20]. We further note that focusing with a high NA objective (NA > 1.0) may result in small SHG signals from purely axially oriented fibers. However, the current work was performed at 0.4–0.5 NA, and we do not expect any such contributions in this geometry.
3. EXPERIMENTAL DESIGN
A. Imaging System
The experimental imaging system is comprised of a mode-locked titanium sapphire laser excitation source (Mira 900; Coherent, Santa Clara, California) coupled into a laser scanning unit (FluoView 300; Olympus, Melville, New York) mounted on an upright microscope (BX61; Olympus) [1]. All imaging was performed at 890 nm excitation with an average power controlled using an electro-optic modulator (ConOptics, Danbury, Connecticut) of 30–45 mW at the focal plane using either a 10×, 0.4 NA lens (UPSAPO; Olympus) or a 20×, 0.5 NA water immersion lens (UMPLFLN; Olympus) and a 0.9 NA condenser below the platform for forward SHG collection. Low magnification objectives were used, as larger fields of view are needed to fully sample the specimen from every rotation angle. The 512 × 512 pixel image field of view size was 966, and 483 µm for the 10× and 20× objectives, respectively. The scanning speed was 2.71 s/frame with three-frame Kalman averaging.
The system utilizes a forward and epi-detection geometry for SHG and two-photon excited fluorescence (TPEF), respectively, where each channel uses a 7421 GaAsP single photon counting module (Hamamatsu, Japan). The SHG emission was isolated with a 445/20 nm bandpass filter (Semrock, Rochester, New York), and the TPEF from fluorescent beads and eosin was isolated with 490/20 nm and 620/90 nm bandpass filters (Semrock), respectively. The emission wavelength in each case was validated using a fiber-optic spectrometer (Ocean Optics, Dunedin, Florida).
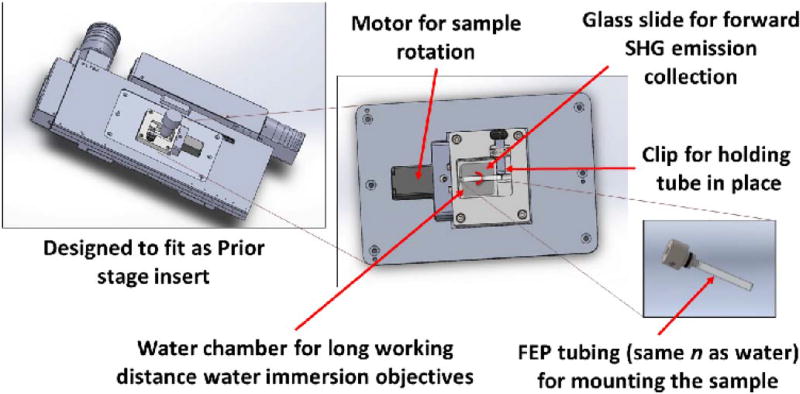
The multi-view SHG imaging platform developed here cylindrically rotates the sample relative to the fixed excitation laser direction via a purpose-built rotational stage platform (Fig. 2). The device is inserted into the x–y translation stage and houses a small stepping motor (Twister III; Picard Industries, Albion, New York) that rotates a fluorinated ethylene propylene (FEP) tube (3 mm and 3.5 mm inner and outer diameters, respectively) containing the specimen. FEP tubing is used extensively in light sheet microscopy as it has nearly the same index of refraction as water and reduces spherical aberration [21]. The platform is further comprised of a glass bottom for forward emission collection, a water chamber to allow the use of long working distance water immersion objectives, and a sliding clip to stabilize the rotating tube. Images were collected every 36 deg over the full 360 deg of rotation.
Fig. 2.
CAD renderings indicating key components, such as the motor for sample rotation, the glass window bottom for forward SHG detection, and FEP tubing sample holder and water chamber for index of refraction matching.
B. Sample Preparation for 3D Imaging
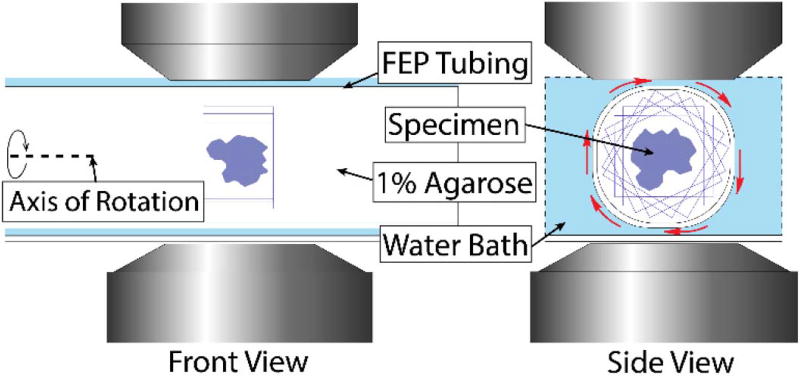
Mouse tail tendon was first optically cleared with 50% glycerol for 12 h prior to imaging [22]. The cleared tendon was placed in FEP tubing (3 mm and 3.5 mm inner and outer diameters, respectively), where the index allows for both flatness of field for scanning the surface of a tube and also permits high optical penetration depth for entire volumetric imaging of the sample. The tube was filled with 1% agarose to hold the sample in place, eliminating sample drift. Initial tests contained a low concentration of 6 µm fluorescent microspheres, which provided geometric descriptors acting as isotropic fiducial markers as they are observed from all orientations. A diagram of the experimental setup is shown in Fig. 3.
Fig. 3.
Diagram of front and side cross section views of the experimental setup. Blue boxes within the tubes represent outlines of the sequential rotating image volumes. The curved arrow and dashed line delineate the axis of rotation.
4. INITIAL MULTI-VIEW VALIDATION USING NEW PLATFORM
We chose tendon to demonstrate the 3D aspects of the new microscope platform. Tendon is well characterized by SHG microscopy and, in the un-modified form, has highly aligned linear fibers that are all in plane. We will further use a twisted tendon as it can be wrapped around the main axis at an arbitrary angle without significantly altering the structure of the fibers themselves, i.e., the individual fibers are still straight.
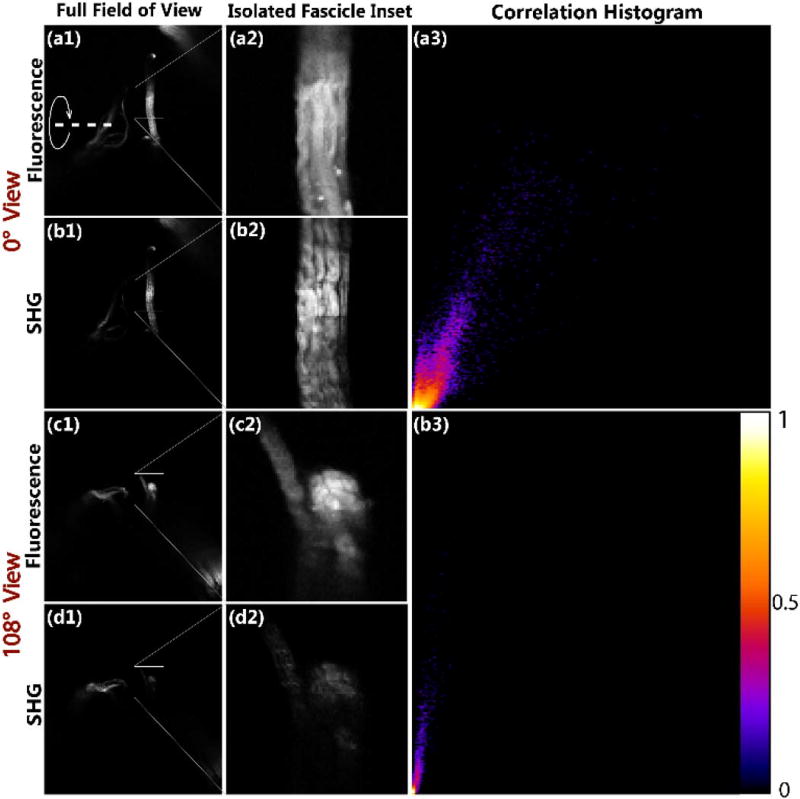
In analogy to our prior work using micro-prisms [14], we initially validated the multi-view approach of the new rotating platform by comparing SHG and TPEF imaging of stained tendon (eosin), where the latter contrast will be isotropic. We obtained these comparisons for two cases, where the isolated tendon fascicle is oriented nearly orthogonally to the excitation at angle 0° (Fig. 4, rows 1 and 2) and for the case at angle 108° when it is oriented parallel to the laser excitation (Fig. 4, rows 3 and 4). Column 2 of Fig. 4 shows zoomed images of the isolated fascicle used for co-localization analysis. The 0° orientation of full fields of view images and the isolated fascicle TPEF (a1, a2, respectively) and SHG (b1, b2, respectively) appear very similar with nearly the same contrast. However, when the sample is rotated 108°, the fascicle turns parallel to the excitation laser, and as a result, the SHG emission is sharply diminished (d2) compared to the high intensity emission of TPEF (c2). As predicted, only the portion of collagen fiber bundles slightly off-axis (top of the bundle) can be seen, and still this portion has much lower overall comparative intensity.
Fig. 4.
Full fields of view images of (a1) fluorescence and (b1) SHG at 0° and (c1) fluorescence and (d1) SHG at 108° view. Isolated tendon fascicle of (a2) fluorescence and (b2) SHG at 0° view and (c2) fluorescence and (d2) SHG at 108° view. 2D intensity correlation histograms for (a3) 0° view and (b3) 0°. The x and y axes for 2D intensity histograms correspond to normalized SHG and TPEF image pixel intensities, respectively. The heat map is normalized from highest pixel frequency to lowest in 256 color bins. Field size for full images (column1) = 483 × 483 µm. The curved arrow and dashed line delineate the axis of rotation. Field size for fascicle insets (column2) = 80 × 80 µm.
Pearson’s correlation analysis was performed to statistically evaluate the degree of similarity of TPEF and SHG images on a pixel-by-pixel basis for the two different orientations. The histogram of the co-localized intensities of the respective TPEF and SHG distributions for the 0° and 108° views are shown in Fig. 4(a3) and 4(b3). In this representation, all points would fall on the diagonal for perfect correlation. For the 0° view when the fibers run orthogonally to the laser excitation, the images were highly but not perfectly correlated (r = 0.60). In strong contrast, when comparing the image stacks when the collagen fibers were oriented en face, the images were not correlated (r = −0.11). The greatly diminished SHG intensity of the collagen fibers aligned parallel with the laser excitation agrees with that predicted by Eqs. (3)–(5) and with our previous results with the micro-prism configuration [14].
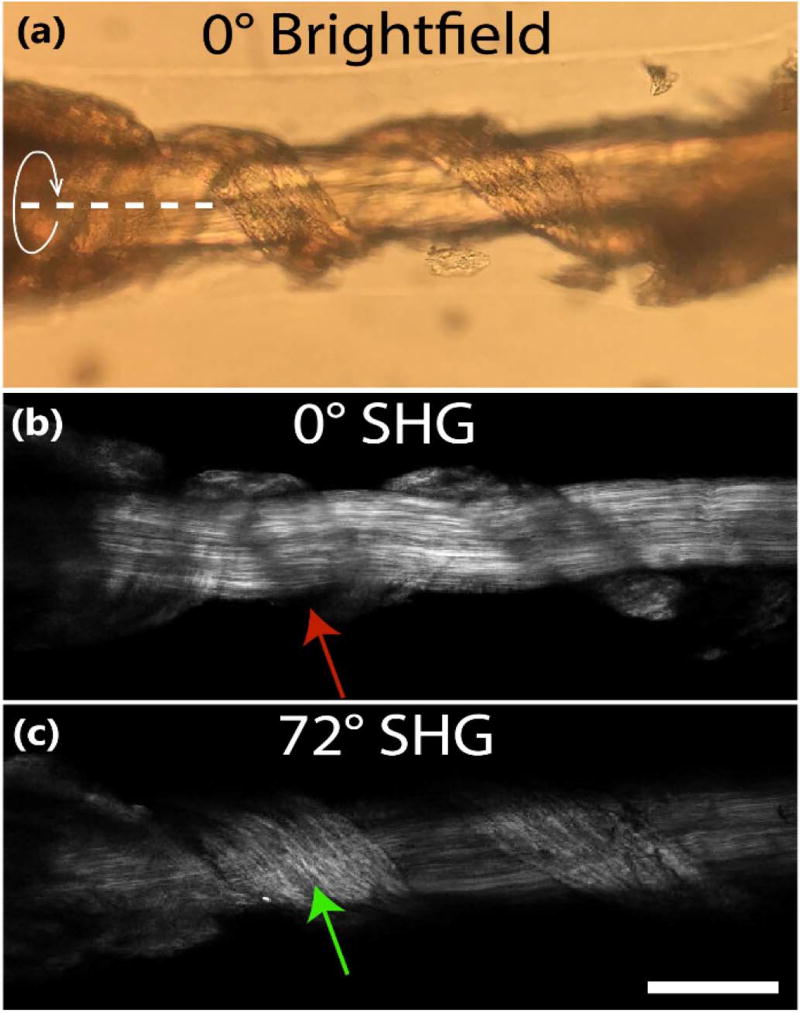
As further initial validation, we twisted a tendon such that there were fibers rotated at arbitrary angles from the primary long axis of the fascicle to demonstrate that fibers from different planes can be viewed only from different excitation angles. Figure 5 shows the brightfield image [Fig. 5(a)] and its corresponding SHG image [Fig. 5(b)] at angle 0°. As expected, the SHG emission is diminished as the fibers coil around the straight tendon fibers centered horizontally across the image. A region in which the twisted fibers vanish is indicated by the red arrow. Figure 5(c) shows the SHG image when the same coiled tendon rotates 72° (rotating upward). The green arrow indicates the now clearly observed fibers that were previously unable to be visualized when they were oriented directly on-axis to the excitation direction. These collective imaging observations (Figs. 4 and 5) comparing SHG and TPEF from straight and twisted fibers validate the multi-view approach afforded by the new platform.
Fig. 5.
(a) Brightfield and (b) SHG images of coiled tendon oriented at 0°; (c) SHG image of tendon rotated 72°. The red arrow indicates missing fibers due to orientation parallel to excitation and the green arrow shows fibers reappearing after the 72° sample rotation. The curved arrow and dashed line delineate the axis of rotation. Scale bar = 100 µm.
5. IMAGE PREPROCESSING, REGISTRATION, AND RECONSTRUCTION
Our goal is to obtain true 3D representations, and in the next section, we use image processing algorithms (preprocessing, registration, and reconstruction) to fuse multi-view image stacks into full-3D volumes for visualization of all collagen fibers throughout the specimen volume.
A. Preprocessing
Preprocessing consisted of de-noising by means of an intensity threshold and determining the approximate location of the center of the sample within each stack. This along with the known rotation gave an initial guess of the rigid transformation for the registration. Initially, the first image stack (angle 0) is selected as a coordinate reference for transformation of all other stacks.
B. Registration and Reconstruction
Prior to reconstruction, image registration is necessary for determining the spatial transform that co-localizes objects from one image stack to corresponding points in the second and to account for any inaccuracies in the motor rotation and any subpixel translation.
1. Image-Based Approach for Registration
Our first registration technique used isotropic stationary fluorescent microspheres as reliable fiducial markers, as this is a well-established approach. We specifically used the FIJI plugin for multi-view 3D image registration [23], as it enables sample-independent registration of multi-view volume stacks at different orientations. Here, microspheres are first detected using a difference of Gaussian filters to reduce the registration to simply matching point clouds. The algorithm identifies each bead constellation of its neighboring microspheres as translation and rotation invariant local geometric locators. Finally, displacement of all microsphere clusters was globally minimized using an optimization scheme iteratively converging to the final true correspondence (average within ~1 pixel displacement).
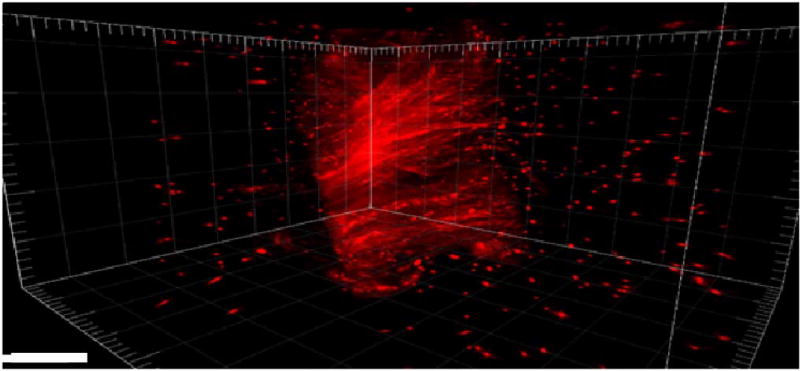
We first used this approach to visualize all fiber orientations within the knot-tied mouse-tail tendon. Figure 6 shows a snapshot of a final 3D rendering (Imaris software) after all 10 SHG volumes were reconstructed. For full visualization, a video of this final 3D rendering spinning can be found in Visualization 1. The complete collagen fiber structure is now able to be fully visualized with high fidelity.
Fig. 6.
Full 3D reconstructed knot-tied mouse-tail tendon using bead-based reconstruction. Scale bar = 100 µm.
2. Intensity-Based Approaches for Registration
Although our application using laser scanning SHG is different than the bead-based registration used in light sheet microscopy, this approach was successful in reconstructing the 3D structure of the tendon. However, a primary advantage of SHG microscopy is the endogenous contrast, and we do not wish to rely on fluorescence for actual applications. For registration without fluorescent microspheres, image stacks no longer have reliable fiducial markers, and further, because all oriented collagen fibers are not visible in all views, intensity-based registration is necessary. While we use only one image modality for collecting image stacks, monomodal registration algorithms fail, as one-to-one mapping of pixel intensities is impossible due to the electric dipole constraints presented in Section 2. Thus we use a multimodal algorithm based on work originally published by Mattes et al. that has been integrated as a built-in function in the image processing toolkit in Matlab (MathWorks, Natick, Massachusetts) [24]. This function is based on a variation of the normalized mutual information metric designed for nonrigid transformations but is also applicable to the rigid transformations used in this work.
These methods have been well established previously [24,25] and we provide only the salient features. One image stack is assigned as the reference volume and one as the test volume, where the respective voxels are denoted as u(x, y, z) and v(x, y, z). The statistical-based measure of mutual information works robustly in the presence of noise and varying amounts of image overlap, where mutual information is defined as a measure of alignment of images derived from probabilistic measures of image intensity values. This formulation requires that mutual information is expressed as a continuous function to allow its explicit differentiation. As a result, the components must also be expressed as continuous functions, and this is done in the three following ways. First, B-splines are utilized to represent the interpolated test image, then a Parzen window technique estimates the joint probability distribution between the test and reference images, and finally, cubic B-splines are used for deformation modeling.
For example, suppose T is a transform function from the coordinate frame of the reference to the test image stack. Here we wish to maximize the normalized mutual information, I, of the two stacks as normalized mutual information is invariant to changes in image overlap. I is maximized with this transformation function:
| (6) |
where normalized mutual information is the sum of the marginal entropies divided by the joint entropy described by
| (7) |
where H(u) is the entropy of a random viable defined by
| (8) |
where p(u) is the probability distribution function. Equation (7) is maximized through Eq. (6) to find the optimum registration transformation for the test volume. The registration transformation is then applied to the test image stack, which is concurrently re-sampled to match the sampling rates of the reference volume in all three dimensions, where this is necessary as raw data image stacks will have different lateral and axial point spread functions.
C. Reconstruction
We now evaluate two approaches to reconstruct the co-registered images according to their local information content, and aim to optimize the sharp, high-detail content versus the blurry, low-detail aspects of the individual images. Beyond missing fibers oriented parallel and at small tile angles to the laser, images also lose information due to degradation from intensity attenuation with increasing depth from scattering as well as axial blurring intrinsic to different lateral and axial focusing abilities.
1. High-Frequency Weighted Fusion
While the intensity attenuation results in a decrease in amplitude as a function of depth of the image stack due to primary and secondary scattering filters (scattering of excitation and emission, respectively) [22], the blurring acts as a low-pass filter. Unweighted reconstruction algorithms based on simple average or maximum intensities were unsuccessful due to the profound axial blurring when the image stacks are fused. This is because the blurring increases the intensities of dark regions around a high-intensity object.
The high-fidelity portions of the image can be more robustly identified by the high-frequency image content, and, as a result, reconstruction utilizing a high-frequency weighted fusion algorithm in conjunction with a maximum amplitude pixel function was successful in deblurring the axial contributions of the image stacks. Here the fused images based on various weighting methods, Wα, are then computed by
| (9) |
This algorithm employs a second-order derivative of the image intensity by [26]
| (10) |
where the second intensity differentials are calculated using directional gradients. This weighting function identifies and amplifies the high-frequency components of the images; however, as a consequence, the high-frequency noise in the dimmer regions of the images is visibly amplified but can be overcome simply by applying a noise threshold mask.
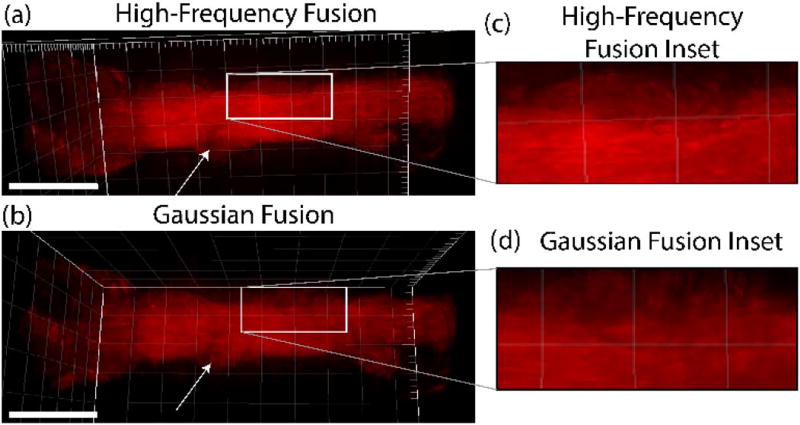
We demonstrate this process using the coiled tendon shown previously in Figs. 5 and 6. Figure 7(a) shows a snapshot of the final 3D rendering of this fusion again using Imaris visualization software. We have included the video of the resulting spinning 3D rendering in Visualization 2. The final fusion clearly shows full structural aspects of the coiled tendon.
Fig. 7.
(a) Full 3D reconstructed coiled mouse-tail tendon using the high-frequency fusion algorithm. (b) Full 3D reconstruction using the Gaussian-weighted fusion algorithm. The arrows delineate a region where the recovered contrast is different and the Gaussian method reveals different features. Scale bar is 100 µm. Expanded insets (c) and (d) show the fiber resolution is superior in the high frequency fusion method. The area of the inset in each case is 100 µm × 45 µm.
2. Gaussian-Weighted Fusion
Another method to approximate the local, detailed information is by evaluating the entropy in the local environment of each pixel in each view α and using those values as weighing factors for the averaging of every individual pixel over the registered volume. For this purpose, we investigated Gaussian-weighted fusion to optimize the contrast in the final reconstructed image volume. Since using an approximation to the regional variance as computing local entropies is computationally expensive, we implemented a previously established algorithm for reconstruction, which first convolves images with a Gaussian kernel, followed by a pixel-wise squared difference operator, then a second Gaussian kernel convolution noted by [27,28]
| (11) |
Next, the Gaussian-weighted reconstruction algorithm was used on the same preprocessed and registered coiled tendon image volumes. Figure 7(b) shows the final 3D rendering results after all SHG volumes were reconstructed using the Gaussian convolution-based method. A video of this final 3D rendering rotated can be found in Visualization 3.
These approaches have not been used previously in reconstructing SHG images and we do not a priori know which method provides superior performance. As preliminary observations, the final Gaussian-weighted fusion results in less ability to resolve certain fibers than the high-frequency fusions, yet the full structure is still apparent. The insets in Figs. 7(c) and 7(d) show expanded views of the superior resolution of the latter. Conversely, the Gaussian-weighted fusion technique reduces the dim region artifacts that appear in the combined image of the high-frequency weighted fusion, where the arrows point to one such region.
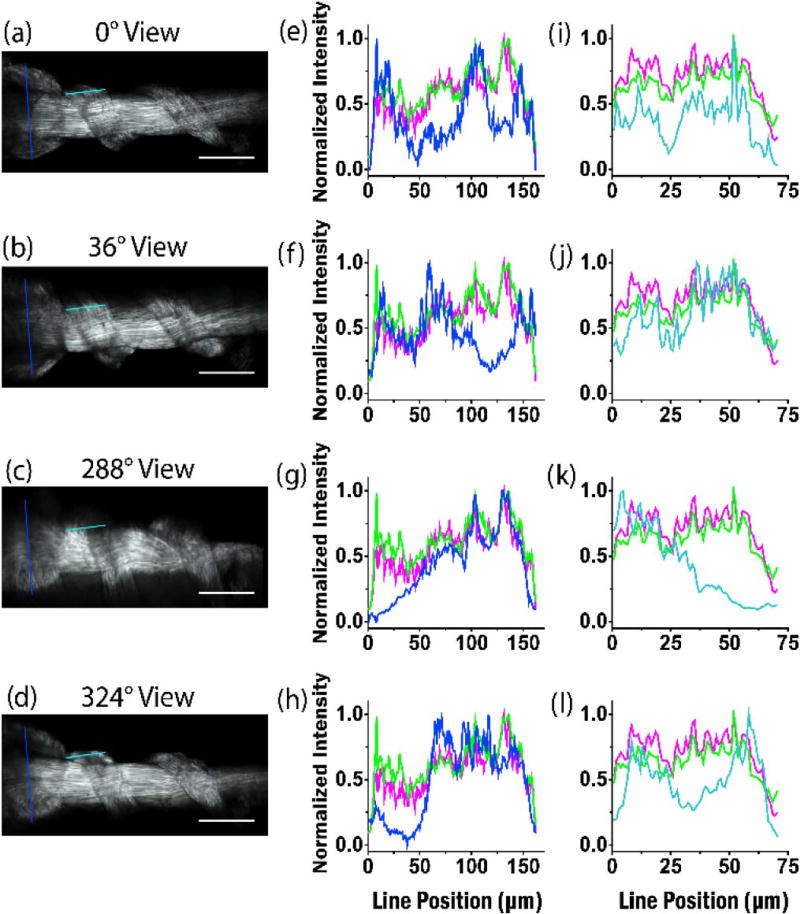
To better assess contrast comparisons regarding the two fusion techniques and the single views, line profile intensity plots were performed across regions of single view renderings and the two reconstructions. Figure 8 depicts the results of the normalized intensity plots of lines drawn on the respective images for the same optical plane and line location from four different angles for two regions of the tendon. These line plots (blue) show regions of low SHG intensity in all the single view assessments where fibers are unable to be visualized compared to the two different reconstructions. A second region (cyan) is compared, and the results are in the right-hand column. Here the high-frequency fusions showed more overall contrast than the Gaussian fusion.
Fig. 8.
Contrast assessments of identical planes of the coiled tendon via line profile intensity plots drawn in the exact same position. Single views are shown in (a)–(d) and the respective intensities are plotted in blue in (e)–(h). The results for the high-frequency fusion and Gaussian-weighted reconstructions (Fig. 7) are plotted in purple and green, respectively. Line plots from a second region are shown in (i)–(l), where the single view intensities are shown in cyan. Scale bar = 100 µm.
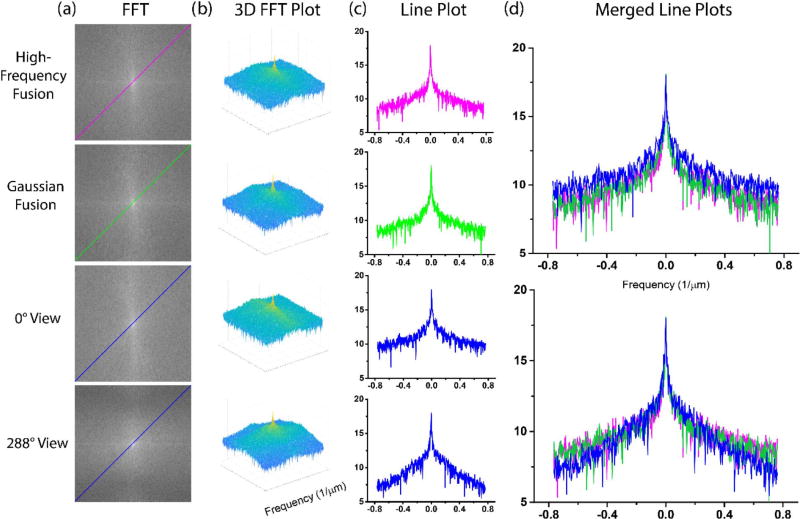
We also assess the performance via performing an FFT across the image for these same conditions. The FFTs for two views and the two reconstructions are shown in Fig. 9 in the left column [Fig. 9(a)], and it is clear that the spatial frequencies are different for the single views, especially at 288 deg, which is missing significant high-frequency components. This is also seen in the 3D FFT plots in column (b).
Fig. 9.
FFTs and analysis of obtained spatial frequencies for two views (0 and 288 deg; shown in blue) and the high-frequency (purple) and Gaussian-weighted (green) fusions.
To determine the distribution of frequency components, as shown in Fig. 9, we take a diagonal of the FFT in each case. We find that at 0 deg, the majority of the distribution is the same in each case. However, at the 288 deg views, we find that the single view misses high-frequency components. This was also the case for other angles (not shown). The high-frequency-weighted reconstruction performs slightly better for higher spatial frequencies than the Gaussian-weighted approach, where the axial blurring is significantly less in the former [see Fig. 7(c) versus Fig. 7(d)]. Conversely, the computation time is approximately threefold longer for the high-frequency-weighted fusion, but is still only about 3 min per view on a standard laptop. Given this reasonable computational time, we suggest the high-frequency-weighted reconstruction may be the better approach for these types of SHG images as it could be better in terms of obtaining all the fiber orientations.
6. DISCUSSION
By drawing upon previous registration and reconstruction techniques from light sheet microscopy and also upon our previous work, we have established a tomographic platform suitable for laser scanning SHG multi-view imaging of collagenous tissues. This platform is superior to our previous report using micro-prisms as it is truly a multiple view approach, where the latter was limited to two orthogonal views. Moreover, that configuration is applicable only to backward collected SHG, which is a significant limitation, both in terms of signal intensity (especially in thick tissues) as well as being able to perform directional analysis.
We stress these constraints are not applicable to fluorescence-based methods, as fluorescent tags, either exogenous dyes or fluorescent proteins, freely rotate faster than the emission lifetime and, thus, have no net orientation. As a result, excitation and emission occurs over all angles, as the approach here would not be necessary strictly from a loss of information standpoint. However, due to the isotropic excitation and emission of fluorescence, orientation data obtained through SHG polarization analyses is not achievable in fluorescence microscopy (with the exception of membrane-bound fluorescent dyes), as the tag is imaged rather than the protein itself. This is in stark contrast to SHG where the collagen structure is itself visualized, and, as previously demonstrated, polarization analysis can yield unique structural information not achievable by other optical microscopy methods [1]. We assert that the effort needed for the 3D SHG imaging/reconstruction is greatly outweighed by the benefits of collection of missing information that can be now be fully analyzed by polarization and directional methods.
We performed the work at low to medium magnification and NA, as the fields of view need to be several hundred micrometers in order to sample sufficient area to perform the registration from different views. We used a somewhat limited data set, where the views were taken every 36 deg of 360 deg of rotation. The 36 deg rotation increment was chosen based on a cost-benefit analysis regarding image acquisition time and computational expenses for obtaining more images and the amount of added benefit to the image quality of the final tomographic reconstructions. Specifically, theoretical considerations regarding the SHG intensity decreasing as a function of sine squared angle of the fiber relative to the excitation angle [Eqs. (3)–(5)] allowed us to compute theoretical fiber intensities versus excitation angle for multiple combinations of angles for image acquisition. We determined the 36 deg increments permitted fiber visualization with an intensity ratio greater than 90% for every fiber orientation in at least two separate image stacks. In comparison, by doubling and quadrupling the total acquisitions by obtaining image stacks to every 18 and 9 deg, only a 7% and 10% increase in fiber intensities would be obtained, respectively. We note that due to the anisotropy in focal volume and quadratic nature of SHG, the resulting intensity is highly sensitive to orientation but the registration process compensates for this effect.
The sampling used here is significantly less than is used in true tomographies, such as optical projection tomography (OPT) [16], which is a widefield scheme where the sampling is of the order of a degree or less. However, due to the intrinsic SHG optical sectioning, we note that good quality reconstructions are still obtained. The primary limitation here is data acquisition, where smaller rotations will require proportionally longer acquisitions. In analogy with tomographic methods, the specimen needs to be optically cleared for sufficient penetration throughout the thickness. This is not a strong consideration, as we have shown that collagenous tissues are efficiently cleared by 50% glycerol, with only a few hours immersion and, moreover, that the process is almost completely reversible [22].
For this platform, a fairly low magnification lens is needed to obtain a sufficient number of views, where we used a 10× and 20× with 0.4 and 0.5 NA, respectively. For tendon, this was sufficient to resolve the fibers, and did not lead to loss of information in the reconstruction. We sample voxels at least at the Nyquist frequency, and, if the individual fibers are resolved, the somewhat low NA does not deleteriously affect the resulting reconstruction. For some tissues with smaller fibers, it would be advantageous to have low magnification at higher NA for superior resolution.
7. CONCLUSIONS
Using the new platform, we have achieved true 3D multi-view SHG imaging of collagen in tissue as a step toward general SHG tomography. The cylindrical rotational approach greatly improves upon the two orthogonal view method we implemented previously with reflective micro-prisms. We validated the rotational approach both visually and through analysis of reconstructed images. We suggest the high-frequency-weighted fusion approach somewhat outperforms the Gaussian-weighted form based on retention of higher frequency components. We stress that a different analysis solution than used in light sheet microscopy was required due to the dependence of the SHG intensity on the axial alignment of the fibers, where this issue is not operative in fluorescence imaging, as it is an isotropic modality. The platform is compatible with previous SHG analyses that we and others have previously implemented, such as polarization resolved analyses as well as direction (forward-backward) analyses. Thus, we anticipate the technology will further the use of SHG in imaging diseased tissues.
Supplementary Material
Acknowledgments
We thank Jeremy Rogers, Rock Mackie, Jeremy Bredfeldt, and Richard Superfine for helpful conversations.
Funding. National Institutes of Health (NIH) (5T32CA9206-38, 1R01CA206561-01, R21 HL 126190); National Science Foundation (NSF) (CBET-1402757); National Cancer Institute (NCI) (1R01CA206561-01).
References
- 1.Chen X, Nadiarynkh O, Plotnikov S, Campagnola PJ. Second harmonic generation microscopy for quantitative analysis of collagen fibrillar structure. Nat. Protocols. 2012;7:654–669. doi: 10.1038/nprot.2012.009. [DOI] [PMC free article] [PubMed] [Google Scholar]
- 2.Provenzano PP, Eliceiri KW, Campbell JM, Inman DR, White JG, Keely PJ. Collagen reorganization at the tumor-stromal interface facilitates local invasion. BMC Med. 2006;4:38. doi: 10.1186/1741-7015-4-38. [DOI] [PMC free article] [PubMed] [Google Scholar]
- 3.Brown E, McKee T, di Tomaso E, Pluen A, Seed B, Boucher Y, Jain RK. Dynamic imaging of collagen and its modulation in tumors in vivo using second-harmonic generation. Nat. Med. 2003;9:796–800. doi: 10.1038/nm879. [DOI] [PubMed] [Google Scholar]
- 4.Cicchi R, Massi D, Sestini S, Carli P, De Giorgi V, Lotti T, Pavone FS. Multidimensional non-linear laser imaging of basal cell carcinoma. Opt. Express. 2007;15:10135–10148. doi: 10.1364/oe.15.010135. [DOI] [PubMed] [Google Scholar]
- 5.Pena AM, Fabre A, Debarre D, Marchal-Somme J, Crestani B, Martin JL, Beaurepaire E, Schanne-Klein MC. Three-dimensional investigation and scoring of extracellular matrix remodeling during lung fibrosis using multiphoton microscopy. Microsc. Res. Tech. 2007;70:162–170. doi: 10.1002/jemt.20400. [DOI] [PubMed] [Google Scholar]
- 6.Sun W, Chang S, Tai DC, Tan N, Xiao G, Tang H, Yu H. Nonlinear optical microscopy: use of second harmonic generation and two-photon microscopy for automated quantitative liver fibrosis studies. J. Biomed. Opt. 2008;13:064010. doi: 10.1117/1.3041159. [DOI] [PubMed] [Google Scholar]
- 7.Campagnola PJ, Dong CY. Second harmonic generation microscopy: principles and applications to disease diagnosis. Laser Photon. Rev. 2011;5:13–26. [Google Scholar]
- 8.Wen B, Campbell KR, Tilbury K, Nadiarnykh O, Brewer MA, Patankar M, Singh V, Eliceiri KW, Campagnola PJ. 3D texture analysis for classification of second harmonic generation images of human ovarian cancer. Sci. Rep. 2016;6:35734. doi: 10.1038/srep35734. [DOI] [PMC free article] [PubMed] [Google Scholar]
- 9.Lacomb R, Nadiarnykh O, Campagnola PJ. Quantitative SHG imaging of the diseased state osteogenesis imperfecta: experiment and simulation. Biophys. J. 2008;94:4504–4514. doi: 10.1529/biophysj.107.114405. [DOI] [PMC free article] [PubMed] [Google Scholar]
- 10.Tilbury KB, Campbell KR, Eliceiri KW, Salih SM, Patankar M, Campagnola PJ. Stromal alterations in ovarian cancers via wavelength dependent second harmonic generation microscopy and optical scattering. BMC Cancer. 2017;17:102. doi: 10.1186/s12885-017-3090-2. [DOI] [PMC free article] [PubMed] [Google Scholar]
- 11.Liu Z, Quinn KP, Speroni L, Arendt L, Kuperwasser C, Sonnenschein C, Soto AM, Georgakoudi I. Rapid three-dimensional quantification of voxel-wise collagen fiber orientation. Biomed. Opt. Express. 2015;6:2294–2310. doi: 10.1364/BOE.6.002294. [DOI] [PMC free article] [PubMed] [Google Scholar]
- 12.Brackmann C, Dahlberg JO, Vrana NE, Lally C, Gatenholm P, Enejder A. Non-linear microscopy of smooth muscle cells in artificial extracellular matrices made of cellulose. J. Biophoton. 2012;5:404–414. doi: 10.1002/jbio.201100141. [DOI] [PubMed] [Google Scholar]
- 13.Rice WL, Firdous S, Gupta S, Hunter M, Foo CW, Wang Y, Kim HJ, Kaplan DL, Georgakoudi I. Non-invasive characterization of structure and morphology of silk fibroin biomaterials using non-linear microscopy. Biomaterials. 2008;29:2015–2024. doi: 10.1016/j.biomaterials.2007.12.049. [DOI] [PMC free article] [PubMed] [Google Scholar]
- 14.Wen B, Campbell KR, Cox BL, Eliceiri KW, Superfine R, Campagnola PJ. Multi-view second-harmonic generation imaging of mouse tail tendon via reflective micro-prisms. Opt. Lett. 2015;40:3201–3204. doi: 10.1364/OL.40.003201. [DOI] [PMC free article] [PubMed] [Google Scholar]
- 15.Huisken J, Swoger J, Del Bene F, Wittbrodt J, Stelzer EH. Optical sectioning deep inside live embryos by selective plane illumination microscopy. Science. 2004;305:1007–1009. doi: 10.1126/science.1100035. [DOI] [PubMed] [Google Scholar]
- 16.Sharpe J, Ahlgren U, Perry P, Hill B, Ross A, Hecksher-Sorensen J, Baldock R, Davidson D. Optical projection tomography as a tool for 3D microscopy and gene expression studies. Science. 2002;296:541–545. doi: 10.1126/science.1068206. [DOI] [PubMed] [Google Scholar]
- 17.Stoller P, Kim BM, Rubenchik AM, Reiser KM, Da Silva LB. Polarization-dependent optical second-harmonic imaging of a rat-tail tendon. J. Biomed. Opt. 2002;7:205–214. doi: 10.1117/1.1431967. [DOI] [PubMed] [Google Scholar]
- 18.Erikson A, Ortegren J, Hompland T, de Lange Davies C, Lindgren M. Quantification of the second-order nonlinear susceptibility of collagen I using a laser scanning microscope. J. Biomed. Opt. 2007;12:044002. doi: 10.1117/1.2772311. [DOI] [PubMed] [Google Scholar]
- 19.Boyd RW. Nonlinear Optics. 3. Chap. 1. Academic; 2008. The nonlinear optical susceptibility; pp. 1–67. [Google Scholar]
- 20.Tuer AE, Akens MK, Krouglov S, Sandkuijl D, Wilson BC, Whyne CM, Barzda V. Hierarchical model of fibrillar collagen organization for interpreting the second-order susceptibility tensors in biological tissue. Biophys. J. 2012;103:2093–2105. doi: 10.1016/j.bpj.2012.10.019. [DOI] [PMC free article] [PubMed] [Google Scholar]
- 21.Kaufmann A, Mickoleit M, Weber M, Huisken J. Multilayer mounting enables long-term imaging of zebrafish development in a light sheet microscope. Development. 2012;139:3242–3247. doi: 10.1242/dev.082586. [DOI] [PubMed] [Google Scholar]
- 22.LaComb R, Nadiarnykh O, Carey S, Campagnola PJ. Quantitative SHG imaging and modeling of the optical clearing mechanism in striated muscle and tendon. J. Biomed. Opt. 2008;13:021109. doi: 10.1117/1.2907207. [DOI] [PubMed] [Google Scholar]
- 23.Preibisch S, Saalfeld S, Schindelin J, Tomancak P. Software for bead-based registration of selective plane illumination microscopy data. Nat. Methods. 2010;7:418–419. doi: 10.1038/nmeth0610-418. [DOI] [PubMed] [Google Scholar]
- 24.Mattes D, Haynor DR, Vesselle H, Lewellyn TK, Eubank W. Nonrigid multimodality image registration. Proc. SPIE. 2001;4322:1609–1620. [Google Scholar]
- 25.Maes F, Collignon A, Vandermeulen D, Marchal G, Suetens P. Multimodality image registration by maximization of mutual information. IEEE Trans. Med. Imaging. 1997;16:187–198. doi: 10.1109/42.563664. [DOI] [PubMed] [Google Scholar]
- 26.Krzic U. Ph.D. dissertation. Heidelberg University; 2009. Multiple-view microscopy with light-sheet based fluorescence microscope. [Google Scholar]
- 27.Preibisch S, Rohlfing T, Hasak MP, Tomancak P. Mosaicing of single plane illumination microscopy images using groupwise registration and fast content-based image fusion. Proc. SPIE. 2008;6914:69140E. [Google Scholar]
- 28.Lindeberg T. Scale-space theory: a basic tool for analyzing structures at different scales. J. Appl. Stat. 1994;21:225–270. [Google Scholar]
Associated Data
This section collects any data citations, data availability statements, or supplementary materials included in this article.


