Abstract
Objectives
The goal of this study was to investigate how the spectral and temporal properties in background music may interfere with cochlear implant (CI) and normal hearing listeners' speech understanding.
Design
Sentence recognition thresholds (SRTs) were adaptively measured in 11 CI and 9 NH subjects. CI subjects were tested while using their clinical processors; NH subjects were tested while listening to unprocessed audio. Speech was presented with different music maskers (excerpts from musical pieces), and with steady, speech-shaped noise. To estimate the contributions of energetic and informational masking, SRTs were also measured in “music-shaped noise” and in music-shaped noise modulated by the music temporal envelopes.
Results
NH performance was much better than CI performance. For both subject groups, SRTs were much lower with the music-related maskers than with speech-shaped noise. SRTs were strongly predicted by the amount of energetic masking in the music maskers. Unlike CI users, NH listeners obtained release from masking with envelope and fine structure cues in the modulated noise and music maskers.
Conclusions
While speech understanding was greatly limited by energetic masking in both subject groups, CI performance worsened as more spectro-temporal complexity was added to the maskers, most likely due to poor spectral resolution.
Keywords: cochlear implant, music, masking, streaming, segregation
Introduction
Like normal-hearing (NH) listeners, cochlear implant (CI) users regularly encounter music in various listening environments (e.g., movie theaters, sport events, restaurants, etc.). While music may enhance many environments, music may also interfere with speech understanding. Music differs from environmental noise or interfering speech in terms of acoustic and semantic properties. Given the spectral degradation associated with CI signal processing, acoustic features (and consequently, semantic information) may be lost; as such, music may mask target speech similarly to environmental noise. While energetic masking might be expected to strongly limit speech understanding in the presence of competing music, other factors may contribute to CI users' susceptibility to masking by music (e.g., the competing temporal envelopes in speech and music).
For NH listeners, interference with target speech from music may be due to energetic masking (overlapping frequency regions) and/or informational masking (similar dynamic and/or semantic cues). Energetic masking occurs at the periphery (Oxenham, 2003), and is limited by the frequency and intensity of the masker. Informational masking does not necessarily depend on the physical interactions between a masker and signal (e.g., frequency overlap), but reflects the difficulty in perceiving a target in the context of other similar sounds (e.g., having similar temporal envelopes; Durlach et al., 2003; Leek et al., 1991). As such, informational masking occurs at more central levels of auditory processing (Scott et al., 2004). For example, with competing speech, both sources are modulated at similar rates, contain similar frequency content, and carry meaningful information. In this case, listeners must use voice pitch, timbre and/or timing cues to segregate and stream the target speech. Dynamic non-speech sounds (e.g., gated noise) may also produce informational masking, depending on the spectral and/or temporal characteristics, e.g., temporal interference with the speech envelope region between 3-8 Hz (Drullman et al., 1994). The effects of informational masking also depend on attentional factors, listener expectations, and uncertainty about the signal's characteristics (Oxenham, et al., 2003).
Like competing speech or environmental noise, music can produce energetic and/or informational masking on target speech. The frequency spectrum of music is generally broader and more dynamic than that of speech. Depending on the specific spectral content, music may produce different amounts of energetic masking on speech signals. For example, popular music is often produced to limit spectral “crowding” between vocals and accompanying instruments. Music may also produce informational masking, as music and speech may be grouped together (Bregman, 1990). Semantic cues may also attract listeners' attention from target speech. Indeed, many factors may influence a listener's attention to background music (e.g., familiarity, aesthetics, etc.).
Due to limited spectral resolution, it is difficult for CI users to segregate and stream competing sound sources. Unlike NH listeners, CI users seem unable to utilize large differences in pitch, timbre or timing to segregate and stream competing melodic contours (Galvin et al., 2009; Zhu et al., 2011) or talkers (Stickney et al., 2004). The broad current spread associated with electrical stimulation limits performance, as many CI users have difficulty segregating and streaming simple, single-channel stimuli even when large pitch differences are available (Chatterjee et al., 2006; Hong and Turner, 2006; Oxenham, 2008). Similarly, CI users seem unable to “listen in the dips” of dynamic maskers and understand target speech (Nelson et al., 2003). Fu and Nogaki (2005) argued that CI users' susceptibility to dynamic noise was due to channel interactions between the implanted electrodes. CI users seem able to access only 6-8 spectral channels (Friesen et al., 2001), too few to support segregation and streaming of complex, competing sound sources (Shannon et al., 2004). This poor spectral resolution/channel interaction also limits CI users' music perception and appreciation. While CI users' rhythm perception is comparable to that of NH listeners (Kong et al., 2004), melodic pitch perception is much poorer than that of NH listeners (e.g., Galvin et al., 2005; Gfeller et al., 1997; Kong et al., 2004). CI users often comment that music can sound “noisy,” especially when played by large instrument ensembles. As such, background music may serve more as background noise for CI users.
Given the spectral and temporal dynamics of music, music would be expected to produce less masking than broadband noise or competing speech. However, given the poor spectral resolution and the attendant difficulties with spectrally and temporally complex maskers, CI users may be more susceptible to interference by background music. Relatively little is known about CI speech perception in the presence of background music. Gfeller et al. (2008) reported that background music significantly interfered with CI listeners' word recognition. In a related study, Gfeller et al. (2009) reported that sung musical lyric recognition significantly worsened as the accompanying music became more complex (i.e., from a single to multiple instruments).
In this study, HINT sentence recognition by CI users and NH listeners was measured in the presence of different music maskers, as well as in the presence of steady, speech-shaped noise (i.e., maximal energetic masking). To estimate contributions of energetic masking, sentence recognition was measured in the presence of steady noise filtered by the spectral envelopes of the music maskers (“music-shaped noise”). To estimate the susceptibility to dynamic maskers, sentence recognition was also measured with music-shaped noise modulated by the temporal envelopes of the music maskers. Thus, the maskers progressed from energetic (speech- or music-shaped noise) to a mix of energetic and informational (music and modulated music-shaped noise). The music maskers also contained spectro-temporal complexity and fine structure cues not included in the music-shaped and/or modulated noise maskers. We hypothesized that, given differences in the frequency spectra for music and speech, energetic masking provided by the music maskers would limit interference by the music maskers. Because of the limited spectral resolution, we hypothesized that, different from NH listeners, CI users would be unable to utilize envelope or fine structure cues to segregate speech and music.
Methods
Subjects
Eleven post-lingually deafened adult CI users (7 female, 4 male) participated in this study. The mean CI subject age was 62 years (range: 25 to 79 years). All CI subjects had at least one year experience with their device. Three subjects were unilateral CI users, five were bilateral CI users and three were bimodal listeners (CI with a hearing aid in the contralateral ear). Table 1 lists CI subject demographics. CI subjects were tested using only clinical speech processors and settings. Volume and sensitivity were set for comfortably loud conversation levels (i.e., everyday settings); once set, these were not changed during testing. Bilateral CI users were tested while wearing both devices. Bimodal subjects were tested using their CI alone. Nine NH listeners (4 female, 5 male) served as experimental controls. The mean NH subject age was 36.5 years (range: 18 to 55 years). NH subjects all had pure tone threshold averages better than 25 dB HL for frequencies between 500, 1000, 2000 and 4000 Hz. All subjects were paid for their participation, and all provided informed consent before participating in the experiment.
Table 1.
CI subject demographic information. F120 = Fidelity 120; ACE = Advanced Combination Encoder; SPEAK = Spectral Peak encoder.
| Subject | Gender | Age at testing (yrs) | CI experience (yrs) | Ear: CI Device (Strategy) | Music experience |
|---|---|---|---|---|---|
| CI-1 | F | 53 | 4 | L: HiRes 90K (F120) R: HiRes 90K (F120) |
No |
| CI-2 | F | 77 | 10 | R: Nucleus 24 (ACE) | No |
| CI-3 | F | 76 | 30 | L: Nucleus 22 (SPEAK) R: Nucleus 5 (ACE) |
No |
| CI-4 | M | 59 | 3 | R: Freedom (ACE) | Yes |
| CI-5 | F | 25 | 3 | R: Freedom (ACE) | Yes |
| CI-6 | F | 63 | 20 | L: Nucleus 24 (ACE) R: Nucleus 24 (ACE) |
No |
| CI-7 | M | 72 | 1 | R: Freedom (ACE) | No |
| CI-8 | F | 67 | 7 | R: Freedom (ACE) | Yes |
| CI-9 | F | 66 | 2 | L: Freedom (ACE) R: Freedom (ACE) |
Yes |
| CI-10 | M | 56 | 14 | L: Freedom (ACE) R: Freedom (ACE) |
No |
| CI-11 | M | 79 | 15 | L: Nucleus 22 (SPEAK) | No |
Stimuli
Masked sentence recognition was assessed using HINT sentences (Nilsson et al., 1994). The HINT stimulus set consists of 260 sentences of easy to moderate difficulty produced by one male talker. HINT sentence recognition was measured for various maskers, including: 1) speech-shaped noise (SSN), 2) music-shaped noise (MSN), 3) music-shaped noise modulated by the music temporal envelope (MSMN), 4) unprocessed, original musical excerpts (MUS). These maskers are described in detail below. The SSN masker was expected to produce maximal energetic masking, the MSN masker was expected to produce partial energetic masking, and the MSMN masker was expected to allow for potential masking release via “dip-listening” in the masker temporal envelopes. The MUS maskers contained greater spectro-temporal complexity and fine structure cues, which may allow for better segregation of the target speech and MUS maskers. The MUS maskers may have also allowed for reduced masking via semantic cues, as the maskers may be more readily perceived as music, rather than steady or dynamic noise. All masking and speech stimuli were normalized to have the same long-term root-mean-square (RMS) amplitude (65 dBA).
For the SSN masker, white noise was filtered to match the long-term average (LTA) spectrum of the HINT sentences. The MUS maskers consisted of excerpts from five musical pieces (downloaded from www.freeplaymusic.com): “MC Scarlatti Mass for Four Voices 1” (“Four Voices,” hereafter), “Power Theme,” “TV Star Tonight,” Violin Fight,” and “Lounge Lizard.” Figure 1 shows the frequency spectrum (left column) and modulation spectrum (right column) for each song and a subset of 10 HINT sentences. The frequency spectrum was quite similar for Power Theme, TV Star Tonite, and Violin Fight; in general, there was greater energy for spectral frequencies above 1500 Hz. For Four Voices, there was greater energy for spectral frequencies below 1500 Hz. Lounge Lizard contained less energy for spectral frequencies above 200 Hz. The modulation spectrum was quite similar for Power Theme, TV Star Tonite, Violin Fight and Four Voices, with Lounge Lizard exhibiting sharper peaks between 64 and 300 Hz. In most cases, the modulation was slightly deeper for the HINT sentences for modulation frequencies below 16 Hz. The modulation depth was similar for speech and music above 100 Hz.
Figure 1.
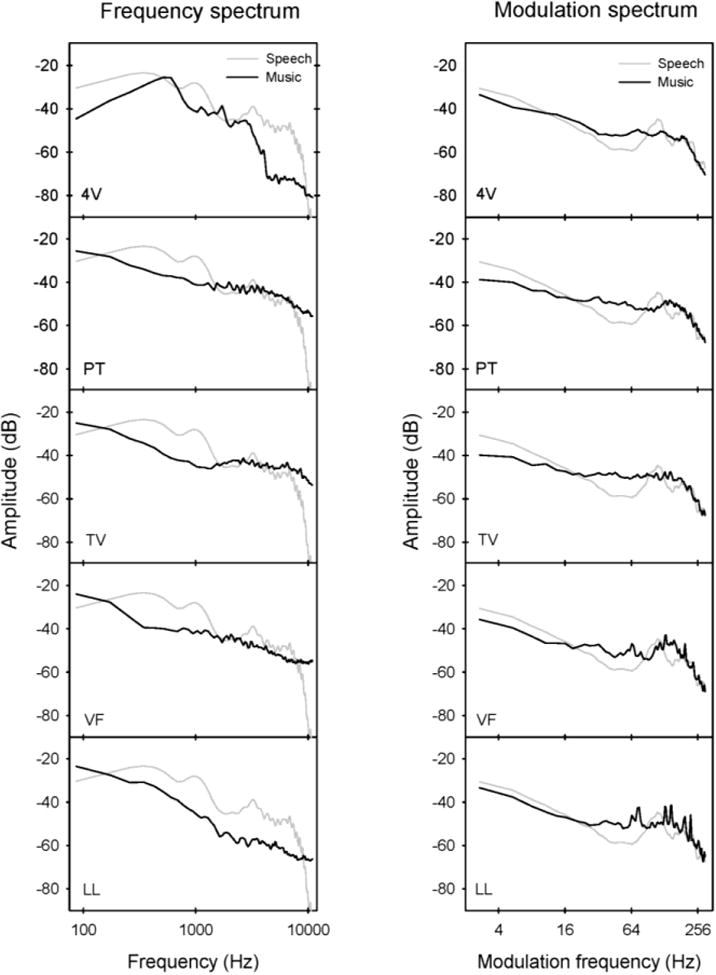
Left panels: Frequency spectrum of the original song maskers (black lines) and target speech (gray lines). Right panels: Modulation spectrum of the original song maskers (black lines) and target speech (gray lines).
Ten of the eleven CI patients used Cochlear Corp. devices (Freedom, Nucleus 24 or Nucleus 22) fit with the Advanced Combination Encoder (ACE; Vandali et al., 2000) or Spectral Peak (SPEAK; Skinner et al., 1994) speech processing strategies. In both strategies (assuming all electrodes are active), for each stimulation cycle, the input acoustic signal is analyzed by 22 (for ACE) or 20 (for SPEAK) filter bands, the envelope is extracted and used to modulate pulse trains delivered to the 8 (for ACE) or 6 (for SPEAK) electrodes with the most energy (according to the signal analysis). Figure 2 shows electrodograms for representative samples of the target speech and the MUS maskers. The electrodograms were generated using the default stimulation parameters for the Nucleus 24 and Freedom devices fit with the ACE strategy (used by 9 of the 11 CI subjects). The input frequency range was 188-7986 Hz, the frequency allocation was table 9, and the number of spectral maxima was 8. In Figure 2, as the electrode number reduces from 22 to 1, the place of stimulation shifts toward the base of the cochlea. For the HINT sentence, the stimulation pattern was distributed across the entire array, and shifted from the apical to the basal regions of the cochlea with changes in the acoustic frequency content. Similar to the frequency spectral envelopes shown in Figure 1, the stimulation patterns were most similar for Power Theme, TV Star Tonite, and Violin Fight, with greater stimulation for the basal than for the apical region of the cochlea. These maskers would be expected to produce greater masking for consonant than for vowel information. The stimulation patterns were somewhat similar for Four Voices and Lounge Lizard, with greater stimulation for the apical than for the basal region of the cochlea. These maskers would be expected to produce greater masking for vowel than for consonant information.
Figure 2.
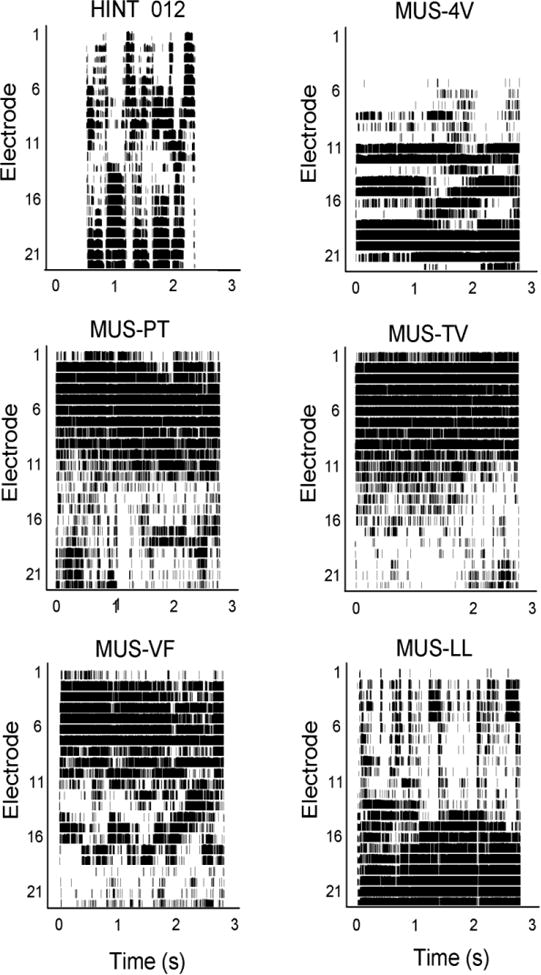
Electrodograms for a target speech sentence (HINT 012) and the original music maskers. Electrodograms were generated using default CI processor settings for the Nucleus Freedom device.
The two remaining masker conditions (MSN and MSMN) were created to better explore contributions of energetic and information masking. For the MSN masker, the spectral envelope of each music excerpt (shown in Figure 1) was used to filter white noise. For the MSMN, the temporal envelope extracted (half-wave rectification) from each music excerpt was used to modulate the corresponding MSN; the low-pass envelope filter cut-off frequency was 200 Hz and the filter slope was -24 dB/octave.
For “peak-picking” strategies such as ACE and SPEAK, the stimulation patterns might be quite different for speech mixed with the different maskers. Figure 3 illustrates differences in the stimulation patterns for speech mixed with music at 0 dB target-to-masker ratio (TMR). The top row shows the same target sentence (HINT 012) masked by the SSN masker. As expected, the SSN masker produced maximal energetic masking, as it is very difficult to observe the original sentence (shown in Figure 2) in the stimulation pattern. The second row shows speech mixed with MSN maskers (Power Theme on the left, Lounge Lizard on the right). As predicted by the stimulation patterns shown in Figure 2, MSN (Power Theme) largely masks the high-frequency speech information while MSN (Lounge Lizard) masks the low-frequency information. The third row shows speech mixed with the MSMN maskers. As expected, the stimulation patterns are quite similar to those with MSN, as the spectrum is identical for both masker types. The fourth row shows speech mixed with the MUS maskers; the excerpts are the same as with the MSMN maskers in row three. With the MUS (Power Theme) masker, the low-frequency speech information is more detailed than with the MSN (Power Theme) or MSMN (Power Theme) maskers. Similarly, with the MUS (Lounge Lizard) masker, the high-frequency speech information is more detailed than with the MSN (Lounge Lizard) or MSMN (Lounge Lizard) maskers.
Figure 3.
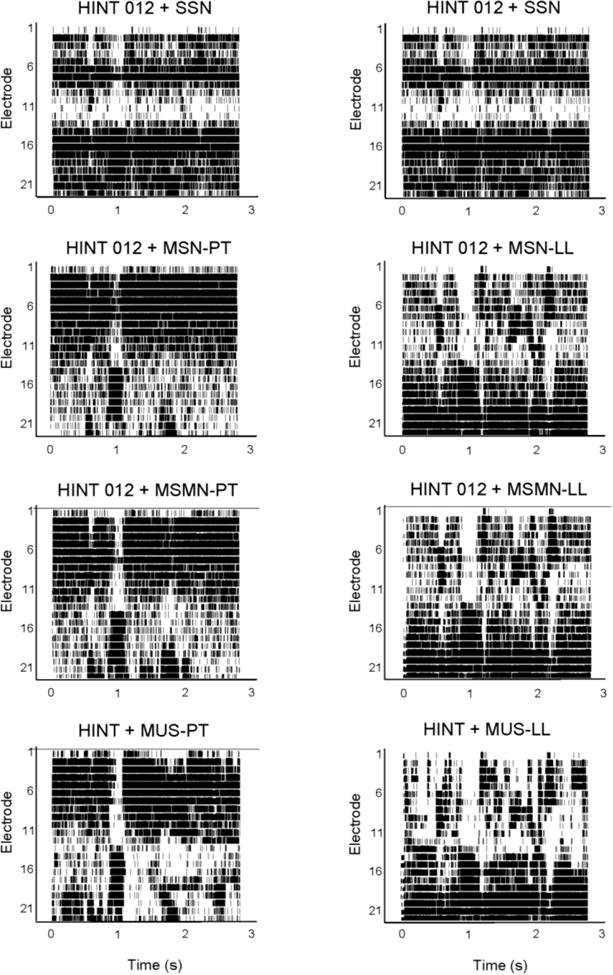
Electrodograms for target speech (HINT 012; top left panel) and mixed target speech and masker (0 dB TMR). The top right panel shows HINT 012 mixed with SSN. Second row: HINT 012 mixed with MSN (left – Power Theme; right – Lounge Lizard). Third row: HINT 012 mixed with MSMN (left – Power Theme; right – Lounge Lizard). Fourth row: HINT mixed with MUS (left – Power Theme; right – Lounge Lizard). Electrodograms were generated using default CI processor settings for the Nucleus Freedom device.
Procedure
Speech reception thresholds (SRTs) were measured using an open-set, adaptive (1-up/1-down) procedure (Van Tassell & Yanz, 1987), converging on the TMR that produced 50% correct word-in-sentence recognition. Because some CI listeners are unable to recognize 100% of words in HINT sentences correctly when no masker is present, an alternative adaptive rule (“Rule 3”) was used to adjust the TMR from trial-to-trial to track 50% correct word recognition (Chan et al., 2008). As all CI subjects were able to recognize more than 50% of words-in-sentences in quiet, Rule 3 allowed SRTs to be adaptively measured for all CI subjects.
All testing was conducted in sound field. Speech and noise were delivered via single loudspeaker (Tannoy Reveal). Subjects were tested in a sound-treated booth (IAC), seated 1 m from the speaker. During testing, the masker level was fixed at 65 dBA. Note that for the MSMN and MUS maskers, a short section (the duration of the target sentence + 1 second) was randomly selected from the entire masker wave file. The masker onset and offset was 500 ms before and after the target speech. The speech level was adjusted according to subject response. A sentence was randomly selected from among the 260 test sentences in the stimulus set. If the subject recognized 50% or more of the words in the sentence, the speech level was reduced by 2 dB. If the subject recognized less than 50% or the words in the sentence, the speech level was increased by 2 dB. Within each test run, the mean of the final eight (out of a total of ten) reversals in TMR was recorded as the SRT. Three runs were measured and averaged for each masker. The test order for the different maskers was randomized within and across subjects. All testing was conducted during a single session.
Results
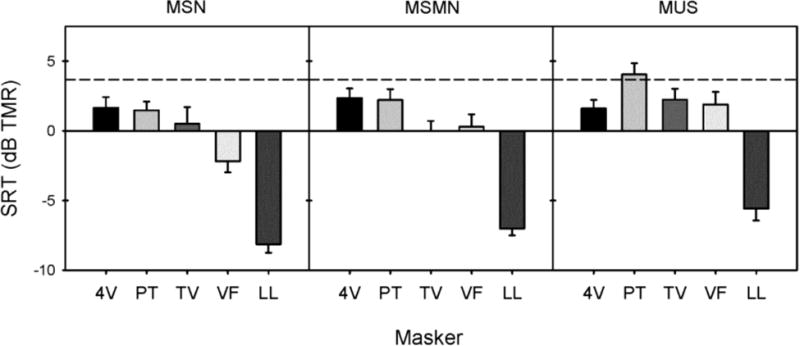
Figure 4 shows mean CI SRTs for each masker condition, as a function of masker song; the grey column shows the mean CI SRT with SSN. Across the three masker conditions, SRTs were generally lower with the music maskers than with SSN. Interestingly, as more spectro-temporal complexity was added in the music maskers (MSN to MSMN to MUS), mean CI performance worsened. A two-way repeated measures analysis of variance (RM ANOVA) was performed on the CI data shown in Figure 4, with masker condition (MSN, MSMN, MUS) and masker song (Four Voices, Power Theme, TV Star Tonite, Violin Fight, Lounge Lizard) as factors. Results showed main effects of masker condition [F(2, 20) = 23.2, p < .0001] and song [F(4, 40) = 148.4, p < .0001]; there was a significant interaction [F(8, 80) = 5.1, p < .001], most likely due to the different pattern of results across masker conditions for the TV Star Tonite, Violin Fight, and Four Voices songs. Post-hoc pairwise comparisons (with Rom's correction) indicated that SRTs were significantly poorer with the MUS maskers than with MSMN (adjusted p<0.001), and were significantly poorer with MSN than with MSMN (adjusted p<0.01). Pairwise comparisons also indicated that SRTs were significantly lower with Lounge Lizard than with the other songs (adjusted p < 0.05), and that SRTs were significantly higher with Power Theme than with all other songs except Four Voices (adjusted p < 0.05).
Figure 4.
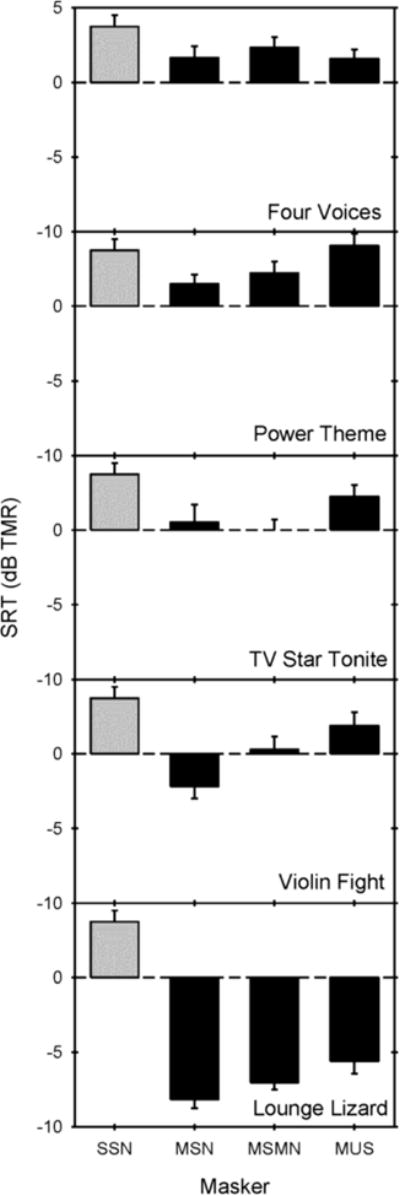
Mean CI performance as a function of the different speech (gray bars) and music maskers (black bars); the different panels show mean data for each masker song. The error bars show one standard error.
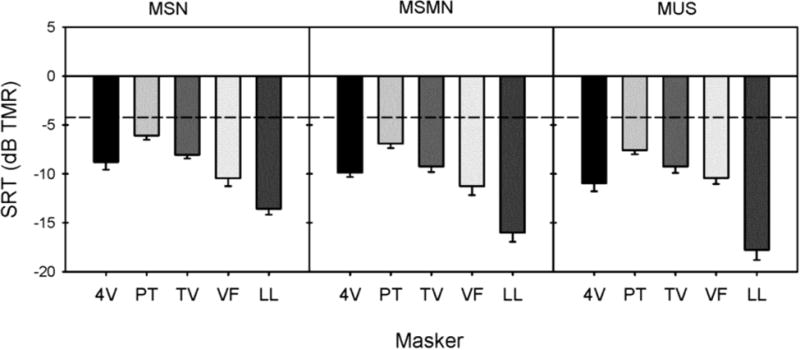
Figure 5 shows mean NH SRTs for each masker condition, as a function of masker song; the grey column shows the mean NH SRT with SSN. Similar to CI performance, mean NH SRTs were generally lower with the music maskers than with SSN. Different from CI performance, mean NH SRTs improved as the maskers increased in complexity. A two-way RM ANOVA was performed on the NH data shown in Figure 5, with masker condition and song as factors. Results showed main effects of masker condition [F(2, 16) = 14.2, p < 0.001] and song [F(4, 32) = 77.4, p < 0.0001]; there was a significant interaction [F(8, 64) = 3.3, p < 0.01]. Pairwise comparisons (with Rom's correction) indicated that SRTs with MSMN were significantly lower than those with MSN (adjusted p < 0.001), but were not significantly different from those with the MUS maskers (adjusted p = 0.10). Pairwise comparisons also showed that SRTs with Lounge Lizard were significantly lower than with the other songs (adjusted p < 0.05) and that SRTs with Power Theme were significantly higher than with the other songs (adjusted p < 0.05).
Figure 5.
Mean NH performance as a function the different speech (gray bars) and music maskers (black bars); the different panels show mean data for each masker song. The error bars show one standard error.
Figure 6 shows mean CI (black bars) and NH SRTs (gray bars) across masker conditions. Because the previous analyses showed significant differences in SRTs across songs, 20% “trimmed means” were used to minimize the likelihood that any individual song might dominate comparisons across groups and conditions (see the Appendix in Aronoff et al., 2011). For each subject and within each masker condition, 20% trimmed means were obtained by first ranking the SRTs and then calculating the arithmetic mean across the second-, third- and fourth-ranked SRTs. The across-subject means of these trimmed mean SRTs are shown in Figure 6. A two-way split-plot ANOVA was conducted on the data shown in Figure 6, with subject group (CI, NH) as the between-group variable and masker condition (SSN, MSN, MSMN, MUS) as the within-group variable. Results showed significant main effects for subject group [F(1,18) = 158.2, p < 0.0001] and masker condition [F(3,54) = 60.9, p < 0.0001]; there was also a significant interaction [F(3,54) = 13.1, p < 0.0001]. Pairwise comparisons (with Rom's correction) showed that SRTs were significantly higher with SSN than with MSN (adjusted p < 0.0001), but that there were no significant differences in SRTs between MSN and MSMN, or between MSMN and MUS. Pairwise comparisons also indicated that the change in SRTs between SSN and MSN did not differ significantly across subject group. However, the change in SRTs between MSN and MMSN did differ significantly across subject group (adjusted p < 0.001) as did the change in SRTs between MMSN and MUS (adjusted p < 0.05). To further investigate this interaction, pairwise comparisons between MSN and MMSN were analyzed separately for each group. For NH subjects, SRTs were significantly lower with MMSN than with MSN (adjusted p < 0.01), but there was no significant difference in SRTs between MMSN and MUS (adjusted p > 0.5). For CI subjects, SRTs were significantly higher with MMSN than with MSN (adjusted p < 0.02), and with MUS than with MMSN (adjusted p < 0.02).
Figure 6.
20% trimmed mean CI (black bars) and NH performance (gray bars) as a function of masker type. For the music masker conditions, performance was averaged across songs. The error bars show one standard error.
To further explore potential contributions of energetic masking on SRTs, the music maskers were analyzed in terms of the Speech Intelligibility Index (SII; ANSI S3.5-1997). One-third-octave band filters were used for the analyses, and the masker level was the same as for target speech (0 dB SNR). Figure 7 shows mean SRTs (across subjects) for the MSN (left panel), MMSN (center panel), and MUS (right panel) maskers as a function of SII. Least trimmed squares regressions were fit to the CI and NH data, thereby minimizing disproportionate contributions of individual songs to the fit (Rousseeuw, 1984). SRTs were strongly correlated to the masker SII for all music masker types for both CI and NH listeners (CI MSN: r2 = 0.99, adjusted p < 0.001; NH MSN: r2 = 0.86, adjusted p < 0.05; CI MMSN: r2 = 0.96, adjusted p < 0.01; NH MMSN: r2 = 0.86, adjusted p < 0.02; CI MUS: r2 = 0.81, adjusted p < 0.05; NH MUS: r2 = 0.76, adjusted p < 0.05).
Figure 7.
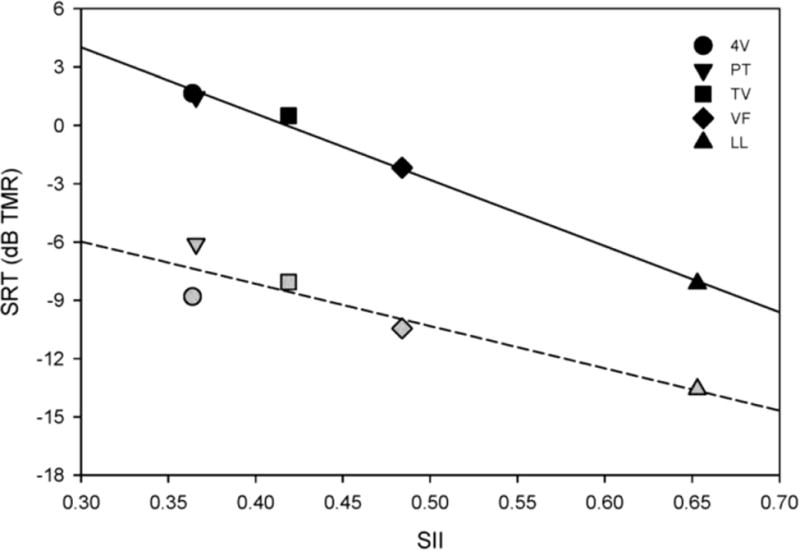
Mean SRTs as a function of SII, for the MSN (left panel), MSMN (middle panel) and MUS (right panel) maskers. The black symbols show CI data and the gray symbols show NH data; the symbol shapes show different songs. The solid lines show linear regressions for CI data and the dashed lines show linear regressions for NH data.
Discussion
The present results demonstrate that energetic masking largely limited speech understanding in music for both CI and NH listeners. For both subject groups, masked speech performance was well predicted by SII, even though the effect of increasing spectro-temporal complexity was different for CI and NH listeners. The strong predictive power of the SII for the MSN, MSMN and MUS maskers suggests that energetic masking may contribute most strongly to interference by music for both NH and CI listeners. CI performance worsened as envelope and fine structure were added to MSN, while NH subjects experienced release from masking with the addition of the envelope and fine structure cues. The results are discussed in greater detail below.
NH listeners experienced some release from masking when envelope cues (MSMN) were provided, or when spectro-temporal complexity and fine structure cues (MUS) were added to the MSN masker. CI listeners experienced no such release from masking. Indeed, SRTs worsened as the music maskers became more spectrally and temporally complex. CI users may have incorrectly segregated the target from the masker and therefore grouped speech and masker envelope information. Note that the input signal was always unprocessed, i.e., spectro-temporal fine structure information was preserved in the acoustic signal. It is possible that the fine structure cues caused the MUS masker and speech target to be more strongly grouped after CI signal processing. While the additional spectro-temporal information was detrimental to CI performance, the difference in performance between the MSN, MSMN, and MUS conditions suggests that envelope and fine timing cues can affect CI listeners' performance. Unfortunately, CI users seem to have used these cues to mistaken group music and speech. This may in part reflect the nature of “peak-picking” algorithms used by most of the present CI subjects. Figure 2 shows a target speech sentence (HINT 012) and a music masker (Power Theme). Figure 3 shows the same target (HINT 012) mixed with the MSN (Power Theme) and with the MUS (Power Theme) at a 0 dB TMR. With the MUS (Power Theme) masker, the electrodgram shows that the lower frequency music information is well represented, especially beyond 1.5 seconds. In contrast, the pattern is more diffuse for the MSN (Power Theme) masker. The ACE strategy picked the spectral peaks associated with the MUS masker because they had more low-frequency energy than did the speech target. While peak-picking strategies such as SPEAK and ACE may result in some distortion to the acoustic input, non-peak picking strategies (e.g., continuously interleaved sampling, or CIS) would most likely produce similar performance because the MUS maskers sometimes have greater low-frequency energy than do the target speech.
For these stimuli, it is difficult to distinguish conflicting envelope information vs. conflicting semantic information in the MUS and MSMN masker conditions. Either way, CI users seemed more susceptible to informational masking than were NH listeners, as evidenced by the increasingly poor performance as envelope and fine structure cues were added to the masker. CI users have difficulty properly segregating competing sound sources, presumably due to the poor spectral resolution, limited spectral pitch cues and broad current spread associated with the implant device. While NH listeners were able to obtain release from masking when envelope (MSMN) and fine structure cues (MUS) spectro-temporal cues were added to the masker (MSN), CI listeners did not. CI users' susceptibility to informational masking is perhaps best illustrated by performance with the Violin Fight and Lounge Lizard songs, which progressively worsened as information was added to the masker (Fig. 4). For Violin Fight, mean SRTs were -2.18 dB (MSN), 0.29 dB (MSMN) and 1.88 dB (MUS); for Lounge Lizard, mean SRTs were -8.14 dB (MSN), -7.01 dB (MSMN), and -5.59 dB (MUS). As shown in Figure 7, the SII values were much lower for Violin Fight and Lounge Lizard than for the other songs; as such, Violin Fight and Lounge Lizard produced less energetic masking than the other songs. The poorer performance in the MSMN and MUS conditions likely reflects CI users' inability to use spectral cues to correctly segregate target and masker temporal information, which leads to an incorrect grouping aspect of masker and target, resulting in a degraded target auditory stream. Improving CI users' spectral resolution would likely improve their SRTs by facilitating correct segregation of targets and maskers, particularly in cases of limited energetic masking.
It should be noted that it is impossible to disambiguate the effects of the added spectro-temporal complexity and the fine structure cues in the MUS masker conditions, or whether release from masking was due to dip-listening or semantic cues (i.e., different types of information). The MUS condition allowed for glimpsing in the spectral dips of the dynamic frequency content, as well as the temporal envelope dips. For NH listeners, performance was similar in the MSMN and MUS conditions, suggesting that temporal dip listening may have accounted for the release from masking. As noted above, CI performance worsened with increasing spectro-temporal complexity, though it is unclear why performance was worse with the MUS maskers than with the MSMN maskers. Note also that the CI subject group was much older than the NH group, which may have contributed to the poorer performance with the MSMN and MUS maskers. Schvartz et al. (2008) found poorer speech performance in older than in younger NH subjects when listening to spectrally degraded speech (as is experienced by CI users). Such poorer spectro-temporal processing by older listeners may have contributed to the present results.
The selection of music maskers was somewhat limited, as evidenced by the distribution of SII values in Figure 7, or the range of frequency and modulation spectra shown in Figure 1. Future studies may better control the spectral and temporal cues within the music masker (e.g., progressively filtering the frequency and/or modulation spectrum of the MSN, MSMN and MUS maskers). Nonetheless, the present data show the similar effects of energetic masking but different effects of informational masking on NH and CI listeners. While better stimulus control may refine these relationships, the basic patterns would be expected to persist, namely that:
Interference of background music on NH and CI NH listeners' speech understanding is largely driven by energetic masking.
SII largely predicts NH and CI performance with music maskers.
Unlike NH listeners, CI listeners are unable to listen in the dips of the modulated music-shaped noise or utilize the spectro-temporal fine structure cues available in music maskers.
Because of the poor spectral resolution that limits CI users' segregation and streaming, CI users are more susceptible to informational masking via competing envelope cues.
Acknowledgments
We are grateful to all research subjects for their considerable time spent with this experiment. We also thank Dr. Barbara Shinn-Cunningham for helpful comments on this study. The research was supported by NIDCD R01-DC004993.
Abbreviations
- HINT
Hearing in Noise Test
- CI
Cochlear implant
- NH
Normal hearing
- TMR
Target-to-masker Ratio
- SRT
Speech Reception Threshold
- Hz
Hertz
- dB
decibels
- SSN
Speech-shaped noise
- MSN
Music-shaped noise
- MSMN
Music-shaped and -modulated noise
- MUS
Music
- ANOVA
Analysis of variance
- RM
Repeated measures
References
- American National Standards Institute. American National Standard Methods for the Calculation of the Speech Intelligibility Index. New York, NY: ANSI; 1997. ANSI S3.5-1997. [Google Scholar]
- Aronoff JM, Freed DJ, Fisher LM, Pal I, Soli SD. The effect of different cochlear implant microphones on acoustic hearing individuals' binaural benefits for speech perception in noise. Ear and Hearing. 2011 doi: 10.1097/AUD.0b013e31820dd3f0. In press. [DOI] [PMC free article] [PubMed] [Google Scholar]
- Bregman AS. Auditory scene analysis: the perceptual organization of sound. Cambridge, MA: MIT Press; 1990. [Google Scholar]
- Campbell W, Heller J. Psychomusicology and psycholinguistics: parallel pathways or separate pathways. Psychomusicology. 1981;1(2):3–14. [Google Scholar]
- Carlyon RP, Cusack R, Foxton JM, Robertson IH. Effects of attention and unilateral neglect on auditory stream segregation. Journal of Experimental Psychology: Human Perception and Performance. 2001;127(1):115–127. doi: 10.1037//0096-1523.27.1.115. [DOI] [PubMed] [Google Scholar]
- Chan JCY, Freed D, Vermiglio AJ, S& oli SD. Evaluation of binaural functions in bilateral cochlear implant users. International Journal of Audiology. 2008;47(6):296–310. doi: 10.1080/14992020802075407. [DOI] [PubMed] [Google Scholar]
- Chatterjee M, Sarampalis A, Oba S. Auditory stream segregation with cochlear implants: a preliminary report. Hearing Research. 2006;222(1-2):100–107. doi: 10.1016/j.heares.2006.09.001. [DOI] [PMC free article] [PubMed] [Google Scholar]
- Drennan WR, Rubinstein JT. Music perception in cochlear implant users and its relationship with psychophysical capabilities. Journal of Rehabilitation Research and Development. 2008;45(5):779–789. doi: 10.1682/jrrd.2007.08.0118. [DOI] [PMC free article] [PubMed] [Google Scholar]
- Drullman R, Festen JM, Plomp R. Effect of temporal envelope smearing on speech reception. Journal of the Acoustical Society of America. 1994;95(2):1053–1064. doi: 10.1121/1.408467. [DOI] [PubMed] [Google Scholar]
- Durlach NI, Mason CR, Shinn-Cunningham BG, Arbogast TL, Colburn HS, Kidd G. Informational masking: Counteracting the effects of stimulus uncertainty by decreasing target-masker similarity. Journal of the Acoustical Society of America. 2003;114(1):368–379. doi: 10.1121/1.1577562. [DOI] [PubMed] [Google Scholar]
- Fu QJ, Shannon RV. Effects of noise and spectral resolution on vowel and consonant recognition: Acoustic and electric hearing. Acoustical Society of America. 1998;104(6):3586–3596. doi: 10.1121/1.423941. [DOI] [PubMed] [Google Scholar]
- Fu QJ, Nogaki G. Noise susceptibility of cochlear implant users: The role of spectral resolution and smearing. Journal of the Association for Research in Otolaryngology. 2005;6:19–27. doi: 10.1007/s10162-004-5024-3. [DOI] [PMC free article] [PubMed] [Google Scholar]
- Fu QJ, Galvin J, Wang X, Nogaki G. Moderate auditory training can improve speech performance of adult cochlear implant patients. Acoustics Research Letters Online. 2005;6(3):106–111. [Google Scholar]
- Friesen LM, Shannon RV, Baskent D, Wang XS. Speech recognition in noise as a function of the number of spectral channels: Comparison of acoustic hearing and cochlear implants. Journal of the Acoustical Society of America. 2001;110(2):1150–1163. doi: 10.1121/1.1381538. [DOI] [PubMed] [Google Scholar]
- Galvin JJ, Fu QJ, Oba SI. Effect of a competing instrument on melodic contour identification by cochlear implant users. Journal of the Acoustical Society of America. 2009;125(3):98–103. doi: 10.1121/1.3062148. [DOI] [PMC free article] [PubMed] [Google Scholar]
- Gfeller K, Woodworth G, Robin DA, Witt S, Knutson JF. Perception of rhythmic and sequential pitch patterns by normal hearing adults and adult cochlear implant users. Ear and Hearing. 1997;18(3):252–260. doi: 10.1097/00003446-199706000-00008. [DOI] [PubMed] [Google Scholar]
- Gfeller K, Olszewski C, Rychener M, Sena K, Knutson JF, Witt S, Macpherson B. Recognition of “real world” musical excerpts by cochlear implant recipients and normal-hearing adults. Ear and Hearing. 2005;26(3):237–250. doi: 10.1097/00003446-200506000-00001. [DOI] [PubMed] [Google Scholar]
- Gfeller K, Oleson J, Turner C, Driscoll V, Hong R, Gantz B. Accuracy of Cochlear Implant Recipients on Speech Reception in Background Music; Presented at the 10th International Conference on Cochlear Implants & Other Implantable Auditory Technologies; San Diego, California. 2008. Jun, [Google Scholar]
- Gfeller K, Buzzell A, Driscoll V, Kinnaird B, Oleson J. The Impact of Voice Range and Instrumental Background Accompaniment on Recognition of Song Lyrics. Proceedings of the 7th Asia Pacific Symposium on Cochlear Implants and Related Sciences 2009 Dec; [Google Scholar]
- Grimault N, Micheyl C, Carlyon RP, Arthaud P, Collet L. Perceptual auditory stream segregation of sequences of complex sounds in subjects with normal and impaired hearing. British Journal of Audiology. 2001;35:173–182. doi: 10.1080/00305364.2001.11745235. [DOI] [PubMed] [Google Scholar]
- Hong RS, Turner CW. Pure-tone auditory stream segregation and speech perception in noise in cochlear implant recipients. Journal of the Acoustical Society of America. 2006;120(1):360–374. doi: 10.1121/1.2204450. [DOI] [PubMed] [Google Scholar]
- Koelsch S, Kasper E, Sammler D, Schulze K, Gunter T, Friederici AD. Music, language and meaning: brain signatures of semantic processing. Nature Neuroscience. 2004;7(3):302–307. doi: 10.1038/nn1197. [DOI] [PubMed] [Google Scholar]
- Leek M, Brown ME, Dorman MF. Informational masking and auditory attention. Perception and Psychophysics. 1991;50:205–214. doi: 10.3758/bf03206743. [DOI] [PubMed] [Google Scholar]
- Kong YY, Cruz R, Jones AJ, Zeng FG. Music Perception and Temporal Cues in Acoustic and Electric Hearing. Ear and Hearing. 2004;25(2):173–185. doi: 10.1097/01.aud.0000120365.97792.2f. [DOI] [PubMed] [Google Scholar]
- McDermott H. Music perception with cochlear implants: A review. Trends in Amplification. 2004;8(2):49–82. doi: 10.1177/108471380400800203. [DOI] [PMC free article] [PubMed] [Google Scholar]
- Nelson P, Jin SH, Carney AE, Nelson DA. Understanding speech in modulated interference: Cochlear implant users and normal-hearing listeners. Journal of the Acoustic Society of America. 2003;113(2):961–968. doi: 10.1121/1.1531983. [DOI] [PubMed] [Google Scholar]
- Oxenham AJ, Fligor BJ, Mason CR, Kidd G. Informational masking and musical training. Journal of the Acoustical Society of America. 2003;114(3):1543–1549. doi: 10.1121/1.1598197. [DOI] [PubMed] [Google Scholar]
- Oxenaham AJ. Pitch perception and auditory stream segregation: implications for hearing loss and cochlear implants. Trends in Amplification. 2008;12(4):316–331. doi: 10.1177/1084713808325881. [DOI] [PMC free article] [PubMed] [Google Scholar]
- Qin MK, Oxenham AJ. Effects of simulated cochlear-implant processing on speech reception in fluctuating maskers. Journal of the Acoustical Society of America. 2003;114(1):446–454. doi: 10.1121/1.1579009. [DOI] [PubMed] [Google Scholar]
- Rousseeuw PJ, Leroy MA. Robust regression and outlier detection. Chichester, England: John Wiley and Sons, Inc; 1987. [Google Scholar]
- Schvartz KC, Chatterjee M, Gordon-Salant S. Recognition of spectrally degraded phonemes by younger, middle-aged, and older normal-hearing listeners. Journal of the Acoustical Society of America. 2008;124(6):3972–3988. doi: 10.1121/1.2997434. [DOI] [PMC free article] [PubMed] [Google Scholar]
- Scott SK, Rosen S, Wickham L, Wise RJ. A positron emission tompgraphy study of the neural basis of informational and energetic masking effects in speech perception. Acoustical Society of America. 2004;115(2):813–821. doi: 10.1121/1.1639336. [DOI] [PubMed] [Google Scholar]
- Shannon RV, Fu QJ, Galvin JJ., 3rd The number of spectral channels required for speech recognition depends on the difficulty of the listening situation. Acta Otolaryngology Supplementum. 2004;552:50–54. doi: 10.1080/03655230410017562. [DOI] [PubMed] [Google Scholar]
- Skinner MW, Clark GM, Whitford LA, et al. Evaluation of a new spectral peak coding strategy for the Nucleus-22 channel cochlear implant system. American Journal of Otolaryngology. 1994;15(2):15–27. [PubMed] [Google Scholar]
- Stickney G, Zeng FG, Litovsky R, Assman P. Cochlear implant speech recognition with speech maskers. Journal of the Acoustical Society of America. 2004;116(2):1081–1091. doi: 10.1121/1.1772399. [DOI] [PubMed] [Google Scholar]
- Van Tassell D, Yanz J. Speech recognition threshold in noise: Effects of hearing loss, frequency, response, and speech materials. Journal of Speech and Hearing Research. 1987;30(3):377–386. [PubMed] [Google Scholar]
- Vandali AE, Whitford LA, Plant KL, Clark GM. Speech perception as a function of electrical stimulation rate: using the Nucleus 24 cochlear implant system. Ear and Hearing. 2000;21(6):608–624. doi: 10.1097/00003446-200012000-00008. [DOI] [PubMed] [Google Scholar]
- Xu L, Pfingst BE. Spectral and temporal cues for speech recognition: Implications for auditory prostheses. Hearing Research. 2008;242(1-2):132–140. doi: 10.1016/j.heares.2007.12.010. [DOI] [PMC free article] [PubMed] [Google Scholar]
- Zhu M, Chen B, Galvin JJ, Fu QJ. Acoustical Society of America. 2011. Influence of pitch, timbre and timing cues on melodic contour identification with a competing masker. Revision submitted Sept., 2011. [DOI] [PMC free article] [PubMed] [Google Scholar]


