Abstract
Objective
To evaluate the accuracy of single-source dual-energy CT (ssDECT) in iodine quantification using various segmentation methods in an ex-vivo model.
Methods
Ten sausages, injected with variable quantities of iodinated contrast, were inserted into two livers and scanned with ssDECT. Material density iodine (MDI) images were reconstructed. Three radiologists segmented each sausage. Iodine concentration, volume and absolute quantity were measured. Agreement between the measured and injected iodine was assessed with the concordance correlation coefficient (CCC). Intra-reader agreement was assessed using the intraclass correlation coefficient (ICC).
Results
Air bubbles were observed in sausage (IX). Sausage (X) was within the same view as hyper-attenuating markers used for localization. With IX and X excluded, CCC and ICC were > 0.98 and > 0.88. When included, CCC and ICC were > 0.94 and > 0.79.
Conclusions
Iodine quantification was reproducible and precise. However, accuracy reduced in sausages consisting of air filled cavities and within the same view as hyper-attenuating markers.
Keywords: DECT, rapid switching, iodine quantification
Introduction
The feasibility of material characterization from dual energy computed tomography (DECT) datasets was first made available commercially with a dual-source dual energy CT (dsDECT) scanner (SOMATOM Definition, Siemens Medical Solutions, Forcheim, Germany) (1). The dsDECT system is equipped with two X-ray tubes that are oriented at an angular displacement of approximately 90°. Each tube operates at a low and high tube voltage (80/100 kVp and 140 kVp) (1, 2). Current dsDECT systems use a three-material decomposition algorithm to generate material density images, from which one may obtain mass density, effective atomic number, or concentration of specific materials (2, 3). This additional information provides for a mechanism to further characterize abnormalities and in the case of oncologic imaging, a means to evaluate treatment response by measuring changes of iodinated contrast uptake within tumors (4–9). However, any value and practicality of derived objective metrics from DECT scans is largely dependent on the accuracy with which these metrics can be extracted (10). As such, DECT derived measures must be found to be precise under conditions that might be expected during clinical practice (11).
Due to its prevalent use in medical imaging, the quantification of the absolute or relative concentration of iodinated contrast within malignant lesions may offer an objective means to characterize disease response to treatments. Recent investigations with dsDECT systems have found errors on the order of ± 13.5% between the measured and actual iodine concentration in the phantom inserts (5, 12–16). Although experiments continue to demonstrate iodine quantification accuracy with dsDECT systems, there is a need for experimental data to quantify the accuracy of the single-source dual energy CT (ssDECT) (17).
The ssDECT uses a rapid kVp switching method with specialized detectors that have the capability of registering both the low- and high-energy polychromatic X-ray spectra simultaneously (GemStone Detector, Discovery CT750HD, GE Healthcare, Milwaukee, WI, U.S.) (18). Using a two basis material decomposition algorithm, material density images, which display concentration of the material being displayed, and synthesized monochromatic images, ranging in energy from 40 to 140 keV, can be generated (19, 20).
Several investigations have reported on the accuracy of concentrations measured from material density images and HU values measured on monochromatic images (5, 12–17). While these experiments demonstrate concordance between measurements and the ground truth, they represent idealized scenarios not encountered in clinical imaging. The importance of characterizing DECT with tissue-like properties was demonstrated by Goodsitt et al., who showed that HU values measured on monochromatic images are inaccurate when measured in phantoms of varying sizes and tissue compositions (21). Furthermore, investigators have primarily focused on the accuracy of equipment hardware or software. In clinical practice, neoplastic lesions have irregular shapes and inhomogeneous iodine distributions, which require identification and contouring by experienced, expert radiologists. Hence, any reports characterizing the robustness of DECT systems may be limited by not assessing inter-user variations when segmenting lesions (6, 8, 9). Therefore, the use of realistic phantoms, either anthropomorphic, or phantoms derived from animal-based models, may provide the most relevant information about procedural, quantitative, and system accuracy found in clinical settings.
The purpose of this investigation was to use an ex vivo calf liver, with iodine filled lesions inserted, to determine the accuracy of iodine quantification with a ssDECT platform. We also sought to determine the intra-reader agreement when trying to quantify the amount of iodine while using three different vendor provided volumetric segmentation methods: manual segmentation, fixed threshold, and semi-automatic segmentation.
Materials and Methods
Experimental Model
Two calf livers weighting approximately 6.5 kg each, and ten chicken sausages, 3.1 ± 0.5 cm in diameter, were used in this study (Figure 1). Varying amounts of iodinated contrast material (Iohexol 300 mg[I]/mL, Omnipaque 300, GE Healthcare, Cork, Ireland) were injected into each sausage by a radiologist who used a graduated syringe, with a scale sensitivity of 0.1 mL (Table 1). The actual volume of contrast material injected (mL) in each sausage was recorded. Using a surgical scalpel, five incisions were made in each liver. The sausages were placed into each incision and then the calf livers were stored in polybutylene succinate (PBS) plastic containers. The livers were refrigerated with ice bars. The two containers were labelled with hyper-attenuating markers (two U.S. cents: 97.5% zinc and 2.5% copper) to allow for spatial orientation and lesion identification on CT images (Figure 3). Other than the radiologist injecting the iodine, three other radiologists involved in this experiment were blinded to the sausage positions and amount of injected iodine. Only the radiologists blinded to the study performed segmentations and quantitative measurements.
Fig. 1. Animal model.
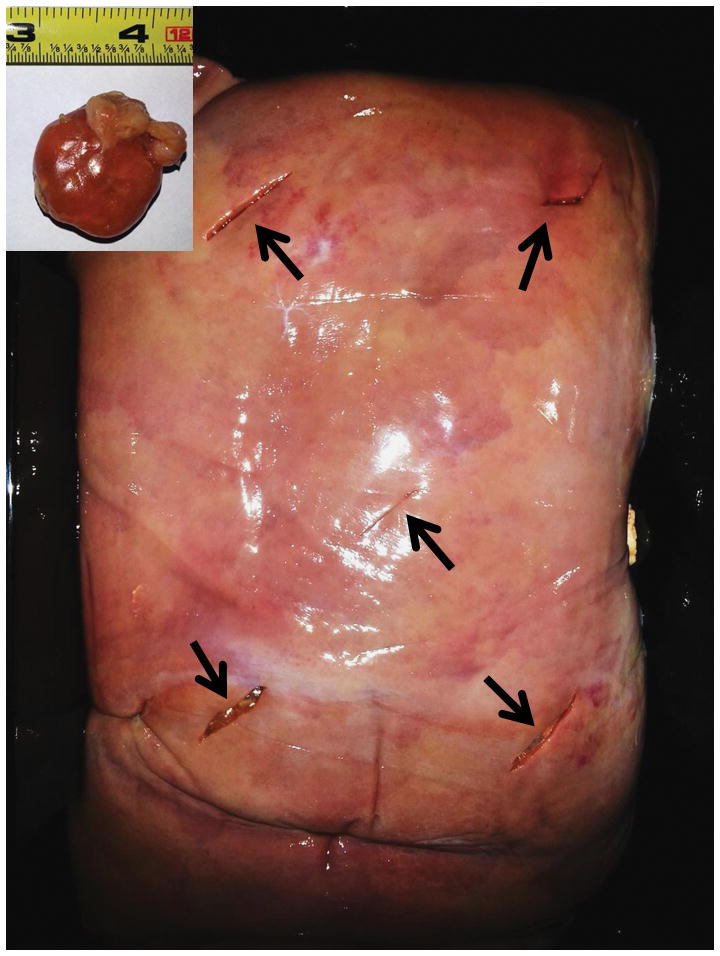
Ten chicken sausages (upper left corner) were manually injected with variable quantities of Iohexol 300 mg[I]/mL and inserted in two calf livers, five sausage in each calf liver (black arrows).
Table 1. Injected and estimated iodine quantities. Average of three measurements on DECT images.
Injected and estimated iodine quantities. The leftward part of the table reports injected volumes of 300 mg [I]/ml contrast material together with the equivalent quantity of iodine. The estimated sausage volumes, iodine concentration, and iodine quantity are reported for each segmentation method and are expressed as mean and standard deviation (SD) on three measurements. Processing times were recorded for the processing of all the ten sausages and are expressed as mean and SD on three sessions for each segmentation method. ID: Identification Roman numeral assigned to each sausage; Thr.: Threshold; HU: Hounsfield Units; mm:ss: minutes: seconds.
| ID | Injected | Manual Segmentation Mean (SD) |
Fixed threshold Mean (SD) |
Semi-automatic Segmentation Mean (SD) |
|||||||||
|---|---|---|---|---|---|---|---|---|---|---|---|---|---|
| Contrast Material (ml) |
Iodine Quantity (mg) |
Volume (ml) |
Iodine Concentration (mg/ml) |
Iodine Quantity (mg) |
Thr. (HU) |
Volume (ml) |
Iodine Concentration (mg/ml) |
Iodine Quantity (mg) |
Volume (ml) |
Iodine Concentration (mg/ml) |
Iodine Quantity (mg) |
||
| Liver No.1 | I | 0.80 | 240.00 | 19.58 (0.49) | 11.46 (0.17) | 224.27 (2.33) | 172 (3.06) | 19.68 (0.27) | 11.47 (0.11) | 225.64 (1.04) | 20.45 (1.07) | 11.18 (0.40) | 228.38 (4.04) |
| II | 0.40 | 120.00 | 13.81 (0.26) | 9.26 (0.10) | 127.88 (1.09) | 13.95 (0.24) | 9.27 (0.09) | 129.26 (0.97) | 13.38 (0.00) | 9.46 (0.05) | 126.57 (0.70) | ||
| III | 0.50 | 150.00 | 12.64 (0.23) | 11.00 (0.14) | 139.02 (0.73) | 11.78 (0.16) | 11.61 (0.10) | 136.76 (0.63) | 12.46 (0.68) | 11.19 (0.42) | 139.28 (2.28) | ||
| IV | 1.20 | Leakage | |||||||||||
| V | 1.00 | 300.00 | 22.79 (0.10) | 12.59 (0.03) | 286.88 (0.64) | 21.86 (0.23) | 12.99 (0.09) | 283.95 (0.98) | 22.10 (1.74) | 12.91 (0.70) | 284.38 (7.57) | ||
| Liver No.2 | VI | 0.40 | Leakage | 161 (10.58) | |||||||||
| VII | 0.90 | 270.00 | 23.42 (0.15) | 12.27 (0.06) | 287.32 (0.52) | 23.94 (1.06) | 12.15 (0.38) | 290.48 (3.68) | 22.77 (2.22) | 12.58 (0.84) | 285.24 (9.99) | ||
| VIII | 0.80 | 240.00 | 21.17 (0.10) | 12.01 (0.05) | 254.22 (0.26) | 20.77 (0.91) | 12.24 (0.37) | 254.04 (3.22) | 19.93 (2.43) | 12.62 (1.04) | 249.82 (9.94) | ||
| IX | 0.50 | 150.00 | 18.55 (0.21) | 9.52 (0.06) | 176.64 (0.98) | 18.53 (0.84) | 9.64 (0.32) | 178.44 (2.93) | 18.63 (1.44) | 9.55 (0.46) | 177.44 (5.06) | ||
| X | 0.40 | 120.00 | 8.90 (0.84) | 8.08 (0.50) | 71.66 (2.52) | 8.23 (0.85) | 8.60 (0.50) | 70.44 (2.95) | 7.82 (0.00) | 8.83 (0.00) | 69.07 (0.00) | ||
| Processing time (mm:ss) | 56:55 (06:07) | 12:58 (1:42) | 22:51 (1:37) | ||||||||||
Fig. 3. Scanned livers.
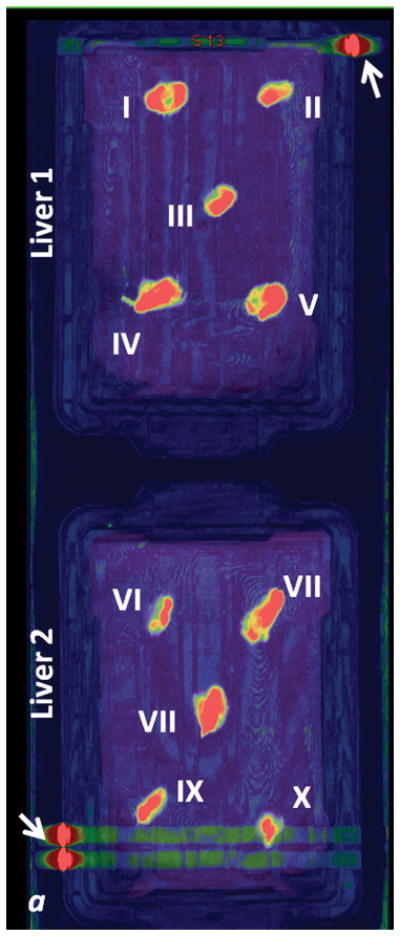
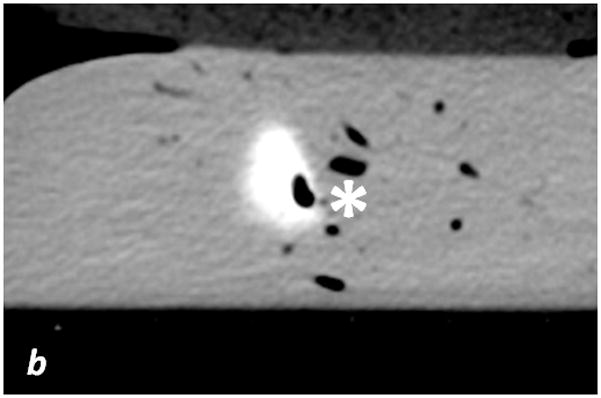
a: fused iodine (-water) map on coronal monochromatic 70 keV image, maximum intensity projection. b: axial monochromatic 70 keV image. In a, sausages have been identified with Roman numerals on the two livers (see Tables 1 and 2). Arrows: metallic labels (cents) applied on the plastic boxes to maintain spatial orientation. Streak artifact is visible on the acquisition plane of sausage X, and close to sausage IX, on liver 2. In b, sausage IX has macroscopic air bubbles inside (*).
Image Acquisition
Both livers were scanned with the same ssDECT scanner (Discovery CT750 HD, GE Healthcare, Milwaukee, WI, U.S.). The scans were acquired in the rapid 80 to 140 kVp switching mode by using the gemstone spectral imaging protocol (GSI) preset 9. A large body scan field of view, 40 mm beam collimation, 0.7 s rotation time, and 0.984:1 helical pitch, and tube current of 260 mA was used.
Image Post-processing
All image data was processed on an Advantage Workstation Volume Share 5 (GE Healthcare, Milwaukee, WI, U.S.). Material density iodine (iodine (-water) ) and virtual monochromatic images (VMI) at 70 keV were generated using a two basis material decomposition model (couple materials: iodine and water) (19). The VM 70 keV axial images were used to segment sausages. Segmentation was performed using three different methods: manual contouring, fixed threshold, and semi-automatic segmentation.
The iodine (-water) images were used to measure the volume (cm3) and the iodine concentration (x102μg/cm3) for each segmented sausage. With the manual segmentation method (Figure 2a and 2b), the boundaries of the sausages were manually outlined by each radiologist on each slice of the VMIs. Contours were converted into 3D ROIs with the vendor provided software. The 3D ROIs were then propagated onto the material density (MD) Iodine images, which allowed for concentration measurements to be completed.
Fig. 2. Segmentation methods.
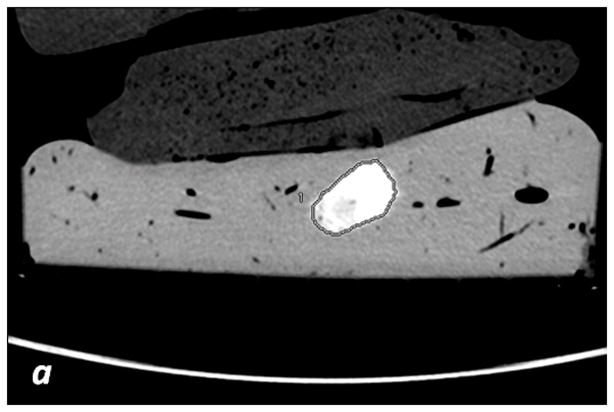
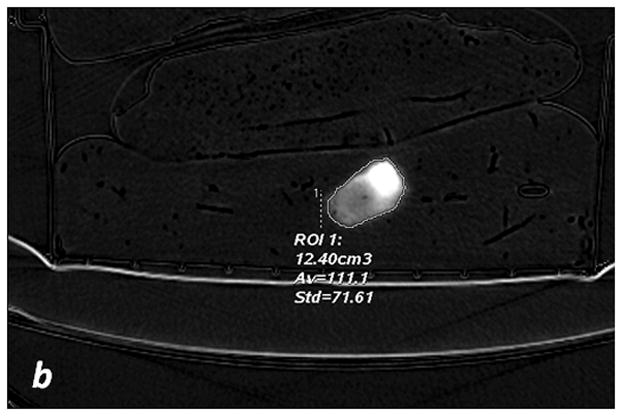
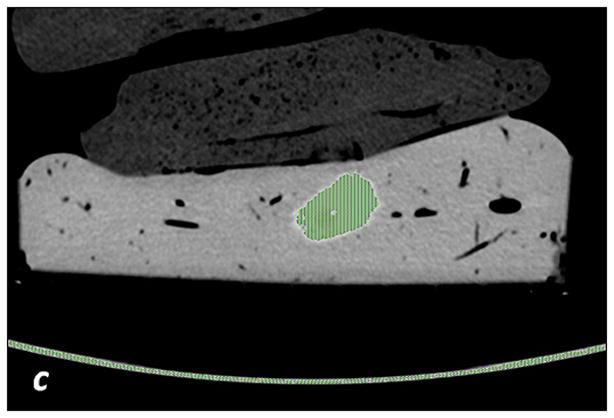
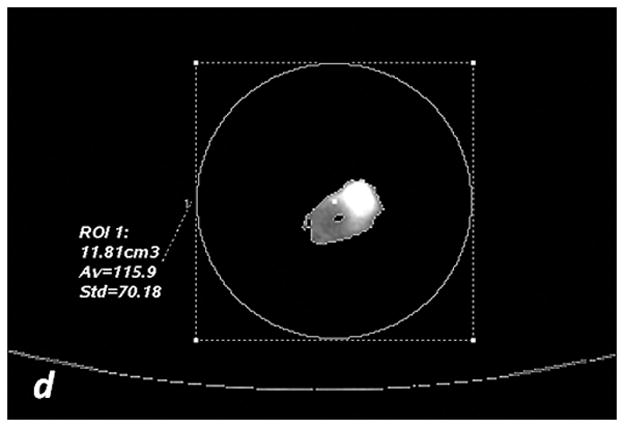
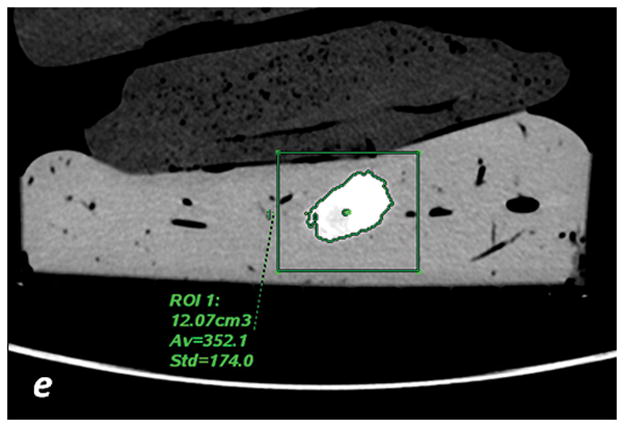
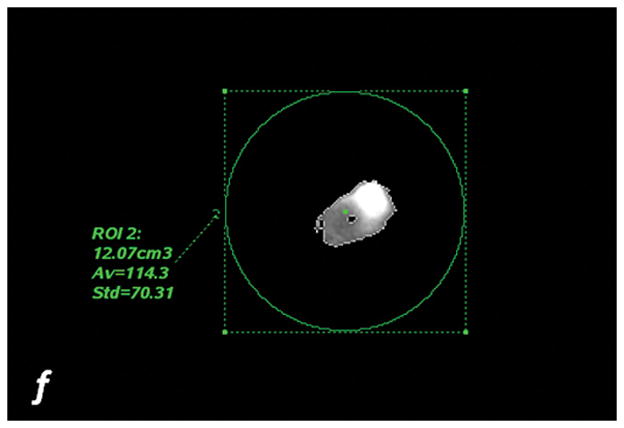
a, c, e: axial monochromatic 70 keV images. b, d, f: axial iodine (-water) images. a, b: manual segmentation. In a, sausage boundaries are manually outlined on each monochromatic axial slice to obtain a 3D ROI of the sausage. The ROI is propagated on iodine (-water) images, and the software calculated the sausage volume (b, in cm3) and iodine concentration (b: Av, 102 μg/cm3). c, d: fixed threshold. Each radiologist fitted the green mask (c) to all sausages of the scanned liver by adjusting the minimum attenuation value (fixed threshold for each liver, in HU). The software extracts the voxels with HU values between the thresholds; sausage volume (d, in cm3) and iodine concentration (d: Av, 102μg/cm3) are calculated with a spherical 3D ROI (d). e, f: semi-automatic segmentation. In e, after placing a seeding point within the sausage, a parallelepiped ROI includes the spatial region of the sausage whereas an irregular 3D ROI is grown along the sausage boundaries. Each radiologist visually corrected the boundaries of the inner ROI by scrolling a control bar. The sausage volume is extracted on the monochromatic images and on iodine (-water) images. After placing a spherical ROI, the software calculated sausage volume (e, in cm3) and iodine concentration (f: Av, 102μg/cm3).
The fixed threshold method extracts those voxels with HU values between a predefined maximum and minimum HU (see Figure 2c, d). The method overlays a colored mask onto the VMI. This color mask corresponds to HU values found between the pre-defined max and min. Each radiologist subjectively determined the threshold HU values using the color mask. Within each liver, a single threshold was sufficient in capturing the boundaries of all sausages (Table 1). The mask was then propagated to the MD iodine image, where the sausages were extracted. Sausage volume (cm3) and iodine concentrations (x102μg/cm3) were measured by positioning a spherical 3D ROI over each segmented sausage (Figure 2c and 2d).
The semi-automatic segmentation method uses an algorithm that grows a 3D ROI starting from a seeding point (Figure 2e and 2f). The seeding point was identified by each radiologist for each sausage.
Measurements comparison and statistical analysis
To better characterize variability, the segmentation was repeated three times by each radiologist. In addition, each repeat was conducted in a separate session, which was held within a week of the previous session. The amount of time taken for each segmentation and session was recorded from initiating the study to closing the study. Iodine quantity (mg) for each sausage was estimated by taking the product of the measured volume (cm3, average of three measurements) and iodine concentration (mg/ml, average of three measurements).
The Lilliefors normality test was used to test for normality. For non-normal distributions, non-parametric tests were used. Absolute and percentage errors for estimations of iodine quantities were calculated as estimated – injected values and as 100x (estimated – injected)/injected values. All results were averaged across the three separate sessions. Percentage errors were rendered with Bland-Altman statistics, where the injected iodine quantity was considered as the reference standard (22).
The agreement of iodine quantification with ssDECT was determined with a linear regression model and with the concordance correlation coefficient (CCC), classifying the strength of agreement as almost perfect (CCC > 0.99), substantial (0.95 < CCC < 0.99), moderate (0.90 < CCC < 0.95), and poor (CCC < 0.90). Intra-reader agreement for the three segmentation methods was tested with intra class correlation coefficient (ICC) considering the average of three measurements for each segmentation method. Statistical analysis was performed with SPSS v22 (IBM, Armonk, N Y, U.S.), and p values < 0.05 were considered significant.
Results
Contrast material leakage was noted for two sausages while preparing the liver model (sausages IV and VI): these were excluded from further assessment. While processing and segmenting images, it was found that sausage X was in the same view as the hyper-attenuating markers positioned on the box (Figure 3a). Additionally, sausage IX had macroscopic air bubbles within it (Figure 3a, b). To better understand the impact of clinically relevant artifacts on quantitative measures in a controlled phantom study, these sausages were included in this study.
Table 1 shows the estimated volume, iodine concentration, and iodine quantity for each sausage and segmentation method. The ssDECT estimates of sausage volume, iodine concentration, and calculated iodine quantity are shown as mean and standard deviation for three measurements. For the fixed threshold method, the threshold applied had a mean HU of 172 ± 3.06 HU for the first liver and 162 ± 10.58 HU for the second (Table 1). The mean processing time needed to complete segmentations for the manual method was 57:00 ± 1:40 min, 13:00 ± 1:30 min for the fixed threshold method, and 23:00 ± 1:10 min for semi-automatic segmentation.
Table 2 reports the absolute and relative percentage errors between the measured/calculated and injected iodine quantity, and Figure 4 shows the Bland-Altman analysis for each method. For the manual segmentation method, the average percent error was −2.73% (95% CI, −17.3% to +11.8%), for the fixed threshold method, the average percent error was −2.67% (95% CI, −17.8% to +12.5%), and for the semi-automatic method, the average percent error was −3.27% (95% CI, −18.2% to 11.7%), see Figure 4. The calculated iodine quantity was overestimated in sausage IX and was underestimated in sausage X for each method, see Table 2. Excluding sausages IX and X from the error analysis, the manual segmentation method showed a mean error of −0.07 mg (+0.11%; 95% CI: −7.08% to +7.30%), fixed threshold method showed a mean error of 0.02 mg (+0.17%; 95% CI: −7.87% to +8.21%), and semi-automatic segmentation showed a mean error of −1.06 mg (−0.33%; 95% CI: −6.62% to +5.96%).
Table 2. Comparison of Injected iodine quantity and Estimated Iodine quantity on iodine (-water) images. Average of three measurements.
Comparison of Injected iodine quantity and Estimated Iodine quantity on iodine (-water) images. Table shows absolute and percentage errors between the iodine amounts estimated on iodine maps and injected values. Absolute and percentage errors are calculated by taking the average of three estimates. All percentage errors with the three segmentation methods were less than than 10%, with the exception of sausage IX, which was overestimated by more than 17% with the three methods, and sausage X, which was underestimated by more than 40% with the three segmentation methods. I: Iodine; % error: percentage error.
| ID | Injected I (mg) | Manual Segmentation | Fixed threshold | Semi-automatic Segmentation | |||||||
|---|---|---|---|---|---|---|---|---|---|---|---|
|
| |||||||||||
| I Quantity (mg) | Absolute Error (mg) | % Error | I Quantity (mg) | Absolute Error (mg) | % Error | I Quantity (mg) | Absolute Error (mg) | % Error | |||
|
|
|||||||||||
| Liver No.1 | I | 240.00 | 224.27 | −15.74 | −6.56 | 225.64 | −14.36 | −5.98 | 228.38 | −11.62 | −4.84 |
|
| |||||||||||
| II | 120.00 | 127.88 | 7.88 | 6.57 | 129.26 | 9.26 | 7.71 | 126.57 | 6.57 | 5.48 | |
|
| |||||||||||
| III | 150.00 | 139.02 | −10.98 | −7.32 | 136.76 | −13.24 | −8.83 | 139.28 | −10.72 | −7.15 | |
|
| |||||||||||
| IV | Leakage | ||||||||||
|
| |||||||||||
| V | 300.00 | 286.88 | −13.12 | −4.37 | 283.95 | −16.05 | −5.35 | 284.38 | −15.62 | −5.21 | |
|
| |||||||||||
| Liver No.2 | VI | Leakage | |||||||||
|
| |||||||||||
| VII | 270.00 | 287.32 | 17.32 | 6.41 | 290.48 | 20.48 | 7.59 | 285.24 | 15.24 | 5.64 | |
|
| |||||||||||
| VIII | 240.00 | 254.22 | 14.22 | 5.92 | 254.04 | 14.04 | 5.85 | 249.82 | 9.82 | 4.09 | |
|
| |||||||||||
| IX | 150.00 | 176.64 | 26.64 | 17.76 | 178.44 | 28.44 | 18.96 | 177.44 | 27.44 | 18.29 | |
|
| |||||||||||
| X | 120.00 | 71.66 | −48.34 | −40.28 | 70.44 | −49.56 | −41.30 | 69.07 | −50.93 | −42.44 | |
|
|
|||||||||||
| Average | −2.76 | −2.73 | −2.62 | −2.67 | −3.73 | −3.27 | |||||
Fig 4. Bland-Altman plots for percentage errors of estimated iodine quantities toward injected iodine.
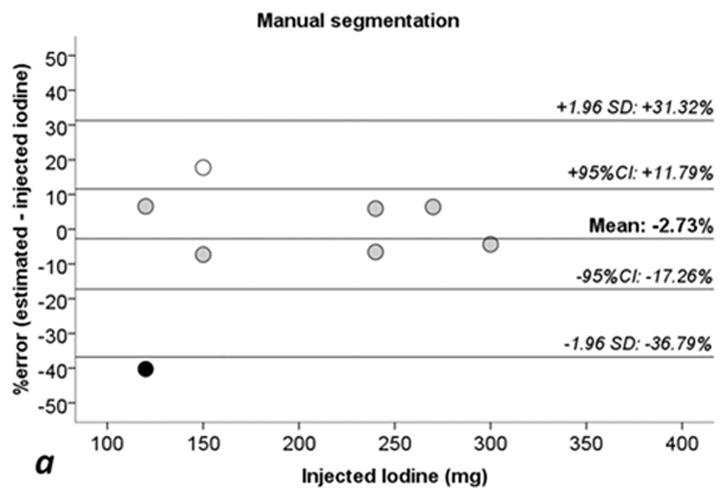
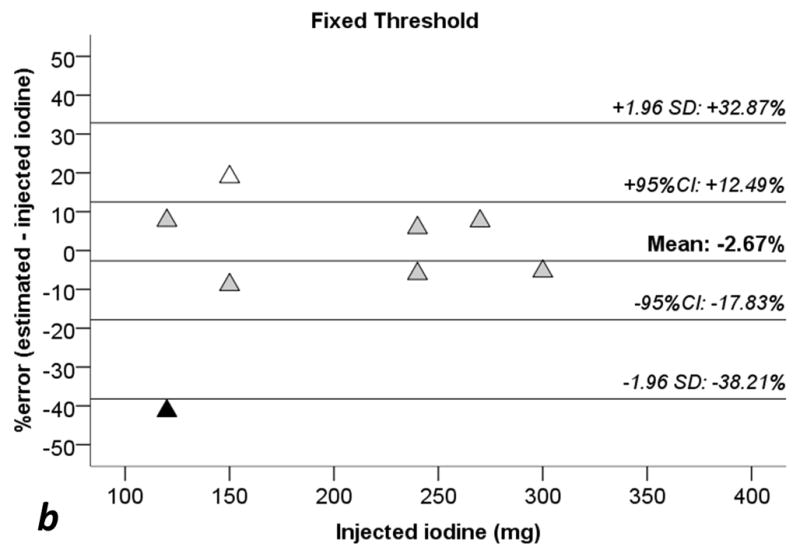
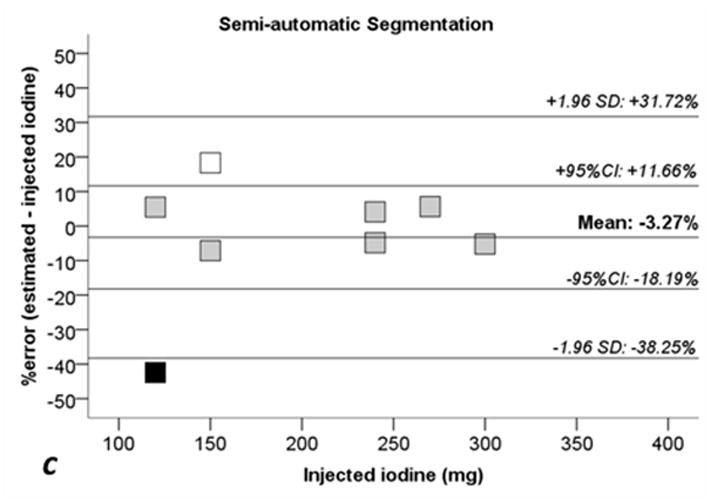
a: manual segmentation (circles). b: fixed threshold (triangles). c: semi-automatic segmentation (squares). 1.96 SD: lines showing ± 1.96 standard deviations (SD) from the average error. 95% CI: 95% confidence interval of the mean error. White dots: Sausage IX. Black dots: sausage X. Sausages IX and X with estimate errors higher than +17% and −40%, see also Tables 1 and 2.
Figure 5 shows linear regressions analysis comparing the injected iodine quantity to the calculated amount with ssDECT. For the manual segmentation method, the correlation coefficient (R2) was 0.911 (p < 0.001), 0.902 (p < 0.001) for fixed threshold, and 0.910 (p < 0.001) for semi-automatic segmentation. When excluding sausages IX and X, R2 coefficients of linear regression increased to 0.956 (p = 0.001) for manual segmentation, 0.947 (p = 0.001) with fixed threshold, and to 0.965 (p < 0.001) for semi-automatic segmentation. For all three segmentation methods, the CCC between the calculated iodine concentration amount and true quantity was greater than 0.94 (p < 0.001), see Table 3. Excluding sausages IX and X, the CCC value for all three segmentation methods were higher than 0.97 (p < 0.002) implying a strong correlation, Table 3.
Fig. 5. Scatterplots and regression lines for injected iodine toward estimated iodine quantities.
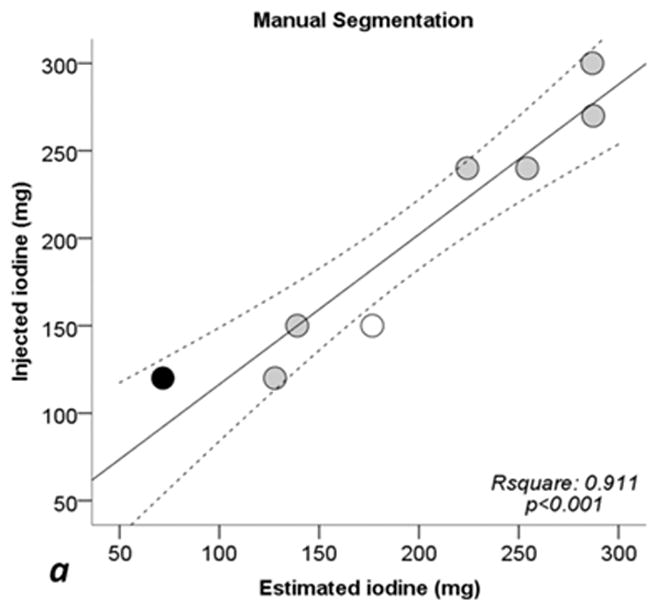
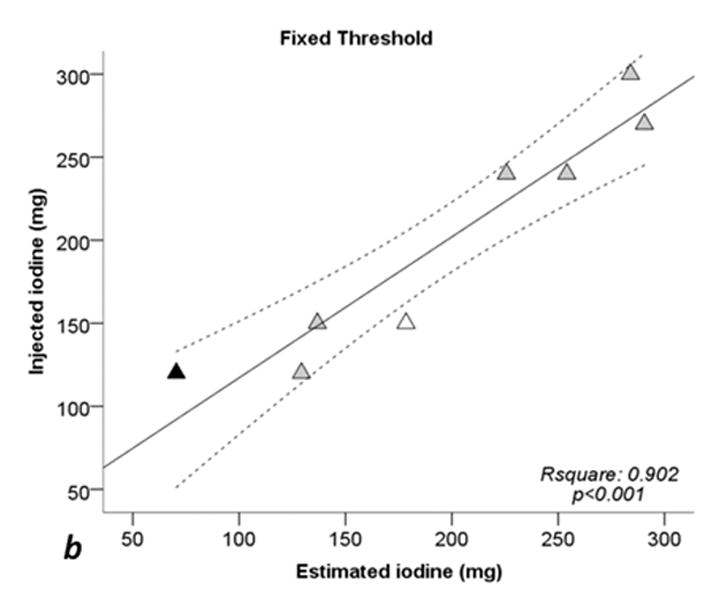
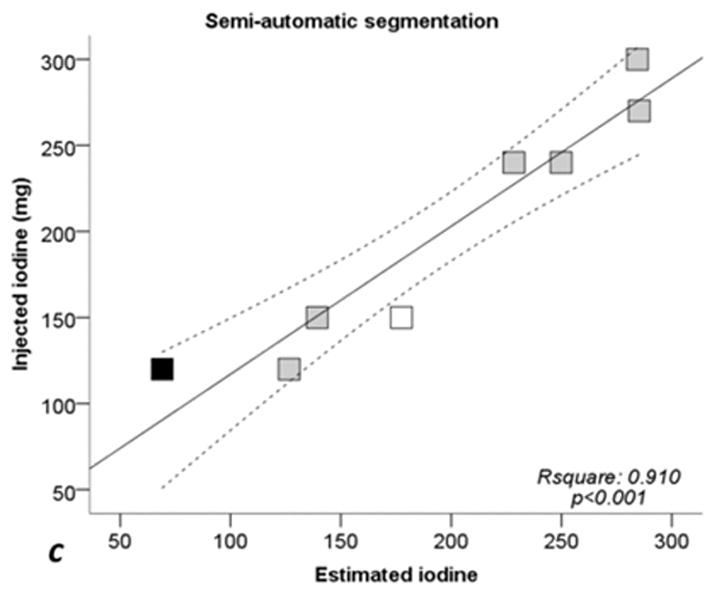
a: manual segmentation (circles). b: fixed threshold (triangles). c: semi-automatic segmentation (squares). Continuous lines: regression lines. Dotted lines: 95% confidence interval of regression line. Rsquare: coefficent of determination (R2). p: significance level of F test. White dots: Sausage IX. Black dots: sausage X. See also Tables 1 and 2.
Table 3. Concordance correlation coefficient (CCC).
Estimates of iodine quantities with the three segmentation methods toward injected iodine quantities.Average of three estimates for each segmentation method.
Concordance correlation coefficients (CCC) for estimated iodine quantities on DECT images toward injected quantities. To evaluate accuracy of the three segmentation methods, CCC are calculated considering averages of three estimates for each segmentation method. CCC are evaluated as moderate considering 8 sausages (including IX and X) whereas CCC are evaluated as substantial excluding sausages IX and X (6 sausages columns). 95% CI: 95% confidence interval.
| 8 sausages | 6 sausages (excluding IX and X) | |||
|---|---|---|---|---|
|
| ||||
| CCC | Significance, p | CCC | Significance, p | |
|
|
||||
| Manual Segmentation | 0.9546 | 0.0002 | 0.9779 | 0.0007 |
|
| ||||
| Fixed Threshold | 0.9497 | 0.0003 | 0.9733 | 0.0011 |
|
| ||||
| Semi-automatic Segmentation | 0.9540 | 0.0002 | 0.9825 | 0.0005 |
The intra-reader agreement analysis performed with the intraclass correlation coefficient (ICC) was > 0.92 for the estimated lesion volume, > 0.87 for iodine concentration, and > 0.99 for iodine quantity, see Table 4. The analysis on 6 sausages (excluding sausages IX and X), provided ICC > 0.88 for estimation of lesion volume, > 0.79 for iodine concentration, and > 0.99 for iodine quantity, see Table 4.
Table 4. Intraclass Correlation Coefficient of estimated lesion volume, iodine concentration and iodine quantity.
Intraclass Correlation Coefficient of estimated sausage volumes, iodine concentrations and iodine quantities. Intraclass correlation coefficients (ICC) are calculated on three different sessions for each segmentation method. 95% CI: 95% confidence interval.
| Estimated Lesion Volume (ml) ICC (95% CI) |
Estimated Iodine Concentration (mg/ml) ICC (95% CI) |
Estimated Iodine quantity (mg) ICC (95% CI) |
||||
|---|---|---|---|---|---|---|
| 8 sausages | 6 sausages (excluding IX and X) | 8 sausages | 6 sausages (excluding IX and X) | 8 sausages | 6 sausages (excluding IX and X) | |
| Manual Segmentation | 0.9947 (0.9801 – 0.9989) | 0.9968 (0.9872 – 0.9995) | 0.9849 (0.9484 – 0.9967) | 0.9924 (0.9698 – 0.9988) | 0.9997 (0.9988 – 0.9999) | 0.9997 (0.9990 – 1) |
|
| ||||||
| Fixed Threshold Segmentation | 0.9852 (0.9492 – 0.9968) | 0.9843 (0.9403 – 0.9976) | 0.9682 (0.8962 – 0.9930) | 0.9680 (0.8814 – 0.9950) | 0.9991 (0.9970 – 0.9998) | 0.9991 (0.9965 – 0.999) |
|
| ||||||
| Semi-automatic Segmentation | 0.9280 (0.6650 – 0.9854) | 0.8836 (0.4720 – 0.9823) | 0.8773(0.5081 – 0.9742) | 0.7932 (0.2732 – 0.9661) | 0.9940 (0.9666 – 0.9988) | 0.9907 (0.9366 – 0.9987) |
Discussion
Quantification of iodine within malignant lesions pre- and post-treatment may enable a more objective method to determine treatment response. However, for consistent results across multiple DECT vendors, the accuracy of the algorithms used to separate materials of interest should be determined with realistic phantoms. The phantom used in this study consisted of materials that are more representative of human tissue than blocks or cylinders of acrylic. While assessing the current ssDECT system with an idealized, but clinically relevant liver phantom, we demonstrated that the iodine quantity administered into a lesion may be determined by material separation algorithms with a high degree of precision, when no artifacts are present. In addition, we were able to demonstrate the impact of clinically relevant findings such as air/organ boundaries and artifacts from hyper-attenuating regions on quantitative measures derived from ssDECT. In the former case, the iodine concentration was found to be overestimated and in the latter the concentration was underestimated.
To quantify iodine within heterogenous tumors, the approach used to contour or segment will introduce undesirable uncertainty into any measurements. As noted in this experiment, moderate agreement between the calculated and true iodine quantity was observed with all three segmentation methods when sausages IX and X were included. Agreement increased when IX and X were excluded (table 3). A high ICC was observed for all segmentation methods with and without sausages IX and X (table 4). The result implies that while actual iodine quantity was in moderate agreement with the actual, administered amount, all radiologists performed consistently in their assessment over multiple measurement sessions. The presence of the macroscopic air bubbles in sausage X and associated reduction in the CCC highlights another clinically important observation. Surfaces within the abdomen that border air filled cavities or lesions with inhomogeneous or necrotic centers may cause the material separation algorithm performance to decrease (23). The incomplete or inaccurate separation of materials with ssDECT algorithms highlights the need for further validation of any quantitative methods in realistic phantoms with components that simulate clinical imaging scenarios. Results from studies depicting a high degree of accuracy between true and measured iodine quantities from DECT images should be carefully validated and cautiously interpreted.
Processing time is an important aspect in clinical workflow. As expected, manual segmentation required the longest processing time (approximately 57 min for all 8 sausages equal to approximately 5 min 40 s per sausage) whereas fixed threshold and semi-automatic segmentation required a minimal amount of time: between 13 and 23 min equal to approximately 1 min 20 s to approximately 2 min 20 s for each lesion. Thus, fixed threshold and semi-automatic segmentation were the most time-sparing techniques (Table 1).
This study has some limitations. The liver model used in this study was not perfused with iodinated blood as in “in vivo studies”. Also, the impact of variable acquisition parameters, patient sizes, and reconstruction settings were not taken into consideration. The depth of the lesions relative to the surface of the calf liver was approximately 5 cm, which is superficial. This factor is important to consider because as noted by (21), HU values measured on synthesized VMIs of varying sized phantoms, especially lower energy VMIs, may be very inaccurate (21). These inaccuracies may arise because of increased scatter with larger sized patients (21). Such errors are expected to propagate to any quantitative measurements of iodine quantity, concentration or volume. Although our experiment did not incorporate different sized phantoms, we observed the impact of attenuating markers on the accuracy of iodine concentration quantification. Future experiments should include assessments of clinically relevant artifacts on any quantitative descriptors.
In conclusion, we have determined that within this phantom model, iodine concentration may be precisely and reliably determined using ssDECT hardware and software. The semi-automatic segmentation and fixed-threshold methods are more suitable for segmentation of hyper-attenuating lesions in clinical practice because of the shorter processing time. However, the presence of image artifacts or air filled cavities may falsely increase or decrease any quantitative measurements.
Acknowledgments
Source of Funding: This research was funded in part through the NIH/NCI Cancer Center Support Grant P30 CA008748.
Footnotes
Disclosures
Dr Lorenzo Mannelli is consultant for Celgene, and a speaker for General Electric and Bracco.
Conflicts of Interest: All authors have no conflicts of interest with regard to this manuscript.
References
- 1.Flohr TG, McCollough CH, Bruder H, et al. First performance evaluation of a dual-source CT (DSCT) system. European radiology. 2006;16:256–268. doi: 10.1007/s00330-005-2919-2. [DOI] [PubMed] [Google Scholar]
- 2.Marin D, Boll DT, Mileto A, et al. State of the art: dual-energy CT of the abdomen. Radiology. 2014;271:327–342. doi: 10.1148/radiol.14131480. [DOI] [PubMed] [Google Scholar]
- 3.Liu X, Yu L, Primak AN, et al. Quantitative imaging of element composition and mass fraction using dual−energy CT: Three−material decomposition. Medical physics. 2009;36:1602–1609. doi: 10.1118/1.3097632. [DOI] [PMC free article] [PubMed] [Google Scholar]
- 4.McCollough CH, Leng S, Yu L, et al. Dual-and multi-energy CT: principles, technical approaches, and clinical applications. Radiology. 2015;276:637–653. doi: 10.1148/radiol.2015142631. [DOI] [PMC free article] [PubMed] [Google Scholar]
- 5.Li Y, Shi G, Wang S, et al. Iodine quantification with dual-energy CT: phantom study and preliminary experience with VX2 residual tumour in rabbits after radiofrequency ablation. The British journal of radiology. 2013;86:20130143. doi: 10.1259/bjr.20130143. [DOI] [PMC free article] [PubMed] [Google Scholar]
- 6.Dai X, Schlemmer H-P, Schmidt B, et al. Quantitative therapy response assessment by volumetric iodine-uptake measurement: initial experience in patients with advanced hepatocellular carcinoma treated with sorafenib. European journal of radiology. 2013;82:327–334. doi: 10.1016/j.ejrad.2012.11.013. [DOI] [PubMed] [Google Scholar]
- 7.Apfaltrer P, Meyer M, Meier C, et al. Contrast-enhanced dual-energy CT of gastrointestinal stromal tumors: is iodine-related attenuation a potential indicator of tumor response? Investigative radiology. 2012;47:65–70. doi: 10.1097/RLI.0b013e31823003d2. [DOI] [PubMed] [Google Scholar]
- 8.Uhrig M, Sedlmair M, Schlemmer H, et al. Monitoring targeted therapy using dual-energy CT: semi-automatic RECIST plus supplementary functional information by quantifying iodine uptake of melanoma metastases. Cancer imaging : the official publication of the International Cancer Imaging Society. 2013;13:306. doi: 10.1102/1470-7330.2013.0031. [DOI] [PMC free article] [PubMed] [Google Scholar]
- 9.Baxa J, Matouskova T, Krakorova G, et al. Dual-phase dual-energy CT in patients treated with erlotinib for advanced non-small cell lung cancer: possible benefits of iodine quantification in response assessment. European radiology. 2016;26:2828–2836. doi: 10.1007/s00330-015-4092-6. [DOI] [PubMed] [Google Scholar]
- 10.Nyflot MJ, Yang F, Byrd D, et al. Quantitative radiomics: impact of stochastic effects on textural feature analysis implies the need for standards. Journal of medical imaging. 2015;2:041002–041002. doi: 10.1117/1.JMI.2.4.041002. [DOI] [PMC free article] [PubMed] [Google Scholar]
- 11.Figueiras RG, Padhani AR, Goh VJ, et al. Novel oncologic drugs: what they do and how they affect images. Radiographics : a review publication of the Radiological Society of North America, Inc. 2011;31:2059–2091. doi: 10.1148/rg.317115108. [DOI] [PubMed] [Google Scholar]
- 12.Chandarana H, Megibow AJ, Cohen BA, et al. Iodine quantification with dual-energy CT: phantom study and preliminary experience with renal masses. American Journal of Roentgenology. 2011;196:W693–W700. doi: 10.2214/AJR.10.5541. [DOI] [PubMed] [Google Scholar]
- 13.Feuerlein S, Heye TJ, Bashir MR, et al. Iodine quantification using dual-energy multidetector computed tomography imaging: phantom study assessing the impact of iterative reconstruction schemes and patient habitus on accuracy. Investigative radiology. 2012;47:656–661. doi: 10.1097/RLI.0b013e31826585bb. [DOI] [PubMed] [Google Scholar]
- 14.Koonce JD, Vliegenthart R, Schoepf UJ, et al. Accuracy of dual-energy computed tomography for the measurement of iodine concentration using cardiac CT protocols: validation in a phantom model. European radiology. 2014;24:512–518. doi: 10.1007/s00330-013-3040-6. [DOI] [PMC free article] [PubMed] [Google Scholar]
- 15.Marin D, Pratts-Emanuelli JJ, Mileto A, et al. Interdependencies of acquisition, detection, and reconstruction techniques on the accuracy of iodine quantification in varying patient sizes employing dual-energy CT. European radiology. 2015;25:679–686. doi: 10.1007/s00330-014-3447-8. [DOI] [PubMed] [Google Scholar]
- 16.Li J-H, Du Y-M, Huang H-M. Accuracy of dual-energy computed tomography for the quantification of iodine in a soft tissue-mimicking phantom. Journal of applied clinical medical physics. 2015:16. doi: 10.1120/jacmp.v16i5.5519. [DOI] [PMC free article] [PubMed] [Google Scholar]
- 17.Zhang D, Li X, Liu B. Objective characterization of GE discovery CT750 HD scanner: gemstone spectral imaging mode. Medical physics. 2011;38:1178–1188. doi: 10.1118/1.3551999. [DOI] [PubMed] [Google Scholar]
- 18.Agrawal MD, Pinho DF, Kulkarni NM, et al. Oncologic applications of dual-energy CT in the abdomen. Radiographics : a review publication of the Radiological Society of North America, Inc. 2014;34:589–612. doi: 10.1148/rg.343135041. [DOI] [PubMed] [Google Scholar]
- 19.Alvarez RE, Macovski A. Energy-selective reconstructions in x-ray computerised tomography. Physics in medicine and biology. 1976;21:733. doi: 10.1088/0031-9155/21/5/002. [DOI] [PubMed] [Google Scholar]
- 20.McCollough CH, Schmidt B, Liu X, et al. Dual energy CT in clinical practice. Springer; 2011. Dual-energy algorithms and postprocessing techniques; pp. 43–51. [Google Scholar]
- 21.Goodsitt MM, Christodoulou EG, Larson SC. Accuracies of the synthesized monochromatic CT numbers and effective atomic numbers obtained with a rapid kVp switching dual energy CT scanner. Medical physics. 2011;38:2222–2232. doi: 10.1118/1.3567509. [DOI] [PubMed] [Google Scholar]
- 22.Kessler LG, Barnhart HX, Buckler AJ, et al. The emerging science of quantitative imaging biomarkers terminology and definitions for scientific studies and regulatory submissions. Statistical methods in medical research. 2015;24:9–26. doi: 10.1177/0962280214537333. [DOI] [PubMed] [Google Scholar]
- 23.Wu E-H, Kim SY, Wang ZJ, et al. Appearance and Frequency of Gas Interface Artifacts Involving Small Bowel on Rapid-Voltage-Switching Dual-Energy CT Iodine-Density Images. American Journal of Roentgenology. 2016;206:301–306. doi: 10.2214/AJR.15.14374. [DOI] [PMC free article] [PubMed] [Google Scholar]


