Abstract
Objective
To emulate three target trials: single treatment versus no treatment, joint treatment versus no treatment, and head-to-head comparison of two treatments. We explain how to estimate the observational analogs of intention-to-treat and per-protocol effects, using hazard ratios and survival curves. For per-protocol effects, we describe two methods for adherence adjustment via inverse-probability weighting.
Study Design and Setting
Prospective observational study using electronic medical records of individuals aged 55–84 with coronary heart disease from >500 practices in the United Kingdom between 2000–2010.
Results
The intention-to-treat mortality hazard ratio (95% confidence interval) was 0.90 (0.84, 0.97) for statins versus no treatment, 0.88 (0.73, 1.06) for statins plus antihypertensives versus no treatment, and 0.91 (0.77, 1.06) for atorvastatin versus simvastatin. When censoring non-adherent person-times, the per-protocol mortality hazard ratio was 0.74 (0.64, 0.85) for statins versus no treatment, 0.55 (0.35, 0.87) for statins plus antihypertensives versus no treatment, and 1.13 (0.88, 1.45) for atorvastatin versus simvastatin. We estimated per-protocol hazard ratios for a 5-year treatment using different dose-response marginal structural models, and standardized survival curves for each target trial using intention-to-treat and per-protocol analyses.
Conclusion
When randomized trials are not available or feasible, observational analyses can emulate a variety of target trials.
Keywords: Comparative effectiveness, secondary prevention, confounding, medication adherence, survival analysis, electronic health records
Introduction
Randomized trials are the preferred design to evaluate comparative effectiveness of clinical interventions (1, 2). When randomized trials are not available, one can use observational data to try to emulate the (hypothetical) target trial that we would like to conduct but we cannot (3). Availability of electronic health records has increased the potential for conducting such observational analyses (4). We have previously used electronic medical records to compare an active treatment (statin therapy) versus no treatment for primary prevention of coronary heart disease (5). Our analysis illustrated how, even in the presence of strong confounding by indication, high-quality and properly analyzed observational data may yield effect estimates that are consistent with those from randomized trials.
This report extends our previous work on primary prevention of coronary heart disease (5) and emulates the design and analysis of secondary prevention trials that compare joint treatment (a combination of two or more treatments) versus no treatment, and head-to-head trials that compare two active treatments. We present methods to estimate the analogs of the intention-to-treat and per-protocol effects and describe how to estimate standardized survival curves to overcome the limitations of hazard ratios (6) for comparative effectiveness research.
Methods
Study population
The Health Improvement Network is a database of medical records from more than 500 primary care practices in the United Kingdom. The database includes demographic information, symptoms and diagnoses, referrals and hospitalizations, outpatient prescriptions, test results and some lifestyle information. Drug prescriptions are also taken from the general practitioners’ database and disease diagnoses have been recorded using standard READ codes. We included data from January 1st 2000 through December 31st 2010.
Three target trials
We consider three target trials with a common set of baseline eligibility criteria: age 55 to 84 years; prior myocardial infarction, angina pectoris or revascularization (qualifying event); no use of any statin in the past year; and no history of cancer, dementia, psychosis or chronic heart, liver or kidney failure. In all trials patients are followed from baseline (between January 2000 and June 2010) until death (the primary outcome), or loss to follow-up.
Patients are randomly assigned to usual care with or without statin therapy in target trial (i), to usual care with either a combination of statins and antihypertensives or neither therapy (no use of any antihypertensive in the past year is an additional eligibility criterion) in target trial (ii), and to usual care with either atorvastatin or simvastatin therapy in target trial (iii). Statin therapy does not include cerivastatin, which was taken off the market due to safety concerns.
Emulating the target trials
We applied to the Health Improvement Network data the same baseline eligibility criteria described above plus having at least 2 years of continuous recording in the database, at least one health contact within the past 2 years, and information on all potential confounders measured at least once during the past 2 years (see list of potential confounders in Table 1 and Appendix Table 1).
Table 1.
Major baseline characteristics of the eligible study population when emulating three target trials, The Health Improvement Network 2000–2010. Numbers in the table are means (standard deviations) unless otherwise specified (see Appendix Table 1 for more comparisons).
| Characteristic | Target trial (i) Statins versus no treatment | Target trial (ii) Statins and antihypertensives versus no treatment | Target trial (iii) Atorvastatin versus simvastatin | |||
|---|---|---|---|---|---|---|
| Non-initiators (302,895) | Initiators (7,776) | Non-initiators (35,153) | Initiators (542) | Simvastatin initiators (4,828) | Atorvastatin initiators (1,979) | |
| Age, years | 69.9 (8.5) | 69.1 (8.4) | 68.9 (8.5) | 66.1 (9.2) | 69.5 (8.5) | 68.6 (8.3) |
| Male, % | 57.6 | 60.2 | 63.7 | 71.4 | 61.2 | 60.0 |
| Low-density lipoprotein cholesterol, mmol/L | 3.08 (0.9) | 3.50 (0.9) | 3.2 (0.9) | 3.6 (1.1) | 3.43 (0.9) | 3.58 (1.0) |
| High-density lipoprotein cholesterol, mmol/L | 1.39 (0.4) | 1.38 (0.4) | 1.4 (0.4) | 1.3 (0.4) | 1.38 (0.4) | 1.37 (0.4) |
| Body mass index, kg/m2 | 27.8 (5.1) | 28.0 (4.9) | 26.5 (4.5) | 27.5 (4.5) | 28.0 (5.0) | 27.9 (4.5) |
| Systolic blood pressure, mmHg | 138 (17) | 140 (19) | 136 (16) | 145 (23) | 140 (18) | 141 (20) |
| Alcohol use, units/day | 0.07 (0.25) | 0.07 (0.26) | 0.07 (0.25) | 0.05 (0.23) | 0.07 (0.26) | 0.07 (0.25) |
| Doctor visits in the past 3 months | 3.8 (3.3) | 4.9 (3.1) | 3.2 (3.0) | 5.9 (3.0) | 5.0 (3.2) | 4.7 (3.0) |
| Referrals in the past 3 months | 0.8 (1.3) | 1.0 (1.5) | 0.7 (1.2) | 1.4 (1.7) | 1.0 (1.5) | 0.8 (1.3) |
| Hospitalizations in the past 3 months | 0.06 (0.31) | 0.12 (0.44) | 0.04 (0.24) | 0.25 (0.61) | 0.13 (0.45) | 0.12 (0.46) |
| Smoking prevalence, % | ||||||
| Never | 49.3 | 46.9 | 44.9 | 38.3 | 44.8 | 49.5 |
| Current | 13.3 | 16.2 | 19.7 | 22.0 | 16.2 | 16.1 |
| Former | 37.4 | 36.9 | 35.4 | 39.7 | 39.0 | 34.4 |
| Hypertension, % | 65.4 | 60.0 | 24.3 | 35.8 | 60.7 | 59.0 |
| Diabetes, % | 16.6 | 18.2 | 10.4 | 10.3 | 18.2 | 17.5 |
| Stroke, % | 6.2 | 8.3 | 4.8 | 5.5 | 7.9 | 9.1 |
| MI, % | 30.7 | 35.9 | 34.1 | 43.5 | 34.6 | 37.4 |
| Angina, % | 84.6 | 82.8 | 1.5 | 19.0 | 83.6 | 82.3 |
| Revascularization, % | 12.0 | 14.1 | 13.9 | 19.0 | 13.0 | 15.4 |
Individuals in the Health Improvement Network data can meet the eligibility criteria for each target trial at several times. Rather than choosing one of those times (say, June 2005) as the trial’s time zero, we emulated each target trial as a sequence of trials (5) that started at each of the 126 months between January 2000 and June 2010. Eligible individuals at each of the 126 baselines were assigned to a treatment group and followed until age 85, death, or loss to follow-up (due to end of data collection at the patient’s practice). Individuals were included in all monthly trials for which they met the eligibility criteria.
In each monthly trial for the ‘single treatment’ trial (i), eligible individuals who initiated any statin during the baseline month were assigned to the treatment arm and non-initiators to the no-treatment arm. In each monthly trial for the ‘joint treatment’ trial (ii), eligible individuals who initiated any statin during the baseline month and any antihypertensive therapy within 2 months (or vice versa) were assigned to the treatment arm, those initiating only statins or antihypertensives were excluded, and all others were assigned to the no-treatment arm. There were no deaths within the 2 months after initiating the first treatment and before starting the second treatment and only 4 patients were lost to follow-up during this period so there was no need to use more complex approaches (7). In each monthly trial for the ‘head-to-head’ trial (iii), eligible individuals who initiated atorvastatin during the baseline month were assigned to one arm and those initiating simvastatin to the other arm; all others were excluded. Participants initiating both atorvastatin and simvastatin were assigned to atorvastatin in the main analysis and to simvastatin in a sensitivity analysis (estimates did not materially change; data not shown).
Estimating the observational analog of the intention-to-treat effect
In a randomized trial, the intention-to-treat effect is the effect of being assigned to a treatment strategy. To estimate an observational analog, we estimated the effect of being prescribed treatment by pooling the data across all monthly trials (for statistical efficiency) and fitting a pooled logistic regression model as explained in the Appendix. Depending on the trial being emulated, the indicator for treatment was coded as 1 for (i) statin, (ii) statin plus antihypertensive therapy, or (iii) atorvastatin, and 0 for the corresponding reference group. Assuming no unmeasured confounding given the covariates included in the model, and a low monthly mortality risk (e.g. <10%) within levels of these covariates, the coefficient for treatment indicator approximates the intention-to-treat log mortality hazard ratio (8) of a target trial with the same adherence pattern as the Health Improvement Network data.
Because of the limitations of hazard ratios as effect measures,(6) we also estimated survival curves for each arm by fitting a pooled logistic model similar to the one explained above except that it included product (“interaction”) terms to allow the hazard ratio to change over time. predicting the conditional survival at each time, and standardizing the survival probabilities to the joint distribution of the selected confounders at baseline (see Appendix for details).
Estimating the observational analog of the per-protocol effect
In a randomized trial, the per-protocol effect is the effect that would have been observed had all individuals adhered to their assigned treatment strategy throughout the follow-up. We have previously implemented two methods to estimate the observational analog of the per-protocol effect (5). We now describe these two methods for trials (i), (ii), and (iii):
Censoring at discontinuation of the treatment strategy assigned at baseline. For trial (i), we censored individuals in the treatment group when they discontinued statin therapy and those in the no treatment group when they initiated statin therapy. For trial (ii), we censored individuals in the treatment group when they discontinued either statins or antihypertensives, and those in the no treatment group when they initiated either therapy. For trial (iii), we censored individuals when they discontinued their assigned active treatment (i.e. atorvastatin or simvastatin). For all trials, we then fit to the censored data the same pooled logistic models described in the previous section to estimate the hazard ratio and the survival curves.
Specifying a dose-response marginal structural model (in reference (5) we imprecisely referred to this as an ‘as-treated’ analysis). For all trials, we fit the same pooled logistic models described in the previous section to estimate the hazard ratio and the survival curves, with the exception that we replaced the indicator for treatment arm by a time-varying function of treatment use since baseline. Our main analysis used cumulative dose (linear and squared terms). In sensitivity analyses, we used five other dose-response models: linear cumulative dose, cumulative average dose (linear term only, linear and squared terms), and cumulative dose in the two most recent year plus cumulative dose in the previous period (linear only, linear and quadratic). We then estimated the hazard ratio and survival for continuous treatment versus no treatment during the follow-up using models that included product (“interaction”) terms between cumulative dose (or other functions of treatment history) and follow-up time.
Even when using a dose-response model, we used censoring to resolve estimation problems in trial (i) and to preserve the interpretability of the estimates in trials (ii) and (iii). Because of the difficulty to model multiple treatment changes in trial (i), we censored individuals when they changed treatment 5 times during the follow-up (which led to excluding about 4% of observations). That is, we emulated a target trial in which the protocol did not allow subjects to switch treatment more than 4 times. For target trial (ii), we censored individuals when they received just one of the two active treatments (statins or antihypertensives); and for target trial (iii), we censored individuals when they received neither of the two active treatments (atorvastatin or simvastatin).
The above hazard ratio and survival estimates are adjusted for measured baseline confounders, but not for post-baseline, time-varying confounders (which predict treatment and therefore censoring). To adjust for measured time-varying confounders, we weighted each individual’s contributions to the pooled logistic model by the subject-specific time-varying stabilized inverse-probability weights (see Appendix). Informally, the denominator of the inverse-probability weight is the probability that a subject received his own observed treatment given his past treatment and covariate history, and the numerator (the stabilizing factor) is the probability that a subject received his observed treatment conditional only on his past treatment history and baseline prognostic factors. The stabilized inverse-probability weights create a ‘pseudo-population’ in which treatment is independent of prognostic factors history (9).
To estimate the denominator of the weights for target trials (i) and (ii), we used the predicted values from two separate logistic models to allow the association between covariates and treatment to vary by prior treatment status (see Appendix). We used the predicted probabilities of treatment from these models to calculate the denominator of the weights, and a separate pair of models without time-varying confounders to estimate the numerator of the weights.
To estimate the denominator of the weights for the joint treatment trial (ii) and the head-to-head trial (iii), we fit two nested logistic regression models (separately by treatment level in the previous month). For target trial (ii) the first model estimated the monthly conditional probability of remaining uncensored, that is using either statin or antihypertensive; the second model estimated the monthly probability of receiving both treatments among the uncensored. Because switching from both treatments to no treatment in this target trial likely reflects a clinical contraindication for treatment, the protocol of the target trial allowed such a change, which we emulated by not updating the inverse-probability weights after discontinuing both treatments (<1% of observations). Similarly, for trial (iii), the first model estimated the monthly probability of receiving either atorvastatin or simvastatin. The second model estimated the monthly probability of receiving atorvastatin among those on one of the two active treatments. We stopped updating the IP weights when an individual switched from atorvastatin to simvastatin and vice versa which occurred in around 1% of observations, effectively emulating a protocol that allowed individuals to make that change.
To prevent undue influence by a limited number of observations with extreme weights, we truncated the inverse-probability weights at their 99th percentile. We used nonparametric bootstrapping with 500 samples to calculate 95% confidence intervals for the survival difference estimates and for hazard ratios in per-protocol analyses using a dose-response model (10). For all other hazard ratios, we used robust variances to calculate conservative 95% confidence intervals using fewer computational resources. All analyses were conducted using SAS 9.4 (SAS Institute Inc., Cary, NC, USA). Relevant code and documentation are available at www.hsph.harvard.edu/causal/software.
Results
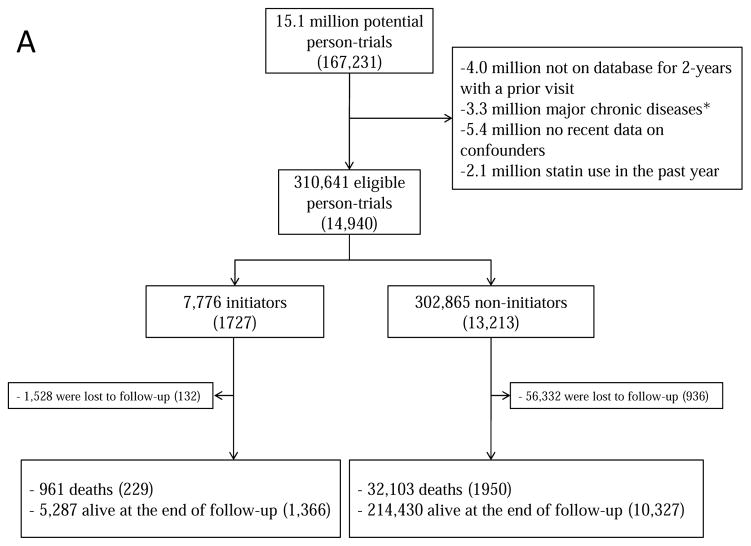
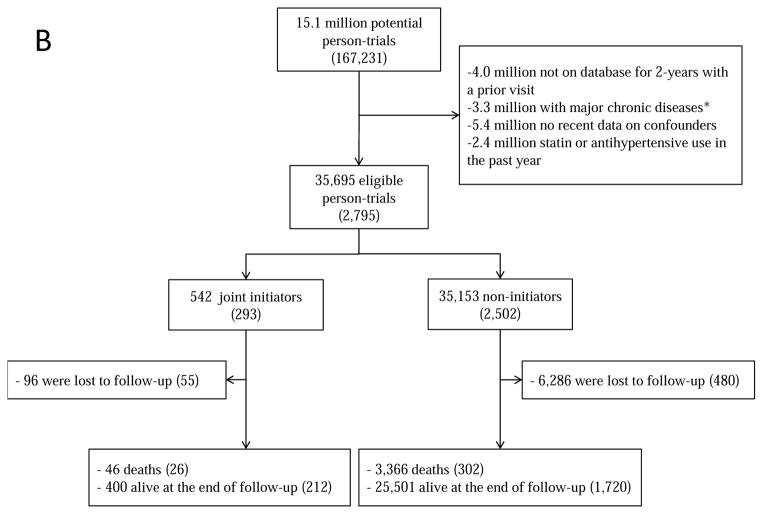
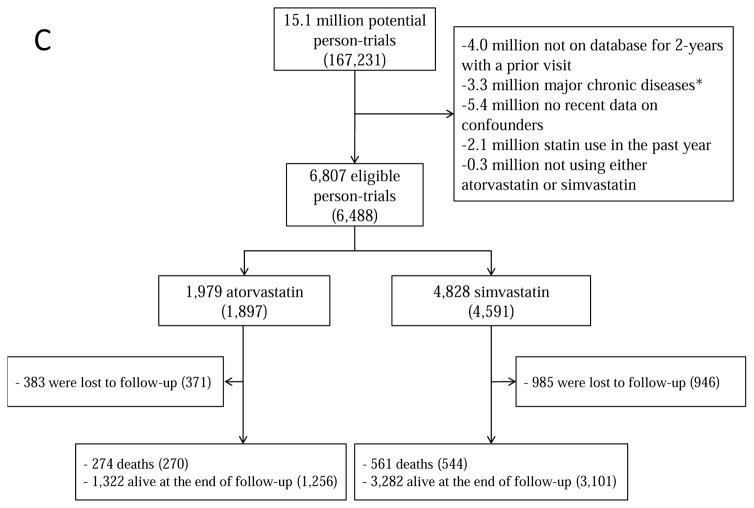
Figure 1 summarizes the selection of individuals for each of the 3 target trials. Because individuals may be eligible for multiple monthly trials, the total number of eligible individuals, when pooled over all monthly trials, is greater than the number of unique individuals. Table 1 and Appendix Table 2 present the baseline characteristics of the eligible individuals by initial treatment. For example, for target trial (i) statin initiators were on average slightly younger, had higher low-density lipoprotein (LDL)-cholesterol levels and more doctor visits and hospitalizations, and included more current smokers, diabetics and aspirin and beta-blocker users. However, the differences were generally small. Appendix Table 2 presents the characteristics of all individuals that would have been eligible if complete data on potential confounders listed in Table 1 and Appendix Table 1 had not been an eligibility criterion.
Figure 1.
Selection process for participants, The Health Improvement Network 2000–2010 (A) statins; (B) statins and antihypertensives; (C) atorvastatin versus simvastatin. Numbers in parentheses indicate unique individuals.
aMajor chronic disease was defined as cancer, chronic kidney disease, liver failure, congestive heart failure, dementia, schizophrenia or organ transplant.
Target Trial (i): Single treatment with any statin versus no treatment
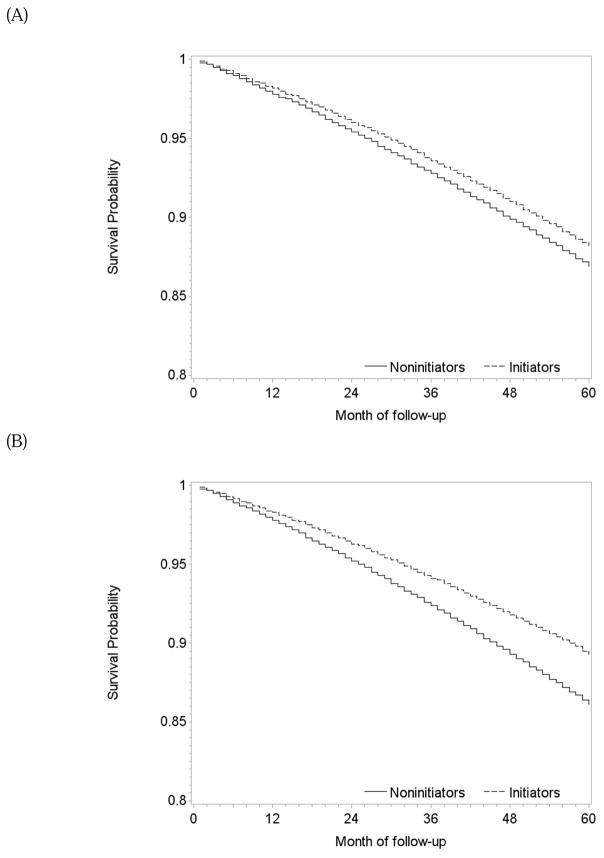
During 1.2 million person-years of follow-up, there were 229 deaths among initiators (mean follow-up of 58 months) and 1950 deaths among non-initiators (mean follow-up of 48 months). The intention-to-treat mortality hazard ratio (95% CI) was 0.90 (0.84, 0.97) (Table 2). A product term between the indicator for treatment initiation and baseline month had a P-value of 0.83, which supports our pooling the estimates across monthly trials. The survival difference (95% CI) between initiators and non-initiators was 0.3% (0.1%, 0.5%) at one year and 1.2% (0.5%, 2.1%) at 5 years of follow-up (Figure 2A).
Table 2.
Analog of the intention-to-treat and per-protocol mortality hazard ratios (95% confidence intervals) when emulating three target trials, The Health Improvement Network 2000–2010
| Adjustment for covariates |
Target Trial (i): Statins versus no treatment |
Target Trial (ii): Statins and antihypertensives versus no treatment |
Target Trial (iii): Atorvastatin versus simvastatin |
||||||
|---|---|---|---|---|---|---|---|---|---|
| Intention to treat effect |
Per-protocol effect | Intention to treat effect |
Per-protocol effect | Intention to treat effect |
Per-protocol effect | ||||
| Censoring at non- adherencea |
Dose- response structural modelb |
Censoring at non- adherencea |
Dose- response structural modelb |
Censoring at non- adherencea |
Dose- response structural modelb |
||||
| Unadjusted | 0.94 (0.88, 1.01) | 0.78 (0.69, 0.88) | 0.94 (0.81, 1.07) | 0.95 (0.82, 1.11) | 0.84 (0.64, 1.11) | 0.74 (0.41, 1.39) | 0.91 (0.78, 1.05) | 1.05 (0.84, 1.30) | 1.00 (0.77, 1.37) |
| Adjusted for baseline covariatesb | 0.90 (0.84, 0.97) | 0.71 (0.62, 0.82) | 0.87 (0.75, 0.99) | 0.88 (0.73, 1.06) | 0.64 (0.42, 0.97) | 0.82 (0.45, 1.26) | 0.91 (0.77, 1.06) | 1.07 (0.84, 1.36) | 1.16 (0.85, 1.43) |
| Adjusted for baseline and time- varying covariatesc | NA | 0.74 (0.64, 0.85) | 0.87 (0.73, 1.03) | NA | 0.55 (0.35, 0.87) | 0.79 (0.42, 1.31) | NA | 1.13 (0.88, 1.45) | 1.18 (0.88, 1.52) |
Confidence intervals are conservative because they were based on a robust variance.
We used cumulative dose and its squared term as the function of treatment. Estimates correspond to the average hazard ratio over a 5-year period.
Characteristics listed in Table 1
Age (in 5 year age groups), categories of body mass index, systolic blood pressure, LDL-cholesterol, HDL-cholesterol, months since last measure of SBP, months since last measure of LDL, months since last measure of HDL, number of doctor visits in the past 3 months, number of referrals in the past 3 months, number of hospitalizations in the past 3 months; indicators for diabetes status, hypertension status, atrial fibrillation, antihypertensive use, insulin use, non-statin lipid lowering agent use, beta blocker use.
NA: Not applicable
Figure 2.
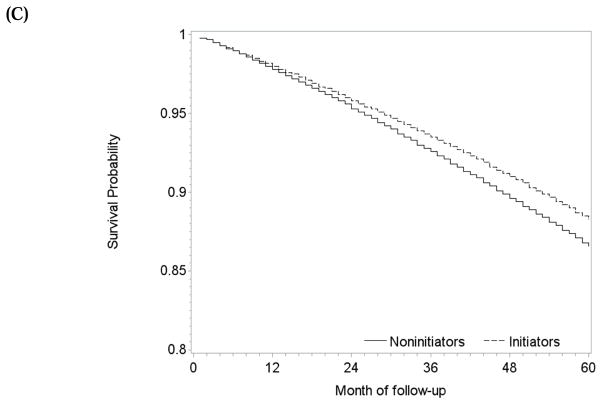
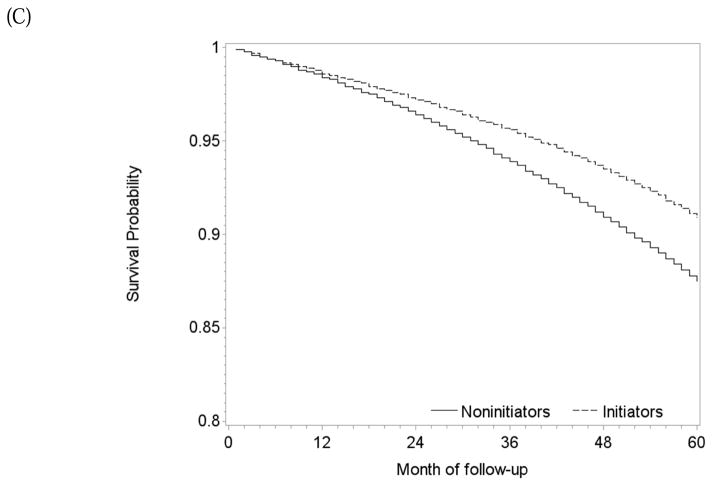
Estimated survival curves after initiation and no initiation of statins, The Health Improvement Network 2000–2010. (A) intention-to-treat effect, (B) per-protocol effect via censoring non-adherent person-times, (C) per-protocol effect via dose-response model
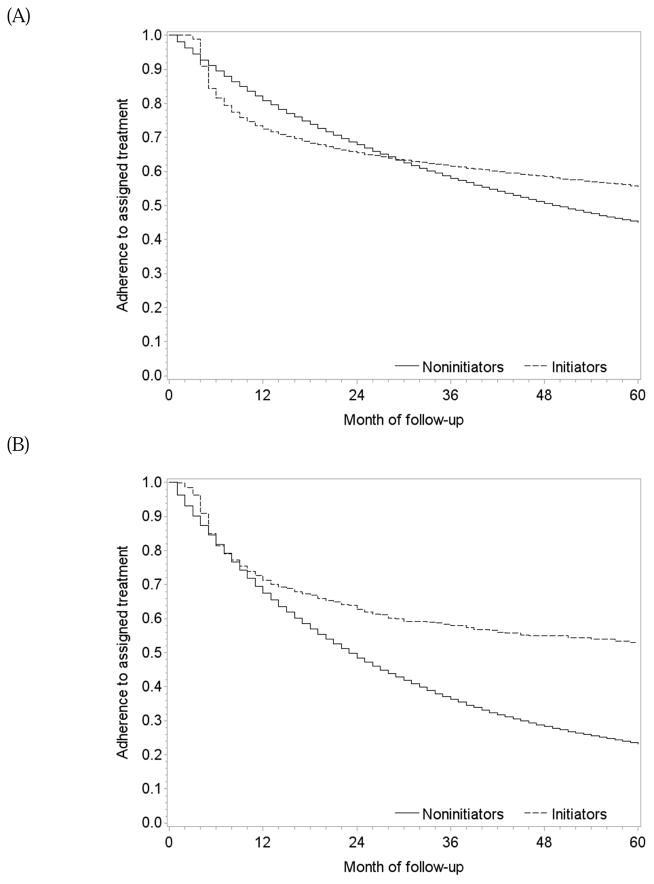
One-year and 5-year adherence to the baseline assignment was 72% and 56% in initiators, and 81% and 45% in non-initiators, respectively (Figure 3A). Among initiators, predictors of higher adherence were lower LDL-cholesterol, frequent measurements of LDL-cholesterol and doctor visits, and use of antihypertensives (Appendix Table 3).
Figure 3.
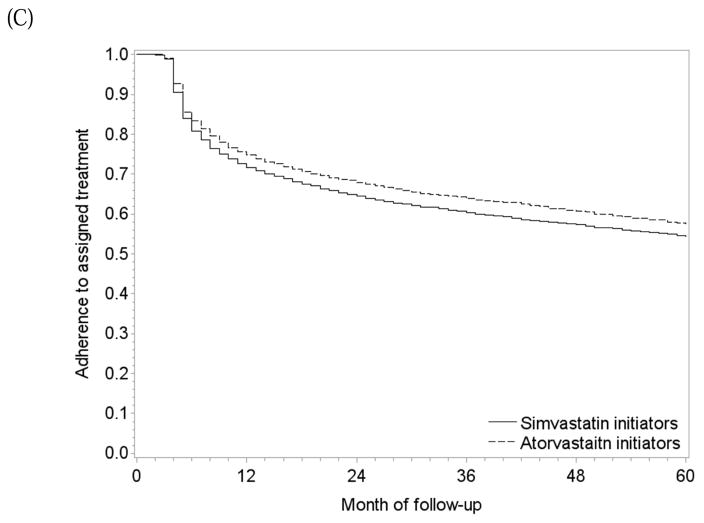
Adherence to treatment in the eligible population when emulating three target trials, The Health Improvement Network 2000–2010. (A) statins vs. no statins, (B) statins and antihypertensives versus neither, and (C) atorvastatin versus simvastatin
Table 2 also presents the two sets of per-protocol effect estimates. After censoring non-adherent person-times, mean follow-up was 40 months among initiators (139 deaths) and 30 months among non-initiators (965 deaths). The mean of the stabilized inverse-probability weights was 1.10 (99th percentile: 2.86; Appendix Table 4) and 0.99 after truncation. The mortality hazard ratio was 0.74 (0.64, 0.85) when censoring at non-adherence and 0.87 (0.73, 1.03) for 5 years of continuous treatment with statins when using a dose-response model. The survival difference between continuous treatment and no treatment estimated by censoring at non-adherence was 0.5% (0.2%, 0.9%) at 1 year and 3.2% (0.2%, 4.7%) at 5 years of follow-up (Figure 2B). The dose-response model gave similar results (Figure 2C).
Target Trial (ii): Joint treatment with statins and antihypertensives versus no treatment
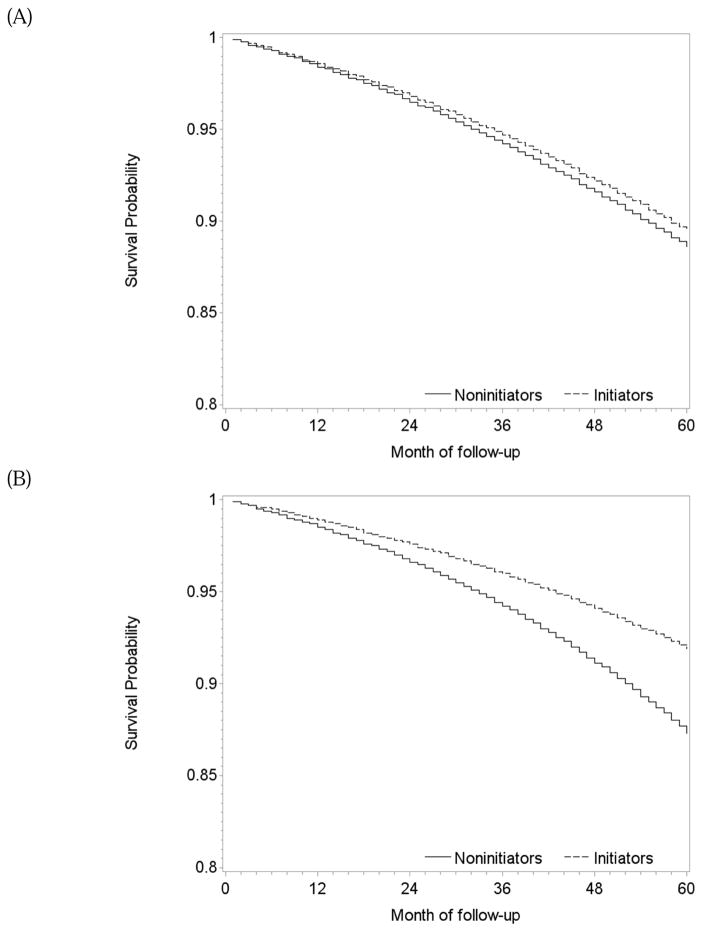
During 154,259 person-years of follow-up, there were 26 deaths among initiators (mean follow-up of 56 months) and 302 deaths among non-initiators (mean follow-up of 51 months). The intention-to-treat mortality hazard ratio for joint treatment with statins and antihypertensives versus no treatment was 0.88 (0.73, 1.06) (Table 2). The survival difference between initiators and non-initiators was less than 1% at one year and 1% (−0.8%, 2.6%) at 5 years of follow-up (Figure 4A).
Figure 4.
Estimated survival curves after initiation and no initiation of statins plus antihypertensives, The Health Improvement Network 2000–2010. (A) intention-to-treat effect, (B) per-protocol effect via censoring non-adherent person-times, (C) per-protocol effect via dose-response model
One-year and 5-year adherence to the baseline treatment was 71% and 53% in initiators, and 67% and 23% in non-initiators (Figure 3B). The per-protocol mortality hazard ratio for continuous treatment with statins and antihypertensives versus no treatment was 0.55 (0.35, 0.87) when censoring at non-adherence and 0.79 (0.42, 1.31) for 5 years of treatment when using a dose-response model. The survival difference between continuous treatment and no treatment estimated via censoring at non-adherence was less than 1% at 1 year and 3.2% (0.9%, 6.9%) at 5 years of follow-up (Figure 4B). The survival curves estimated using the selected dose-response curves (i.e. linear and quadratic cumulative dose) showed a similar but smaller survival benefit for the treated (Figure 4C).
Target Trial (iii): Head-to-head comparison of atorvastatin versus simvastatin
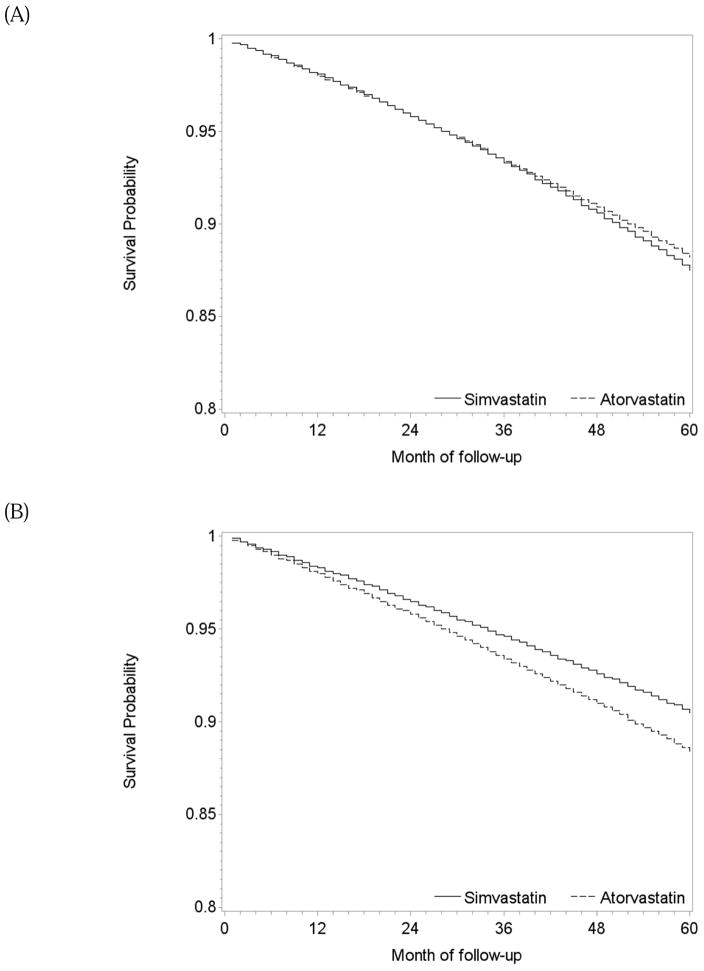
During 22,738 person-years of follow-up, there were 270 deaths among atorvastatin initiators (mean follow-up 47 months) and 544 among simvastatin initiators (mean follow-up 37 months). The intention-to-treat mortality hazard ratio for atorvastatin versus simvastatin was 0.91 (0.77, 1.06) (Table 2). The survival difference between initiators of atorvastatin and simvastatin was less than 1% at 5 years (Figure 5A).
Figure 5.
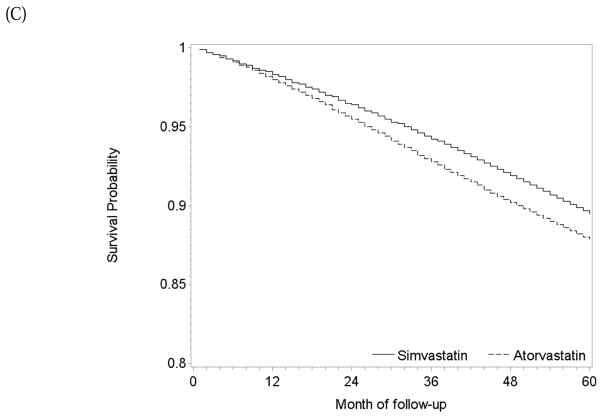
Estimated survival curves after initiation of atorvastatin and initiation of simvastatin, The Health Improvement Network 2000–2010. (A) intention-to-treat effect, (B) per-protocol effect via censoring non-adherent person-times, (C) per-protocol effect via dose-response model
One-year and 5-year adherence to the baseline treatment was 75% and 58% in initiators of atorvastatin, and 72% and 54% in initiators of simvastatin (Figure 3C). The per-protocol mortality hazard ratio was 1.13 (0.88, 1.45) when censoring at non-adherence, and 1.18 (0.88, 1.52) for 5 years of continuous treatment when using a dose-response model (Table 2). The survival difference between continuous use of atorvastatin versus simvastatin was less than 1% at 1 year and −2.1% (−6.1%, 4.3%) at 5 years (Figure 5B) with similar results from the dose-response model (Figure 5C).
The per-protocol estimates were sensitive to the choice of dose-response functions especially for the joint treatment trial (ii) (Table 3). Under a variety of functional forms, the mortality hazard ratios for five years of treatment ranged from 0.81 to 0.92 for target trial (i), from 0.78 to 1.05 for target trial (ii), and from 1.13 to 1.31 for target trial (iii).
Table 3.
Sensitivity of estimates of the per-protocol mortality hazard ratio for five years of treatment (95% confidence interval) to the choice of dose response model when emulating three target trials, The Health Improvement Network 2000–2010
| Functional form for treatment a | Target Trial (i): Statins versus no treatment | Target Trial (ii): Statins and antihypertensives versus no treatment | Target Trial (iii): Atorvastatin versus simvastatin |
|---|---|---|---|
| Cumulative dose – linear only | 0.84 (0.70, 1.02) | 0.85 (0.52, 1.12) | 1.13 (0.85, 1.50) |
| Cumulative dose – linear and quadratic | 0.87 (0.73, 1.03) | 0.79 (0.42, 1.31) | 1.18 (0.88, 1.52) |
| Cumulative average dose – linear only | 0.81 (0.66, 0.97) | 0.79 (0.48, 1.03) | 1.14 (0.87, 1.46) |
| Cumulative average dose – linear and quadratic | 0.91 (0.76, 1.07) | 0.82 (0.35, 1.45) | 1.16 (0.88, 1.43) |
| Cumulative dose in most recent 2 years and in the previous period – linear only | 0.89 (0.70, 1.08) | 0.85 (0.56, 1.28) | 1.31 (0.92, 1.55) |
| Cumulative dose in most recent 2 years and in the previous period – linear and quadratic | 0.92 (0.76, 1.12) | 1.05 (0.46, 1.83) | 1.23 (0.91, 1.62) |
In trial (i), we conducted sensitivity analyses for key analytic decisions. First, we repeated the analyses without the requirement for data on all baseline covariates, which showed that the exclusion of these individuals made our estimates of intention-to-treat hazard ratio more conservative. Second, we allowed each patient to enroll only in one monthly trial. This did not change the intention-to-treat estimate but increased the standard error of the log hazard ratio from 0.038 to 0.073. That is, there are substantial gains in efficiency when we allow patients to enroll in more than one trial, even when using a robust variance. Third, we allowed prevalent users, which resulted in 1.9 million monthly trials (rather than 310,641) and substantially altered the eligibility criteria and treatment strategies of the target trial. Specifically, the trial is now conducted in a population that contains both statin users and nonusers, and in which each individual is assigned to either statin (no change if a user, initiation if a nonuser) or no statin (discontinuation if a user, no change if a nonuser). After adjusting for variables in Table 1 and Appendix Table 1, mortality hazard ratio for current users versus nonusers of statins in this modified analysis was 0.91 (0.85, 0.97) and, after further adjustment for prior statin use, 0.85 (0.80, 0.92). This small difference suggests a relatively small potential for differential survival bias (11, 12). Finally, using a restricted cubic spline instead of linear and quadratic terms to model follow-up time did not materially change the intention-to-treat hazard ratio.
Discussion
We emulated target trials to estimate the effect of statins and antihypertensives on death after CHD using electronic medical records. An explicit emulation prevents biases such as prevalent user bias (13) and immortal time bias (14), and helps define the observational analog of per-protocol effects. We illustrated how one can estimate per-protocol effects via inverse-probability weighting (15) and by estimating both average hazard ratios and standardized survival curves (6). Similar approaches to estimate per-protocol effects can be adopted in randomized trials (16).
Our effect estimates were weaker than those from true randomized trials. In the ‘single treatment’ trial (i) for statin only, our mortality hazard ratio estimate was 0.90 compared with the pooled hazard ratio of 0.84 from a meta-analysis of secondary prevention randomized trials (17), and our survival difference at 60 months was 1.2% compared with 3.6% at 70 months in the 4S trial (18). The weaker estimates may be due to confounding by unmeasured factors, measurement error, differences in study populations and length of follow-up, or lower adherence to treatment in our population (28% non-adherence among initiators at 1 year compared with about 15% by the end of follow-up in a review of randomized trials (17)). Specifically, the lower hazard ratio of 0.73 for the first year of follow-up (Appendix Table 5) compared with 0.90 for the entire follow-up, indicates that doctors tend to prescribe statins to patients with better prognostic factors (which were not recorded in the database). This is in contrast to our previous findings in a primary prevention analysis where the hazard ratio for statins and incident coronary heart disease was higher in the first year of follow-up (5).
In the ‘joint treatment’ trial (ii) for statins and antihypertensives versus no treatment, the intention-to-treat hazard ratio estimate of 0.88 had a wide 95% confidence interval and probably underestimated benefit of the joint treatment because of unmeasured confounding for antihypertensives. In fact, when we tried to emulate a target trial of antihypertensives vs. no antihypertensives (data not shown), the intention-to-treat hazard ratio suggested a 12% increased death rate in the treatment group. In the ‘head-to-head’ trial (iii) for atorvastatin vs. simvastatin, the intention-to-treat hazard ratio of 0.91 had a wide 95% confidence interval and was consistent with the lack of survival differences between different types of statins reported in a meta-analysis of randomized trials (19).
We used two methods to estimate the per-protocol effect: a relatively inefficient censoring procedure that does not require a dose-response model, and a theoretically more efficient method that will result in bias if the dose-response model is misspecified. In practice, the dose-response model did not always result in more efficient estimates (even though censoring-based estimates had conservative confidence intervals around them) because inverse-probability weights were estimated during longer periods which resulted in loss of efficiency. Importantly, these effect estimates were sensitive to the choice of dose-response model. Further research into dose-response modeling for per-protocol effects is warranted (20, 21)
Because per-protocol effects are defined as the effect that would have been observed under full adherence, it is key to use a definition of adherence that is clinically meaningful. Specifically, individuals who discontinue treatment due to toxicity or other clinically mandated reasons are in fact adhering to the protocol, as no reasonable clinical protocol would force patients to stay on treatment in these situations. (22) Unfortunately, as we did not have data on the reasons to change treatment, our per-protocol effect estimates considered all deviations from the baseline treatment as non-adherence. We do not expect this limitation to have a substantial impact on the estimates because statins and antihypertensives have low rates of toxicity. (23, 24)
Both methods for estimating the per-protocol effect used inverse-probability weighting to adjust for time-varying confounding. Inverse-probability weights are sensitive to violations of the positivity assumption (25), as a result of certain treatment-confounder combinations being observed in a small subset of the population.
In conclusion, we described and implemented methods to emulate three types of randomized trials using observational data. We explained how to estimate the observational analogs of the intention-to-treat and per-protocol effects, and how to estimate standardized survival curves and quantify uncertainty in quantities of interest.
Supplementary Material
What is new?
When randomized trials are not available, one can use observational data to try to emulate a (hypothetical) target trial.
We emulated three different types of target trials of secondary prevention using observational data from electronic medical records: a single treatment trial, a joint treatment trial, and a head-to-head comparison trial.
We presented methods to estimate hazard ratios and standardized survival curves for the analogs of the intention-to-treat and per-protocol effects.
Compared with our previous study on primary prevention in the same population, confounding was in the opposite direction: here treated participants had a lower risk of coronary heart disease.
Research Question: Target trial (i).
Context
Statins have been shown to reduce the risk of death after myocardial infarction in randomized trials.
Objective
We emulated the design and analysis of a ‘single treatment’ target trial of secondary prevention using statins.
Population
Adults aged 55 to 84 with a prior myocardial infarction, angina pectoris or revascularization
Intervention
Statin therapy
Comparator
No statin therapy
Outcome
Death from any cause
Timeframe
Maximum of eleven years of follow-up between Jan 2000 and June 2010
Research Question: Target trial (ii).
Context
Statins and antihypertensive drugs have been shown to separately reduce the risk of death after myocardial infarction in randomized trials.
Objective
We emulated the design and analysis of a ‘joint treatment’ target trial of secondary prevention using a combination of statin and antihypertensive.
Population
Adults aged 55 to 84 with a prior myocardial infarction, angina pectoris or revascularization
Intervention
Statin and antihypertensive therapy
Comparator
No statin or antihypertensive therapy
Outcome
Death from any cause
Timeframe
Maximum of eleven years of follow-up between Jan 2000 and June 2010
Research Question: Target trial (iii).
Context
Different statins have been shown to have similar efficacy in reducing the risk of death after myocardial infarction in randomized trials.
Objective
We emulated the design and analysis of a ‘head-to-head’ target trial of secondary prevention.
Population
Adults aged 55 to 84 with a prior myocardial infarction, angina pectoris or revascularization
Intervention
Atorvastatin therapy
Comparator
Simvastatin therapy
Outcome
Death from any cause
Timeframe
Maximum of eleven years of follow-up between Jan 2000 and June 2010
Acknowledgments
Sources of Funding: This work was funded through the American Recovery and Reinvestment Act “DEcIDE Methods Center” from the Agency for HealthCare Research and Quality and the Brigham and Women’s Hospital, by NIH grant R01 HL080644 and through NIH grant R01 DK090435.
Footnotes
Author contributions: GD and MAH designed the study concept. LAGR and OFC created the analytical datasets and RWL developed the SAS program. GD conducted the analysis and wrote the first draft of the manuscript, all other authors provided comments on the manuscript. GD had access to all the data and is the study guarantor.
Publisher's Disclaimer: This is a PDF file of an unedited manuscript that has been accepted for publication. As a service to our customers we are providing this early version of the manuscript. The manuscript will undergo copyediting, typesetting, and review of the resulting proof before it is published in its final citable form. Please note that during the production process errors may be discovered which could affect the content, and all legal disclaimers that apply to the journal pertain.
References
- 1.Avorn J. Debate about funding comparative-effectiveness research. N Engl J Med. 2009;360(19):1927–9. doi: 10.1056/NEJMp0902427. Epub 2009/05/08. [DOI] [PubMed] [Google Scholar]
- 2.Washington AE, Lipstein SH. The Patient-Centered Outcomes Research Institute--promoting better information, decisions, and health. N Engl J Med. 2011;365(15):e31. doi: 10.1056/NEJMp1109407. Epub 2011/10/14. [DOI] [PubMed] [Google Scholar]
- 3.Hernán MA, Robins JM. Using Big Data to Emulate a Target Trial When a Randomized Trial Is Not Available. Am J Epidemiol. 2016 doi: 10.1093/aje/kwv254. Epub 2016/03/20. [DOI] [PMC free article] [PubMed] [Google Scholar]
- 4.Dreyer NA. Making observational studies count: shaping the future of comparative effectiveness research. Epidemiology. 2011;22(3):295–7. doi: 10.1097/EDE.0b013e3182126569. Epub 2011/04/06. [DOI] [PubMed] [Google Scholar]
- 5.Danaei G, Garcia Rodriguez LA, Cantero OF, Logan R, Hernán MA. Observational data for comparative effectiveness research: An emulation of randomised trials of statins and primary prevention of coronary heart disease. Statistical methods in medical research. 2013;22(1):70–96. doi: 10.1177/0962280211403603. Epub 2011/10/22. [DOI] [PMC free article] [PubMed] [Google Scholar]
- 6.Hernán MA. The hazards of hazard ratios. Epidemiology. 2010;21(1):13–5. doi: 10.1097/EDE.0b013e3181c1ea43. Epub 2009/12/17. [DOI] [PMC free article] [PubMed] [Google Scholar]
- 7.Hernán MA, Robins JM. Observational studies analyzed like randomized trials, and vice versa. Boca Raton, FL: Chapman & Hall/CRC Press; 2015. [Google Scholar]
- 8.Thompson WA., Jr On the treatment of grouped observations in life studies. Biometrics. 1977;33(3):463–70. Epub 1977/09/01. [PubMed] [Google Scholar]
- 9.Robins JM, Hernán MA. Estimation of the causal effects of time-varying exposures. In: Fitzmaurice G, Davidian M, Verbeke G, Monenberghs G, editors. Longitudinal data analysis. Boca Raton: Chapman & Hall/CRC; 2009. pp. 553–99. [Google Scholar]
- 10.Efron B, Tibshirani R. Bootstrap Methods for Standard Errors, Confidence Intervals, and Other Measures of Statistical Accuracy. Statistical Science. 1986;1(1):54–75. [Google Scholar]
- 11.Danaei G, Rodriguez LA, Cantero OF, Hernán MA. Statins and Risk of Diabetes: An analysis of electronic medical records to evaluate possible bias due to differential survival. Diabetes Care. 2013;36(5):1236–40. doi: 10.2337/dc12-1756. Epub 2012/12/19. [DOI] [PMC free article] [PubMed] [Google Scholar]
- 12.Hernán MA. Counterpoint: epidemiology to guide decision-making: moving away from practice-free research. Am J Epidemiol. 2015;182(10):834–9. doi: 10.1093/aje/kwv215. Epub 2015/10/29. [DOI] [PMC free article] [PubMed] [Google Scholar]
- 13.Ray WA. Evaluating medication effects outside of clinical trials: new-user designs. Am J Epidemiol. 2003;158(9):915–20. doi: 10.1093/aje/kwg231. Epub 2003/10/31. [DOI] [PubMed] [Google Scholar]
- 14.Hernán MA, Sauer BC, Hernández-Díaz S, Platt R, Shrier I. Specifying a target trial prevents immortal time bias and other self-inflicted injuries in observational analyses. J Clin Epidemiol. 2016 doi: 10.1016/j.jclinepi.2016.04.014. Epub 2016/05/31. [DOI] [PMC free article] [PubMed] [Google Scholar]
- 15.Hernán MA, Robins JM. Estimating causal effects from epidemiological data. J Epidemiol Community Health. 2006;60(7):578–86. doi: 10.1136/jech.2004.029496. Epub 2006/06/23. [DOI] [PMC free article] [PubMed] [Google Scholar]
- 16.Hernán MA, Hernández-Díaz S. Beyond the intention-to-treat in comparative effectiveness research. Clin Trials. 2012;9(1):48–55. doi: 10.1177/1740774511420743. Epub 2011/09/29. [DOI] [PMC free article] [PubMed] [Google Scholar]
- 17.Danaei G, Tavakkoli M, Hernán MA. Bias in observational studies of prevalent users: lessons for comparative effectiveness research from a meta-analysis of statins. Am J Epidemiol. 2012;175(4):250–62. doi: 10.1093/aje/kwr301. Epub 2012/01/10. [DOI] [PMC free article] [PubMed] [Google Scholar]
- 18.Randomised trial of cholesterol lowering in 4444 patients with coronary heart disease: the Scandinavian Simvastatin Survival Study (4S) Lancet. 1994;344(8934):1383–9. Epub 1994/11/19. [PubMed] [Google Scholar]
- 19.Mills EJ, Wu P, Chong G, Ghement I, Singh S, Akl EA, et al. Efficacy and safety of statin treatment for cardiovascular disease: a network meta-analysis of 170 255 patients from 76 randomized trials. QJM. 2010 doi: 10.1093/qjmed/hcq165. Epub 2010/10/12. [DOI] [PubMed] [Google Scholar]
- 20.Young J, Xiao Y, Moodie EE, Abrahamowicz M, Klein MB, Bernasconi E, et al. Effect of Cumulating Exposure to Abacavir on the Risk of Cardiovascular Disease Events in Patients From the Swiss HIV Cohort Study. J Acquir Immune Defic Syndr. 2015;69(4):413–21. doi: 10.1097/QAI.0000000000000662. Epub 2015/05/02. [DOI] [PubMed] [Google Scholar]
- 21.Austin PC, Park-Wyllie LY, Juurlink DN. Using fractional polynomials to model the effect of cumulative duration of exposure on outcomes: applications to cohort and nested case-control designs. Pharmacoepidemiol Drug Saf. 2014;23(8):819–29. doi: 10.1002/pds.3607. Epub 2014/03/26. [DOI] [PMC free article] [PubMed] [Google Scholar]
- 22.Hernán MA, Robins JM. Per-Protocol Analyses of Pragmatic Trials. N Engl J Med. 2017;377(14):1391–8. doi: 10.1056/NEJMsm1605385. Epub 2017/10/05. [DOI] [PubMed] [Google Scholar]
- 23.Athyros VG, Papageorgiou AA, Mercouris BR, Athyrou VV, Symeonidis AN, Basayannis EO, et al. Treatment with atorvastatin to the National Cholesterol Educational Program goal versus 'usual' care in secondary coronary heart disease prevention. The GREek Atorvastatin and Coronary-heart-disease Evaluation (GREACE) study. Curr Med Res Opin. 2002;18(4):220–8. doi: 10.1185/030079902125000787. Epub 2002/08/31. [DOI] [PubMed] [Google Scholar]
- 24.Collins R, Reith C, Emberson J, Armitage J, Baigent C, Blackwell L, et al. Interpretation of the evidence for the efficacy and safety of statin therapy. Lancet. 2016 doi: 10.1016/S0140-6736(16)31357-5. Epub 2016/09/13. [DOI] [PubMed] [Google Scholar]
- 25.Cole SR, Hernán MA. Constructing inverse probability weights for marginal structural models. Am J Epidemiol. 2008;168(6):656–64. doi: 10.1093/aje/kwn164. Epub 2008/08/07. [DOI] [PMC free article] [PubMed] [Google Scholar]
Associated Data
This section collects any data citations, data availability statements, or supplementary materials included in this article.


