

Abstract
Hierarchical organization of macromolecules through self-assembly is a prominent feature in biological systems. Synthetic fabrication of such structures provides new materials with emergent functions. Here we report the fabrication of self-assembled superstructures through co-engineering of recombinant proteins and nanoparticles. These structures feature an unprecedented level of multi-layered hierarchical organization of the components: individual proteins and nanoparticles co-assemble to form discrete assemblies that collapse to form granules, which then further self-organize to generate superstructures of hundreds of nanometer size. The components within these superstructures are dynamic and spatially reorganize in response to environmental influences. The precise control over the molecular organization of building blocks imparted by this protein-nanoparticle co-engineering strategy provides a new strategy for creating hierarchical hybrid materials.
Keywords: Biomimetic self-assembly, hierarchical assembly, gold nanoparticle, protein engineering
Graphical abstract
Multi-layered hierarchical co-assembly between engineered proteins and gold nanoparticles
Complex self-assembled structures observed in Nature are formed through multiple levels of hierarchical organization.1 The components in these systems are spatially organized to acquire unique functions,2,3 evolving through dynamic reorganization during cellular processes.4 Building synthetic structures to mimic these complex dynamic assemblies is challenging.5,6 Recent studies have fabricated ordered discrete structures based on self-assembly of DNA,7 proteins,8,9 and proteins with DNA.10 These structures mirror the structural complexity of biological systems, however their architectures are ‘fixed’ in lattice arrays, and lack the dynamic behavior of bioassemblies. Synthetic systems including nanoparticles11-13 and polymers5,14,15 have likewise been used to build hierarchical assemblies, however fabrication of dynamically-organized self-assembled hierarchical structures remains elusive.
Nanoparticles and proteins serve as attractive complementary building blocks for fabricating ‘bricks and mortar’ hierarchical structures, allowing the incorporation of bio-functionality into nanostructures. These nanoassemblies include discrete lattices,16 superstructures,17 and corona-like co-assemblies.18 These co-assemblies were either built based on self-templating proteins such as viral capsid proteins,19 or relied on naturally existing complementary supramolecular interactions between nanomaterials and wild-type proteins, restricting these systems to a relatively narrow range of proteins.
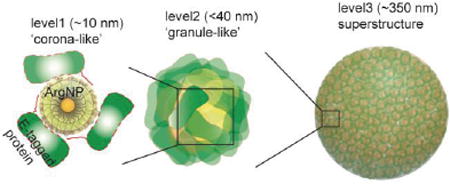
We report here a protein-nanoparticle co-engineering approach that provides programmed self-assembly of dynamic superstructures. These assemblies exhibit multiple layers of structural hierarchy, with an organizational complexity similar to that of membrane-free intracellular assemblies (Figure 1). Our initial co-engineered system uses a green fluorescent protein (GFP) bearing a genetically incorporated glutamic acid peptide chain (E-tags). This engineered protein self-assembles with 2 nm core gold nanoparticles carrying arginine-terminated ligands (ArgNP)20 through carboxylate–guanidinium interactions21 to generate hierarchical nanostructures guided by electrostatic self-assembly. This assembly process is quite general, as demonstrated through the use of multiple proteins (Figure 1e-g).
Figure 1. Hierarchical organization of engineered proteins and nanoparticles into complex superstructures.
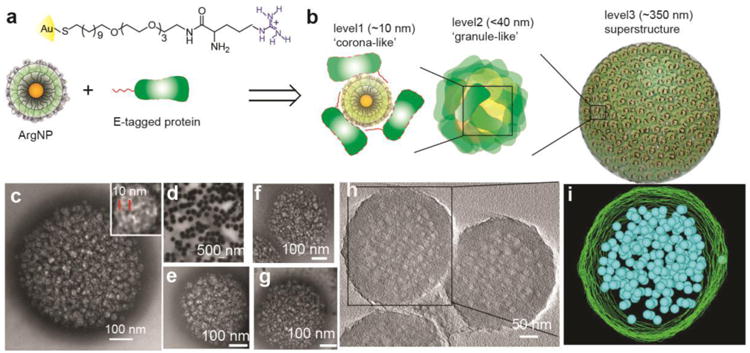
(a) Chemical structure of the arginine functionalized gold nanoparticles ArgNPs, and b, schematic representation of different layers of protein–nanoparticle hierarchical organizations observed in a superstructure. (c) high, and (d) low magnification transmission electron microscopy (TEM) images of the superstructures. Inset in c is TEM image of a single granule in a superstructure, where black and white patches represent ArgNPs and GFP-E10 respectively; red lines represent interparticle center-to-center distance. (e-g) Hierarchical organization of different proteins with ArgNPs: Histone 2A-E10 (e), Cre recombinase E10 (f), and single chain antibody fragment scFv(ErbB2)-E10 (g). h, A tilt-section of a tomogram (see Supplementary movie 1); and i, the 3D visualization of a reconstructed superstructure of GFP-E10:ArgNPs in (h), showing the surface (green) and the inner granules (blue) (also see Supplementary movie 2).
Results
Fabrication of hierarchically organized protein-nanoparticle superstructures
In natural systems, controlled multivalency plays an important role in driving self-assembly and in the organization of molecules into higher ordered structures.22 We provided analogous control over our self-assembly process by engineering GFP with a series of different lengths of E-tags (E0 to E20) at the C-terminus of the protein, a technique we previously to facilitate local interaction between engineered proteins and nanoparticles.32 We initially performed fluorescence titration experiments between GFP-En and ArgNPs at physiologically relevant pH values (PBS, pH 7.4) to find the appropriate GFP variants for effective and dynamic interactions with ArgNPs. As expected, due to its negative overall charge, GFP-E0 exhibits weak binding with ArgNPs, while binding increased as the length of E-tag was increased to E10 (Figure S2). GFP-E15 and GFP-E20 were bound poorly to the nanoparticles as compared to GFP-E10, presumably due to non-specific aggregate formation with the higher length of E-tags. We therefor chose GFP-E10 for studying the subsequent assembly formation (Figure S2).
Self-organized superstructures were generated by mixing GFP-E10 and ArgNPs at 3:1 (750:250 nM) molar ratio in PBS or in cell culture media (DMEM), and assembling at room temperature for 10 min, followed by a 30-min incubation at 37 °C. The resulting structures were inspected by electron microscopy and small angle X-ray scattering (SAXS) experiments. Individual nanoparticles (2-nm core diameter) and proteins (ca. 3 nm) co-assembled into large superstructures of ca. 250–350 nm diameter (Figure 1c and d). Transmission electron microscopy (TEM) studies at low magnification (Figure 1d) showed the formation of uniform superstructures, with higher magnification (Figure 1c) revealing smaller structures. Within the superstructures, three distinct layers of hierarchical organization of proteins and nanoparticles were observed. The first layer of hierarchical organization consisted particles surrounded by multiple proteins to produce ‘corona-like’ structures (Figure 1b) of ca. 10 nm in overall diameter (Figure 1c, inset). These corona-like structures further evolved to produce ‘granule-like’ structures (<40 nm diameter) that comprise the second layer of hierarchical organization. The average center-to-center particle distance in these granular superstructures is ∼10 nm, according to both TEM (Figure 1c inset) and SAXS measurements (Figure S4). These granular structures then assembled together to produce the final ∼250–350 nm diameter superstructures (Figure 1b—i, Supplementary movie 1 & 2). This assembly process is generalizable: E10 tagged proteins featuring different sizes and pI values of the native protein (Histone 2A, pI=10.9, MW=14.1 kDa; Cre recombinase, pI=9.6, MW=38.5 kDa; single chain antibody fragment scFv, pI=8.4, MW=32.3 kDa) all generated hierarchical structures essentially identical to those observed with GFP-E10 (pI=5.9, MW=27 kDa) (Figure 1e-g).
Detailed insight into the organized superstructures was obtained using EM tomography. Images of the 3D superstructures were obtained with capture angles from +60° to -60°. Figure S6 shows a 3D density map, showing the surface structure of the superstructure. The 3D visualization provided by the reconstructed tomograms showed the packed inner granules (Figure 1h—i, Supplementary movie 2).
Environmental ionic strength dependent superstructure evolution
We next investigated the mechanism of superstructure formation. Many environmental factors trigger self-organization/reorganization of building blocks in cellular compartments, including pH (e.g., actin polymerization)23 and ion gradient (e.g., endosomes, neuronal signaling).24 Our system is electrostatic in nature, and is strongly dependent on the concentration of electrolytes in the solution. At low salt concentration (Figure 2a, 5 and 10 mM) GFP-E10 and ArgNPs co-assembled to form extended ‘precursor’ clusters, however no superstructure formation was observed. With the increase in salt concentration, these granular precursors continued to evolve and the formation of larger superstructures started appearing at a salt concentration of 20 mM. Complete superstructure formation was observed at 50 mM salt, with no observable free GFP-E10:ArgNPs precursor clusters. The dynamics of the evolution of the assembly can be related to other recently reported assembly formation processes,25,26 in which ‘precursor’ clusters, but not individual proteins and particles, serve as the intermediate for the superstructure formation (Figure S3). While the morphology of the superstructures remained the same above 50 mM salt solutions, the size increased with increasing salt concentration of the solution (Figure 2a). An electrolyte-dependent-assembly evolution process was also supported by SAXS measurements (Figure 2b; Figure S4). With increasing ionic strength, a gradual increase in the peak intensity at 1/q ca. 0.06 Å was observed, corresponding to the interparticle center-to-center distance (dNP-NP), which resulted from assembly formation. The peak intensity reached saturation at 50 mM salt concentration, indicating complete superstructure formation, consistent with that observed by TEM measurements.
Figure 2. Superstructure evolution triggered by environmental ionic strength.
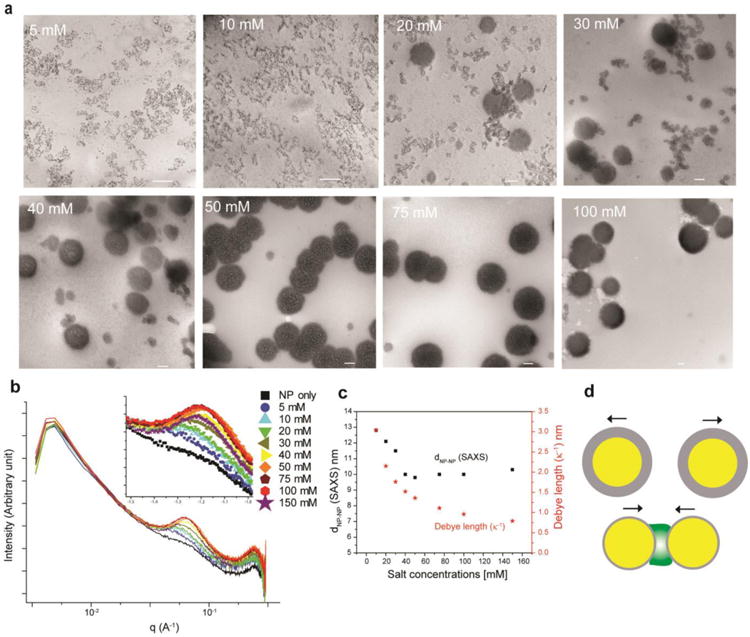
(a) TEM images of salt-induced superstructures between GFP-E10 and ArgNPs. Scale bar: 100 nm. (b) SAXS inspection of superstructure formation at various salt concentrations showing the gradual intensity enhancement and a shift in q value arising from superstructure formation. (c) Comparison of inter-particle distance (dNP-NP) of the assemblies with theoretical Debye length (κ-1) at different salt concentrations. (d) Physical principle governing superstructure formation. Yellow core and gray shell represent ArgNPs and the Debye screening layer respectively (top), whereas GFP-E10 is depicted in green (bottom).
The electrolyte dependence of GFP-E10:ArgNPs superstructure formation can be qualitatively rationalized by electrical double layer formation around GFP-E10:ArgNPs clusters (Figure S3, red boxes).16,27,28 The magnitude of the electrical double layer is dependent on Debye screening length (κ-1), where κ-1 is inversely related to the ionic strength of the solution (Methods). When ionic strength increases, κ-1 decreases; reducing the electrical double layer repulsion between GFP-E10:ArgNPs precursor clusters. At specific concentrations of salt, the double-layer repulsion becomes minimal, forcing the clusters to collapse to form a superstructure (Figure 2d; Supplementary discussion). The superstructure formation is further dictated by GFP-E10, as the polyvalency of the counterion is critical for the initial cluster formation (Figure S1d)29 (Supplementary notes); this behavior demonstrates the importance of co-engineering of nanoparticles and proteins for building these hierarchical superstructures.
SAXS experiments further provided evidence for the electrolyte dependence of GFP-E10:ArgNPs superstructure formation, as the reduction in κ-1 of ArgNPs correlated with increasing electrolyte concentration. As shown in Figure 2b (inset), with increasing ionic strength, the peak corresponding to dNP-NP shifted towards a higher q value, which is indicative of the reduction in κ-1 values of ArgNPs. It is noteworthy that higher q value signifies a decrease in the dNP-NP distance that is anticipated with the reduction of Debye screening length of the ArgNPs. We measured the dNP-NP from these SAXS peaks and compared with the theoretical κ-1 values as a function of salt concentration (Figure 2c; Figure S4). As ionic strength increased, dNP-NP dropped until it reached a saturation point at 50 mM salt concentration. On the contrary, theoretical κ-1 values continued to decrease beyond 50 mM salts; this discrepancy is presumably due to the steric “locking in” of the ArgNPs upon completion of superstructure formation (at 50 mM salt concentration). In the resulting assembly there is no further room for the particles to come closer, a factor not accounted for in theoretical calculations of κ-1. A slight increase in dNP-NP was observed beyond 50 mM salt concentration, which presumably arises from the molecular re-organization of the building blocks within the superstructure (Figure 3). Taken together, these experiments indicate that complementarity and multivalency between building blocks are essential, but not sufficient for the evolution of higher ordered complex assemblies, and that environmental triggers play a decisive role for such processes.
Figure 3. Dynamic reorganization of the superstructure components.
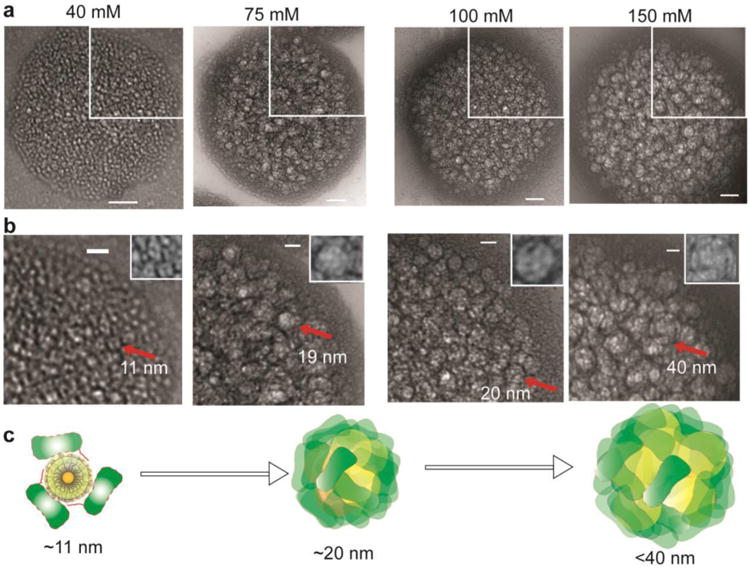
(a) High magnification TEM images of superstructures at different salt concentrations Scale bar: 50 nm. (b) A portion of each image from (a) was magnified. Scale bar: 20 nm. Individual nanoparticles (black) were surrounded by about three proteins (white) to form corona or granules as shown by red arrows. Inset showing enlarged corona (40 mM) or granules (75, 100, and 150 mM). (c) Schematics showing the molecular reorganization of the superstructure components as salt concentration increased. Yellow and green represent ArgNPs and GFP-E10, respectively.
Dynamic and spatial organization of the superstructure components
Electrolytes govern the dynamic and spatial reorganization of the building blocks in these superstructures. As ionic strength was raised beyond 40 mM salt, the components within the superstructures undergo organizational transformation. At 40 mM salt, GFP-E10 and ArgNPs assembled into corona-like structures within the superstructure; these structures represent lower level molecular organization (Figure 3a, 40 mM). The size of an individual corona structure is ca. 11 nm in diameter (Figure 3b, 40 mM, marked by a red arrow, and in the inset), which suggests a corona composition of one particle at the core surrounded by ∼3 proteins. As the salt concentration increased to 75 or 100 mM, multiple GFP-E10:ArgNPs coronas coalesced to form bigger granular structures of ∼20 nm in diameter. When salt concentration was increased to 150 mM, further condensation of GFP-E10:ArgNPs was observed, with the size of these granules increasing to ∼40 nm in diameter (Figure 3b—c at 150 mM). Further, the larger granules in the superstructure (formed at 150 mM salt) reversed to individual corona-particle assemblies at 40 mM salt concentration (Figure S7).
Conclusions
In summary, we have demonstrated that co-engineering of proteins and nanoparticles can be used to generate complex hierarchical assemblies with unprecedented structural and dynamic properties. The dynamic arrangement of the components within the superstructures is highly responsive to environmental stimuli. The ability to fabricate complex structures in this fashion presents new systems for studying emergent behavior, as well as pursuing pragmatic applications including therapeutic delivery,30 catalysis, and photosynthetic energy harvesting.31
Methods
Nanoparticle engineering
Arginine-functionalized gold nanoparticles (ArgNPs) were prepared according to our previous methods.20 Briefly, the arginine-functionalized thiol ligand was synthesized first (Scheme S1, a). Nanoparticles were subsequently prepared by conventional place-exchange reaction of 2-nm sized 1-pentanethiol-protected gold nanoparticles (Au-C5) with HS-C11-TEG-NH-Arginine (Compound 7) ligand (Scheme S1, b). The resultant ArgNPs were dissolved in distilled water, purified by dialysis, and characterized (Figure S1).
Engineering E-tagged proteins
Engineering of GFP-En (where n is the number of glutamic acids) and protein expression were done according to standard protocols. GFP gene was PCR-amplified and cloned into a bacterial expression vector (pQE80) with 6×His at the N-terminus. The following primers were used to amplify GFP gene:
Forward primer: ACGATGGATCCATGGTGAGCAAGGG
Reverse primers:
GFP-E0: GTGTAAGCTTTTACTTGTACAGCTC
GFP-E3: GTGTAAGCTTTTATTCTTCCTCCTTGTACAGCTC
GFP-E5: GTGTAAGCTTTTATTCCTCTTCTTCCTCCTTGTACAGCTC
GFP-E7: GTGTAAGCTTTTACTCCTCTTCCTCTTCTTCCTCCTTGTACAGCTC
GFP-E10: GTGTAAGCTTTTACTCTTCCTCCTCCTCTTCCTCTTCTTCCTCCTTGTACAGCT
GFP-E15: (GFP-E5 as template) GTGTAAGCTTTTACTCTTCCTCTTCTTCCTCTTCCTCCTCTTCTTCCTCTTCTTC
GFP-E20: (GFP-E15 as template) GTGTAAGCTTTTATTCCTCTTCTTCTTCCTCTTCCTCTTCTTCCTCTTC
Amplified products were digested with restriction enzymes BamHI and HindIII, ligated into pQE80 vector, and transformed into bacteria. Positive clones were identified by using DNA sequencing.
To produce recombinant proteins, plasmids carrying the GFP-En variants were transformed into E. coli BL21(DE3) strain. A transformed colony was picked to grow small cultures in 50 mL 2×YT (Yeast-Tryptone) media at 37 °C for overnight. The following day, 15 mL of grown culture was inoculated into one liter 2×YT media and allowed to grow at 37 °C until OD reached 0.6. At this point, the protein expression was induced by adding isopropyl-b-D-thiogalactopyranoside (IPTG; 1 mM final concentration) at 25 °C. After 16 hours of induction, the cells were harvested and the pellets were lysed by using 1% Triton X-100 and subsequent DNAse-I treatment. Proteins were purified from the lysed supernatant by using HisPur cobalt columns. The integrity and the purity of native protein were determined by using 12% SDS-PAGE gel. Notably, the insertion of E-tag did not affect the protein expression and purification , and the yield was equivalent to the expression of wild-type GFP.
E10-tagged Histone 2A, Cre recombinase, and single chain antibody fragment scFv (scFv-anti-ErbB2) was similarly cloned and expressed in E. coli BL21 Rosetta strain.
Fluorescence titration
Fluorescence titration experiments between nanoparticles and GFP-En were carried out as described previously.32 Briefly, the change of fluorescence intensity of GFP-En at 510 nm was measured with an excitation wavelength of 475 nm at various concentrations of nanoparticles from 0 to 400 nM on a Molecular Devices SpectraMax M3 microplate reader (at 25 °C). Quenching of fluorescence intensity arising from 100 nM GFP-En was observed with increasing nanoparticle concentration. Nonlinear least-squares curve fitting analysis was carried out to estimate the binding constant (KS) and association stoichiometry (n, [GFP-En]/[ArgNP]) by using a one-site binding model.33
Superstructure fabrication
GFP-En:ArgNPs superstructures were prepared through a simple mixing procedure. ArgNPs (50 μM stock in 5 mM PB, pH 7.4) were added to 100 μL of 1×PBS, followed by adding GFP-Es (50 μM stock in 5 mM PB, pH 7.4) at appropriate molar ratio [usually at 1:3 ratio (ArgNP, 250 nM)/(GFP-En, 750 nM) for most of the applications]. The complex was incubated at room temperature for 10 min. DMEM media (low glucose) or 1×PBS (or pure NaCl solution) was added to the complex to make the final volume up to 500 μL. For the salt concentration-dependent assembly studies proteins and NPs were initially mixed in 5 mM PB, then the salt concentration was gradually adjusted by adding required salt solution. The superstructures were then incubated at 37 °C for 30 min for TEM, and SAXS studies.
Superstructures of other proteins were similarly fabricated using following molar ratios: H2A-E10:ArgNPs (3:1); Cre recombinase-E10:ArgNPs (1:2); and scFv-E10:ArgNPs (1:2).
Transmission electron microscopy (TEM)
10 μL of the superstructure solution was drop-cast on to a TEM grid (carbon film- 400 mesh copper, electron microscopy sciences) and the sample allowed to dry at room temperature overnight. Superstructures were inspected by using JEOL 2000FX TEM.
TEM Tomography, reconstruction of tomographic tilt series, and 3D modeling
TEM Tomography was performed using JEOL 2200FX TEM. Samples were prepared similarly as for regular TEM in grids (carbon film—150 mesh copper). Tilt series were acquired from -60° to +60°. Reconstructed tomograms were generated using IMOD/eTomo interface acquisition systems. For 3D visualization, reconstructed tomograms were further segmented and modelled using 3dmod. The 3D density map of the corresponding tomograms were generated using UCSF Chimera.34
Small angle X-ray scattering (SAXS)
GFP-E10:ArgNPs superstructure samples for SAXS experiments were prepared as described above, with slight modifications. Briefly, ArgNPs (50 μM stock in 5 mM PB, pH 7.4) were added to 20 μL of PB such that the final concentration of nanoparticles became 2 μM in 200 μL volume. Then GFP-E10 (50 μM stock in 5 mM PB, pH 7.4) was added into the nanoparticle solution (final protein concentration = 6 μM). Superstructures were allowed to form at room temperature for 10 min; then for 30 min after making up the volume to 200 μL with appropriate buffer with necessary salt concentration. 75 μL of each sample was drop-cast on a kapton film and allowed to dry at room temperature. Alternatively, solution samples were prepared by placing 100–200 μL of the superstructure solution into SAXS sample holder between two mica sheets. Samples were analyzed by using Ganesha SAXS-LAB (Northampton, Massachusetts).
Calculation of Debye screening length (κ-1)
κ−1 was calculated using following equation.16
where,
κ−1= Debye screening length
ε0= Vacuum permittivity
εr= Dielectric constant of solvent (water)
kb= Boltzmann constant
T= Absolute temperature
e= Elementary charge
ci= Concentration of electrolyte ions (NaCl)
zi= Valencies of electrolyte ions
Supplementary Material
Acknowledgments
This research was supported by the NIH (GM077173) and the NSF (CHE-1307021). We are grateful to Nicholas A. Kotov of University of Michigan for his comments on our manuscript.
Footnotes
Author contributions: R.M. conceived the idea; R.M. designed the experiments; G.Y.T. synthesized and characterized the particle; R.M. performed all the experiments and data analysis with help from L.-S.W. (SAXS experiments), M.R. (protein engineering), and T.R. (fluorescence titration); R.M. and V.M.R. wrote the manuscript.
Competing financial interests: The authors declare no competing financial interests.
Associated Content: Supporting Information: The Supporting Information is available free of charge on the ACS Publications website at http://pubs.acs.org.
References
- 1.Karsenti E. Self-Organization in Cell Biology: A Brief History. Nat Rev Mol Cell Biol. 2008;9:255–262. doi: 10.1038/nrm2357. [DOI] [PubMed] [Google Scholar]
- 2.Whitesides GM, Grzybowski B. Self-Assembly at all Scales. Science. 2002;295:2418–2421. doi: 10.1126/science.1070821. [DOI] [PubMed] [Google Scholar]
- 3.Chung WJ, Oh JW, Kwak K, Lee BY, Meyer J, Wang E, Hexemer A, Lee SW. Biomimetic Self-Templating Supramolecular Structures. Nature. 2011;478:364–368. doi: 10.1038/nature10513. [DOI] [PubMed] [Google Scholar]
- 4.Campbell NA, Reece JB. Biology. 6th. Benjamin Cummings; 2002. [Google Scholar]
- 5.Gröschel AH, Walther A, Löbling TI, Schacher FH, Schmalz H, Müller AH. Guided Hierarchical Co-Assembly of Soft Patchy Nanoparticles. Nature. 2013;503:247–251. doi: 10.1038/nature12610. [DOI] [PubMed] [Google Scholar]
- 6.Keber FC, Loiseau E, Sanchez T, DeCamp SJ, Giomi L, Bowick MJ, Marchetti MC, Dogic Z, Bausch AR. Topology and Dynamics of Active Nematic Vesicles. Science. 2014;345:1135–1139. doi: 10.1126/science.1254784. [DOI] [PMC free article] [PubMed] [Google Scholar]
- 7.Macfarlane RJ, Lee B, Jones MR, Harris N, Schatz GC, Mirkin CA. Nanoparticle Superlattice Engineering with DNA. Science. 2011;334:204–208. doi: 10.1126/science.1210493. [DOI] [PubMed] [Google Scholar]
- 8.King NP, Bale JB, Sheffler W, McNamara DE, Gonen S, Gonen T, Yeates TO, Baker D. Accurate Design of Co-Assembling Multi-Component Protein Nanomaterials. Nature. 2014;510:103–108. doi: 10.1038/nature13404. [DOI] [PMC free article] [PubMed] [Google Scholar]
- 9.Gonen S, DiMaio F, Gonen T, Baker D. Design of Ordered Two-Dimensional Arrays Mediated by Noncovalent Protein-Protein Interfaces. Science. 2015;348:1365–1368. doi: 10.1126/science.aaa9897. [DOI] [PubMed] [Google Scholar]
- 10.Mou Y, Yu JY, Wannier TM, Guo CL, Mayo SL. Computational Design of Co-Assembling Protein-DNA Nanowires. Nature. 2015;525:230–233. doi: 10.1038/nature14874. [DOI] [PubMed] [Google Scholar]
- 11.Boal AK, Ilhan F, De Rouchey JE, Thurn-Albrecht T, Russell TP, Rotello VM. Self-Assembly of Nanoparticles into Structured Spherical and Network Aggregates. Nature. 2000;404:746–748. doi: 10.1038/35008037. [DOI] [PubMed] [Google Scholar]
- 12.Erb RM, Son HS, Samanta B, Rotello VM, Yellen BB. Magnetic Assembly of Colloidal Superstructures with Multipole Symmetry. Nature. 2009;457:999–1002. doi: 10.1038/nature07766. [DOI] [PubMed] [Google Scholar]
- 13.Singh G, Chan H, Baskin A, Gelman E, Repnin N, Král P, Klajn R. Self-Assembly of Magnetite Nanocubes into Helical Superstructures. Science. 2014;345:1149–1153. doi: 10.1126/science.1254132. [DOI] [PubMed] [Google Scholar]
- 14.Qiu H, Hudson ZM, Winnik MA, Manners I. Multidimensional Hierarchical Self-Assembly of Amphiphilic Cylindrical Block Comicelles. Science. 2015;347:1329–1332. doi: 10.1126/science.1261816. [DOI] [PubMed] [Google Scholar]
- 15.Tan KW, Jung B, Werner JG, Rhoades ER, Thompson MO, Wiesner U. Transient Laser Heating Induced Hierarchical Porous Structures from Block Copolymer-Directed Self-Assembly. Science. 2015;349:54–58. doi: 10.1126/science.aab0492. [DOI] [PubMed] [Google Scholar]
- 16.Kostiainen MA, Hiekkataipale P, Laiho A, Lemieux V, Seitsonen J, Ruokolainen J, Ceci P. Electrostatic Assembly of Binary Nanoparticle Superlattices Using Protein Cages. Nat Nanotechnol. 2013;8:52–56. doi: 10.1038/nnano.2012.220. [DOI] [PubMed] [Google Scholar]
- 17.Park JI, Nguyen TD, de Queirós Silveira G, Bahng JH, Srivastava S, Zhao G, Sun K, Zhang P, Glotzer SC, Kotov NA. Terminal Supraparticle Assemblies from Similarly Charged Protein Molecules and Nanoparticles. Nat Commun. 2014;5:3593. doi: 10.1038/ncomms4593. [DOI] [PMC free article] [PubMed] [Google Scholar]
- 18.Bayraktar H, You CC, Rotello VM, Knapp MJ. Facial Control of Nanoparticle Binding to Cytochrome C. J Am Chem Soc. 2007;129:2732–2733. doi: 10.1021/ja067497i. [DOI] [PubMed] [Google Scholar]
- 19.Douglas T, Young M. Viruses: Making Friends with Old Foes. Science. 2006;312:873–875. doi: 10.1126/science.1123223. [DOI] [PubMed] [Google Scholar]
- 20.Yang XC, Samanta B, Agasti SS, Jeong Y, Zhu ZJ, Rana S, Miranda OR, Rotello VM. Drug Delivery Using Nanoparticle-Stabilized Nanocapsules. Angew Chem Int Ed. 2011;50:477–481. doi: 10.1002/anie.201005662. [DOI] [PMC free article] [PubMed] [Google Scholar]
- 21.Wiskur SL, Lavigne JJ, Metzger A, Tobey SL, Lynch V, Anslyn EV. Thermodynamic Analysis of Receptors Based on Guanidinium/boronic Acid Groups for the Complexation of Carboxylates, Alpha-Hydroxycarboxylates, and Diols: Driving Force for Binding and Cooperativity. Chemistry. 2004;10:3792–804. doi: 10.1002/chem.200305737. [DOI] [PubMed] [Google Scholar]
- 22.Li P, Banjade S, Cheng HC, Kim S, Chen B, Guo L, Llaguno M, Hollingsworth JV, King DS, Banani SF, Russo PS, Jiang QX, Nixon BT, Rosen MK. Phase Transitions in the Assembly of Multivalent Signalling Proteins. Nature. 2012;483:336–340. doi: 10.1038/nature10879. [DOI] [PMC free article] [PubMed] [Google Scholar]
- 23.Wang F, Sampogna RV, Ware BR. pH Dependence of Actin Self-Assembly. Biophys J. 1989;55:293–298. doi: 10.1016/S0006-3495(89)82804-8. [DOI] [PMC free article] [PubMed] [Google Scholar]
- 24.Scott CC, Gruenberg J. Ion Flux and the Function of Endosomes and Lysosomes: pH is Just the Start: The Flux of Ions Across Endosomal Membranes Influences Endosome Function not only Through Regulation of the Luminal pH. Bioessays. 2011;33:103–110. doi: 10.1002/bies.201000108. [DOI] [PubMed] [Google Scholar]
- 25.Lupulescu AI, Rimer JD. In Situ Imaging of Silicalite-1 Surface Growth Reveals the Mechanism of Crystallization. Science. 2014;344:729–732. doi: 10.1126/science.1250984. [DOI] [PubMed] [Google Scholar]
- 26.Van Driessche AE, Benning LG, Rodriguez-Blanco JD, Ossorio M, Bots P, García-Ruiz JM. The Role and Implications of Bassanite as a Stable Precursor Phase to Gypsum Precipitation. Science. 2012;336:69–72. doi: 10.1126/science.1215648. [DOI] [PubMed] [Google Scholar]
- 27.Kalsin AM, Fialkowski M, Paszewski M, Smoukov SK, Bishop KJ, Grzybowski BA. Electrostatic Self-assembly of Binary Nanoparticle Crystals with a Diamond-Like Lattice. Science. 2006;312:420–424. doi: 10.1126/science.1125124. [DOI] [PubMed] [Google Scholar]
- 28.Batista CA, Larson RG, Kotov NA. Nonadditivity of Nanoparticle Interactions. Science. 2015;350:1242477. doi: 10.1126/science.1242477. [DOI] [PubMed] [Google Scholar]
- 29.Lyklema J. Coagulation by Multivalent Counterions and the Schulze-Hardy Rule. J Colloid Interface Sci. 2013;392:102–104. doi: 10.1016/j.jcis.2012.09.066. [DOI] [PubMed] [Google Scholar]
- 30.Mout R, Ray M, Tonga GY, Lee YW, Tay T, Sasaki K, Rotello VM. ACS Nano. submitted for publication; Efficient Gene Editing through Direct Cytosolic Delivery of CRISPR/Cas9-Ribonucleoprotein. [DOI] [PMC free article] [PubMed] [Google Scholar]
- 31.Mout R, Moyano DF, Rana S, Rotello VM. Surface Functionalization of Nanoparticles for Nanomedicine. Chem Soc Rev. 2012;41:2539–2544. doi: 10.1039/c2cs15294k. [DOI] [PMC free article] [PubMed] [Google Scholar]
- 32.Mout R, Tonga GY, Ray M, Moyano DF, Xing Y, Rotello VM. Environmentally Responsive Histidine-Carboxylate Zipper Formation Between Proteins and Nanoparticles. Nanoscale. 2014;6:8873–8877. doi: 10.1039/c4nr02097a. [DOI] [PMC free article] [PubMed] [Google Scholar]
- 33.You CC, De M, Han G, Rotello VM. Tunable Inhibition and Denaturation of Alpha-Chymotrypsin with Amino Acid-Functionalized Gold Nanoparticles. J Am Chem Soc. 2005;127:12873. doi: 10.1021/ja0512881. [DOI] [PubMed] [Google Scholar]
- 34.Pettersen EF, Goddard TD, Huang CC, Couch GS, Greenblatt DM, Meng EC, Ferrin TE. UCSF Chimera—a Visualization System for Exploratory Research and Analysis. J Comput Chem. 2004;25:1605–1612. doi: 10.1002/jcc.20084. [DOI] [PubMed] [Google Scholar]
Associated Data
This section collects any data citations, data availability statements, or supplementary materials included in this article.