

Abstract
Abuse and addiction to prescription opioids such as oxycodone (a short-acting Mu opioid receptor (MOP-r) agonist) in adolescence is a pressing public health issue. We have previously shown differences in oxycodone self-administration behaviors between adolescent and adult C57BL/6J mice and expression of striatal neurotransmitter receptor genes, in areas involved in reward. In this study, we aimed to determine whether oxycodone self-administration differentially affects genes regulating synaptic plasticity in the hippocampus of adolescent compared to adult mice, since the hippocampus may be involved in learning aspects associated with chronic drug self administration. Hippocampus was isolated for mRNA analysis from mice that had self administered oxycodone (0.25 mg/kg/infusion) 2 h/day for 14 consecutive days or from yoked saline controls. Gene expression was analyzed with real-time polymerase chain reaction (PCR) using a commercially available “synaptic plasticity” PCR array containing 84 genes. We found that adolescent and adult control mice significantly differed in the expression of several genes in the absence of oxycodone exposure, including those coding for mitogen-activated protein kinase, calcium/calmodulin-dependent protein kinase II gamma subunit, glutamate receptor, ionotropic AMPA2 and metabotropic 5. Chronic oxycodone self administration increased proviral integration site 1 (Pim1) and thymoma viral proto-oncogene 1 mRNA levels compared to controls in both age groups. Both Pim1 and cadherin 2 mRNAs showed a significant combined effect of Drug Condition and Age × Drug Condition. Furthermore, the mRNA levels of both cadherin 2 and cAMP response element modulators showed an experiment-wise significant difference between oxycodone and saline control in adult but not in adolescent mice. Overall, this study demonstrates for the first time that chronic oxycodone self-administration differentially alters synaptic plasticity gene expression in the hippocampus of adolescent and adult mice.
Keywords: oxycodone self-administration, hippocampus, synaptic plasticity, gene expression, adult, adolescent
INTRODUCTION
Prescription opioid abuse poses a significant public health issue in the United States (Zosel et al., 2013). This problem has escalated over the past two decades, especially among adolescents (Compton and Volkow, 2006; Johnston et al., 2006; Johnston, 2009), of whom thousands are hospitalized every year as a result of non-medical use of prescription opioids (Zosel et al., 2013). This issue is particularly troublesome because little is known about how the rapidly changing adolescent brain is affected by exposure to prescription opioids (Compton and Volkow, 2006). As a result of the high degree of neuroplasticity during adolescence (Carpenter-Hyland and Chandler, 2007), the neurobiological alterations that adolescents experience in response to prescription opioids may be mechanistically different, or may persist into adulthood, thus conferring on them a greater vulnerability to opioid addiction upon subsequent abuse.
As drugs of abuse have been shown to engage the molecular mechanisms of learning and memory by affecting synaptic plasticity (Berke and Hyman, 2000; Kauer and Malenka, 2007), understanding the effects of addictive drugs on brain regions involved in learning and memory, such as the hippocampus (Billa et al., 2010) is crucial. The hippocampus has been shown to be integral to the storage, consolidation, and retrieval of declarative, spatial, and associative long-term memory (Hernandez-Rabaza et al., 2007), with long-term potentiation (LTP) and long-term depression (LTD) as representative measures of these processes (Caruana et al., 2012). Due to its role in learning and memory and through its efferent and afferent neural connections with the reward system (Kenney and Gould, 2008; Garcia-Fuster et al., 2011), the hippocampus is important to the response to addictive drugs. In particular, the hippocampus has been shown to be involved in context-drug associations (Kenney and Gould, 2008), reward-related response (Bao et al., 2007; Hernandez-Rabaza et al., 2007), as well as drug craving (Volkow, 2004) and seeking behavior (Vorel et al., 2001; Belujon and Grace, 2011), especially in the context of reinstatement and relapse to drugs of abuse (Robbins and Everitt, 2002; Hernandez-Rabaza et al., 2007; Belujon and Grace, 2011). Furthermore, due to its role in modulating the hypothalamic–pituitary-adrenal (HPA) axis, the hippocampus plays a key role in stress-induced drug-seeking behavior (Garcia-Fuster et al., 2011).
There have been studies showing that opiates, morphine in particular, alter gene expression in several brain regions in adult rodents (Wang et al., 1999; Nestler, 2001; Rodriguez Parkitna et al., 2004; Korostynski et al., 2006; Hassan et al., 2010). One such study, which involved morphine-induced conditioned place preference, showed changes in the expression of genes in the hippocampus involved in vesicular transport, neurotransmitter release, and receptor trafficking (Marie-Claire et al., 2007). However, there are few studies detailing the effects of prescription opioids on changes in gene expression in the adolescent brain (Ellgren et al., 2007). Furthermore, much of the research on the effects of drugs of abuse on the adolescent hippocampus has focused on nicotine, alcohol, and cannabis. For example, one study demonstrated that adolescent rats given alcohol showed more hippocampal changes in protein expression relative to adolescent controls compared to adult rats given alcohol (Hargreaves et al., 2009).
We recently reported that adolescent mice self-administered significantly less oxycodone than adult mice (in the same mice described in the study presented here) (Mayer-Blackwell et al., 2014). We hypothesized that there were differential neurobiological alterations in brain regions associated with reward between adolescent and adult mice as a consequence of oxycodone self-administration. In this study, we examined this hypothesis by measuring the expression of genes involved in synaptic plasticity in the hippocampus. This study is in agreement with our previous finding that adolescent mice that self-administered oxycodone experienced different changes in gene expression of neurotransmitter receptors in the dorsal striatum relative to controls than did adult mice that self-administered oxycodone (Mayer-Blackwell et al., 2014).
EXPERIMENTAL PROCEDURES
Subjects
Male adolescent and adult (4 or 11 weeks old on arrival, respectively) C57BL/6J mice (Jackson Laboratory, Bar Harbor, ME, USA) were housed in groups up to five with free access to food and water in a light-(12:12-h light/dark cycle, light on at 7:00 pm and off at 7:00 am) and temperature-(25 °C) controlled room. Animal care and experimental procedures were conducted according to the Guide for the Care and Use of Laboratory Animals (Institute of Laboratory Animal Resources Commission on Life Sciences 1996). The experimental protocols used were approved by the Institutional Animal Care and Use Committee of The Rockefeller University.
Self-administration procedure
Catheter implantation
Following acclimation for 7 days, the mice were anesthetized with a combination of xylazine (8.0 mg/kg i.p.) and ketamine (80 mg/kg i.p.). After shaving and application of a 70% alcohol and iodine preparatory solution, incisions were made in the midscapular region and anteromedial to the foreleg. A catheter of approximately 6 cm in length (ID: 0.31 mm, OD: 0.64 mm) (Helix Medical, Inc., Carpinteria, CA, USA) was passed subcutaneously from the dorsal to the ventral incision. A 22-gauge needle was inserted into the jugular vein to guide the catheter into the vein. The catheter was tied to the vein with surgical silk. Physiological saline was then flushed through the catheter to avoid clotting and the catheter then capped with a stopper. Antibiotic ointment was applied to the catheter exit wounds on the animal’s back and forearm. Mice were individually housed after the surgery and were allowed 4 days of recovery (due to the limited period of adolescence in the mouse (Adriani and Laviola, 2004; Spear, 2000) before being placed in operant test chambers for the self-administration procedure.
Operant conditioning chambers
The self-administration chamber, ENV-307W (21.6 cm × 17.8 cm × 12.7 cm, Med. Associates, St. Albans, VT, USA), was located inside a larger sound attenuation chamber (Med. Associates). Each chamber contained a wall with two small holes (0.9-cm diameter, 4.2 cm apart, 1.5 cm from the floor of the chamber). One hole was defined as active, the other was inactive. When the photocell in the active hole was triggered by a nose-poke, an infusion pump (Med. Associates) delivered an oxycodone infusion of 20 μl/3 s from a 5-ml syringe. The syringe was connected by a swivel via Tygon tubing. The infusion pump and syringe were outside the chamber. During infusion, a cue light above the active hole was illuminated. Each injection was followed by a 20-s “time-out” period during which poking responses were recorded but had no programed consequences. All responses at the inactive hole were also recorded. Mice were tested during the dark phase of the diurnal cycle (all experiments were performed between 8:00 am and 12:00 pm).
Oxycodone self-administration
A 2-h self-administration session was conducted daily. Mice were weighed and heparinized saline solution (0.02 ml of 30 IU/ml) was used daily to flush the catheter to maintain patency. During self-administration sessions, mice in the oxycodone (Sigma, St. Louis, MO, USA) groups were placed in the self-administration chamber and a nose-poke through the active hole led to an infusion of oxycodone (0.25 mg/kg/infusion) under an FR1 schedule for 14 days. Drug volume was controlled by a computer to follow daily changes in body weight of individual animals. Mice in the control groups received yoked saline infusions during all sessions (saline was infused in the control mouse whenever the oxycodone mouse self-administered oxycodone). At the end of the experiment, only data from mice that passed a catheter patency test (defined as loss of muscle tone within a few seconds after administration of a short-acting anesthetic) with injection of 30 μl of ketamine (5 mg/ml) (Fort Dodge, IA) were included in the analysis of data. See also Mayer-Blackwell et al. (2014).
RNA extraction
Mice were sacrificed within 1 h after the last self-administration session by decapitation after brief exposure to CO2; the whole hippocampus from each mouse was dissected from the brain and homogenized in Qiazol (Qiagen, Valencia, CA, USA). Total RNA was isolated from homogenates of the hippocampus using the miRNeasy kit (Qiagen, Valencia, CA, USA). The quality and quantity of RNA from each sample was determined using the Agilent 2100 bioanalyzer. Genomic DNA was removed from the isolated total RNA using RT2 HT First Strand Kit (Qiagen, Valencia, CA, USA). Complementary DNA was then synthesized from 500 ng of total RNA with the same kit.
Mouse synaptic plasticity RT2-Profiler™ polymerase chain reaction (PCR) array
The mouse synaptic plasticity RT2 Profiler™ PCR array (PAMM-126Z, Qiagen) profiles the expression of 84 genes involved in synaptic plasticity and five housekeeping genes (glyceraldehyde 3-phosphate dehydrogenase, Gapdh; hypoxanthine guanine phosphoribosyl transferase 1, Hprt-1; Heat shock protein 90 alpha (cytosolic), class B member 1, Hsp90ab1 and β-glucuronidase, Gusb; β-actin, Actb) by real-time PCR using the SYBR Green detection method. The generated cDNA was diluted with an appropriate volume of instrument-specific reagent (2× SuperArray RT2 Real-Time™ SYBR Green PCR Master Mix (PA-012) and ultra pure water) and 10 μl of this reaction mix was added to each well of the PCR array. The real-time PCR reaction was performed in an ABI Prism 7900 HT Sequence Detection System (Applied Biosystems, Foster City, CA, USA), applying the following program: 2 min at 50 °C, 10 min at 95 °C and 40 cycles of 15 s at 95 °C and 1 min at 60 °C. The ABI Prism 7900 HT Sequence Detection System was used to calculate the Ct value for each well. Data were normalized to the mean of the five housekeeping genes (none of which showed differences between oxycodone and yoked saline controls) and analyzed by the comparative Ct-method (2-ΔCT). The complete list of genes assayed on the array is shown in Table 6 and can also be found at the manufacturer’s website. (http://www.sabioscience.com/rt_pcr_product/HTML/PAMM-126Z-4.html).
Table 6.
Symbol and description of the 84 synaptic plasticity genes in the array used in the current study
| Position | Symbol | Description |
|---|---|---|
| A01 | Adam10 | A disintegrin and metallopeptidase domain 10 |
| A02 | Adcy1 | Adenylate cyclase 1 |
| A03 | Adcy8 | Adenylate cyclase 8 |
| A04 | Akt1 | Thymoma viral proto-oncogene 1 |
| A05 | Arc | Activity regulated cytoskeletal-associated protein |
| A06 | Bdnf | Brain derived neurotrophic factor |
| A07 | Camk2a | Calcium/calmodulin-dependent protein kinase II alpha |
| A08 | Camk2g | Calcium/calmodulin-dependent protein kinase II gamma |
| A09 | Cdh2 | Cadherin 2 |
| A10 | Cebpb | CCAAT/enhancer binding protein (C/EBP), beta |
| A11 | Cebpd | CCAAT/enhancer binding protein (C/EBP), delta |
| A12 | Cnr1 | Cannabinoid receptor 1 (brain) |
| B01 | Creb1 | CAMP responsive element binding protein 1 |
| B02 | Crem | CAMP responsive element modulator |
| B03 | Dlg4 | Disks, large homolog 4 (Drosophila) |
| B04 | Egr1 | Early growth response 1 |
| B05 | Egr2 | Early growth response 2 |
| B06 | Egr3 | Early growth response 3 |
| B07 | Egr4 | Early growth response 4 |
| B08 | Ephb2 | Eph receptor B2 |
| B09 | Fos | FBJ osteosarcoma oncogene |
| B10 | Gabra5 | Gamma-aminobutyric acid (GABA) A receptor, subunit alpha 5 |
| B11 | Gnai1 | Guanine nucleotide binding protein (G protein), alpha inhibiting 1 |
| B12 | Gria1 | Glutamate receptor, ionotropic, AMPA1 (alpha 1) |
| C01 | Gria2 | Glutamate receptor, ionotropic, AMPA2 (alpha 2) |
| C02 | Gria3 | Glutamate receptor, ionotropic, AMPA3 (alpha 3) |
| C03 | Gria4 | Glutamate receptor, ionotropic, AMPA4 (alpha 4) |
| C04 | Grin1 | Glutamate receptor, ionotropic, NMDA1 (zeta 1) |
| C05 | Grin2a | Glutamate receptor, ionotropic, NMDA2A (epsilon 1) |
| C06 | Grin2b | Glutamate receptor, ionotropic, NMDA2B (epsilon 2) |
| C07 | Grin2c | Glutamate receptor, ionotropic, NMDA2C (epsilon 3) |
| C08 | Grin2d | Glutamate receptor, ionotropic, NMDA2D (epsilon 4) |
| C09 | Grip1 | Glutamate receptor interacting protein 1 |
| C10 | Grm1 | Glutamate receptor, metabotropic 1 |
| C11 | Grm2 | Glutamate receptor, metabotropic 2 |
| C12 | Grm3 | Glutamate receptor, metabotropic 3 |
| D01 | Grm4 | Glutamate receptor, metabotropic 4 |
| D02 | Grm5 | Glutamate receptor, metabotropic 5 |
| D03 | Grm7 | Glutamate receptor, metabotropic 7 |
| D04 | Grm8 | Glutamate receptor, metabotropic 8 |
| D05 | Homer1 | Homer homolog 1 (Drosophila) |
| D06 | Igf1 | Insulin-like growth factor 1 |
| D07 | Inhba | Inhibin beta-A |
| D08 | Jun | Jun oncogene |
| D09 | Junb | Jun-B oncogene |
| D10 | Kif17 | Kinesin family member 17 |
| D11 | Klf10 | Kruppel-like factor 10 |
| D12 | Mapk1 | Mitogen-activated protein kinase 1 |
| E01 | Mmp9 | Matrix metallopeptidase 9 |
| E02 | Ncam1 | Neural cell adhesion molecule 1 |
| E03 | Nfkb1 | Nuclear factor of kappa light polypeptide gene enhancer in B-cells 1, p105 |
| E04 | Nfkbib | Nuclear factor of kappa light polypeptide gene enhancer in B-cells inhibitor, beta |
| E05 | Ngf | Nerve growth factor |
| E06 | Ngfr | Nerve growth factor receptor (TNFR superfamily, member 16) |
| E07 | Nos1 | Nitric oxide synthase 1, neuronal |
| E08 | Nptx2 | Neuronal pentraxin 2 |
| E09 | Nr4a1 | Nuclear receptor subfamily 4, group A, member 1 |
| E10 | Ntf3 | Neurotrophin 3 |
| E11 | Ntf5 | Neurotrophin 5 |
| E12 | Ntrk2 | Neurotrophic tyrosine kinase, receptor, type 2 |
| F01 | Pcdh8 | Protocadherin 8 |
| F02 | Pick1 | Protein interacting with C kinase 1 |
| F03 | Pim1 | Proviral integration site 1 |
| F04 | Plat | Plasminogen activator, tissue |
| F05 | Plcg1 | Phospholipase C, gamma 1 |
| F06 | Ppp1ca | Protein phosphatase 1, catalytic subunit, alpha isoform |
| F07 | Ppp1cc | Protein phosphatase 1, catalytic subunit, gamma isoform |
| F08 | Ppp1r14a | Protein phosphatase 1, regulatory (inhibitor) subunit 14A |
| F09 | Ppp2ca | Protein phosphatase 2 (formerly 2A), catalytic subunit, alpha isoform |
| F10 | Ppp3ca | Protein phosphatase 3, catalytic subunit, alpha isoform |
| F11 | Prkca | Protein kinase C, alpha |
| F12 | Prkcc | Protein kinase C, gamma |
| G01 | Prkg1 | Protein kinase, cGMP-dependent, type I |
| G02 | Rab3a | RAB3A, member RAS oncogene family |
| G03 | Rela | V-rel reticuloendotheliosis viral oncogene homolog A (avian) |
| G04 | Reln | Reelin |
| G05 | Rgs2 | Regulator of G-protein signaling 2 |
| G06 | Rheb | Ras homolog enriched in brain |
| G07 | Sirt1 | Sirtuin 1 (silent mating type information regulation 2, homolog) 1 (S. cerevisiae) |
| G08 | Srf | Serum response factor |
| G09 | Synpo | Synaptopodin |
| G10 | Timp1 | Tissue inhibitor of metalloproteinase 1 |
| G11 | Tnf | Tumor necrosis factor |
| G12 | Ywhaq | Tyrosine 3-monooxygenase/tryptophan 5-monooxygenase activation protein, theta polypeptide |
Statistical analysis
Differences in expression of genes were analyzed by a two-way analysis of variance (Age × Drug Condition). “Age” would indicate a difference of mean measurements between adolescents and adults; “Drug Condition” would indicate a difference between cases and controls; and “Age × Drug Condition” would indicate a difference in the Age effect of the two Drug Condition classes, or a difference in Drug Condition effect for the two Age classes. As the main interest is on Drug Condition and Age × Drug Condition Interaction, for each of the 84 genes, p-values for Drug Condition and Age × Drug Condition are combined by the Fisher method, resulting in values shown in Table 4; this value indicates a combined effect of Drug Condition and its interaction with Age, that is, a difference in Drug Condition in the two Age groups.
Table 4.
Genes showing significant combined effect of Drug Condition and Age × Drug Condition Interaction
| Gene symbol | Protein | P value |
|---|---|---|
| Cdh2 | Cadherin 2 | 0.0001 |
| Pim1 | Proviral integration site 1 | 0.0005 |
| Akt1 | Thymoma viral proto-oncogene 1 | 0.0028 |
| Nos1 | Nitric oxide synthase 1, neuronal | 0.0033 |
| Cebpd | CCAAT/enhancer binding protein (C/EBP), delta | 0.005 |
| Sirt1 | Sirtuin 1 (silent mating type information regulation 2, homolog) 1 (S. cerevisiae) | 0.0075 |
| Tnf | Tumor necrosis factor | 0.0078 |
| Jun | Jun oncogene | 0.0088 |
| Arc | Activity regulated cytoskeletal-associated protein | 0.0113 |
| Timp1 | Tissue inhibitor of metalloproteinase 1 | 0.0116 |
| Ppp1r14a | Protein phosphatase 1, regulatory (inhibitor) subunit 14A | 0.0119 |
| Nfkb1 | Nuclear factor of kappa light polypeptide gene enhancer in B-cells 1, p105 | 0.0128 |
| Junb | Jun-B oncogene | 0.0177 |
| Ntf5 | Neurotrophin 5 | 0.0194 |
| Ppp1ca | Protein phosphatase 1, catalytic subunit, alpha isoform | 0.021 |
| Plcg1 | Phospholipase C, gamma 1 | 0.0225 |
| Adcy1 | Adenylate cyclase 1 | 0.0231 |
| Srf | Serum response factor | 0.0283 |
| Crem | CAMP responsive element modulator | 0.0285 |
| Reln | Reelin | 0.03 |
| Mapk1 | Mitogen-activated protein kinase 1 | 0.0397 |
| Gria1 | Glutamate receptor, ionotropic, AMPA1 (alpha 1) | 0.044 |
A correction for multiple testing is the Bonferroni method. Here, we use the number of genes, n = 84, as the correction factor. While three tests were carried out for each gene, the Bonferroni correction is known to be conservative and assumes independent genes. As expression levels for different genes are correlated (for all individuals, the average absolute value of the correlation coefficient over all pairs of genes is equal to 0.27), the correction factor may thus be appropriate; a corrected significance threshold is given by 0.05/84 ≈ 0.0006; any p-value equal to 0.0006 or smaller was therefore considered experiment-wise significant at the 5% level.
To obtain an accurate picture of p-values corrected for multiple testing, permutation analysis was carried out with a version of our sumstat program (http://lab.rockefeller.edu/ott/programs). In each of the two age groups, a t-test was carried out for each of the 84 genes. P-values were estimated in 100,000 randomization samples. Results are shown in Table 5. “p0Stat” is an uncorrected p-value while “pStat” refers to p-values corrected for testing 84 genes. We refer to point-wise significance as being represented by a nominal p-value of 0.05 or less, and experiment-wise significance as a corrected p-value of 0.05 or less.
Table 5.
Gene expression by permutation analysis
| Gene | Adolescents
|
Adults
|
||||
|---|---|---|---|---|---|---|
| t-stat | p0Stat | pStat | t-stat | p0Stat | pStat | |
| Adam10 | 1.1919 | 0.2756 | 1.0000 | 1.5212 | 0.1642 | 1.0000 |
| Adcy1 | 2.1002 | 0.0706 | 0.9418 | 2.8694 | 0.0262 | 0.6131 |
| Adcy8 | 0.2943 | 0.7690 | 1.0000 | 0.5252 | 0.6176 | 1.0000 |
| Akt1 | 2.8614 | 0.0198 | 0.5402 | 3.0021 | 0.0174 | 0.5310 |
| Arc | 2.6321 | 0.0211 | 0.6787 | 2.4483 | 0.0411 | 0.8050 |
| Bdnf | 0.2593 | 0.8081 | 1.0000 | 0.5910 | 0.5581 | 1.0000 |
| Camk2a | 2.1008 | 0.0389 | 0.9418 | 1.5416 | 0.1477 | 1.0000 |
| Camk2g | 0.8748 | 0.4029 | 1.0000 | 3.4958 | 0.0107 | 0.3221 |
| Cdh2 | 0.5710 | 0.5792 | 1.0000 | 5.3723 | 0.0020 | 0.0364 |
| Cebpb | 1.8044 | 0.0436 | 0.9888 | 2.1524 | 0.0699 | 0.9217 |
| Cebpd | 2.6573 | 0.0271 | 0.6588 | 2.9977 | 0.0200 | 0.5354 |
| Cnr1 | 0.5855 | 0.5662 | 1.0000 | 0.0409 | 0.9664 | 1.0000 |
| Creb1 | 1.8359 | 0.0752 | 0.9874 | 1.0774 | 0.3104 | 1.0000 |
| Crem | 0.6802 | 0.5081 | 1.0000 | 5.1072 | 0.0020 | 0.0493 |
| Dlg4 | 1.5462 | 0.1636 | 1.0000 | 0.6697 | 0.5665 | 1.0000 |
| Egr1 | 2.0242 | 0.0784 | 0.9562 | 0.4780 | 0.7411 | 1.0000 |
| Egr2 | 0.0608 | 0.9573 | 1.0000 | 0.5097 | 0.6190 | 1.0000 |
| Egr3 | 0.7826 | 0.4496 | 1.0000 | 1.2173 | 0.2505 | 1.0000 |
| Egr4 | 2.5824 | 0.0335 | 0.7109 | 0.8300 | 0.4290 | 1.0000 |
| Ephb2 | 0.3960 | 0.6932 | 1.0000 | 0.9627 | 0.3446 | 1.0000 |
| Fos | 0.0579 | 0.9646 | 1.0000 | 1.3644 | 0.2089 | 1.0000 |
| Gabra5 | 0.1930 | 0.8473 | 1.0000 | 0.5653 | 0.5786 | 1.0000 |
| Gnai1 | 0.6283 | 0.5478 | 1.0000 | 0.8563 | 0.4024 | 1.0000 |
| Gria1 | 2.4841 | 0.0338 | 0.7630 | 0.6838 | 0.5056 | 1.0000 |
| Gria2 | 1.2589 | 0.2474 | 1.0000 | 0.1906 | 0.8494 | 1.0000 |
| Gria3 | 1.2821 | 0.2285 | 1.0000 | 0.7410 | 0.4703 | 1.0000 |
| Gria4 | 1.4551 | 0.1716 | 1.0000 | 0.2226 | 0.8182 | 1.0000 |
| Grin1 | 2.1134 | 0.0550 | 0.9406 | 0.3648 | 0.7212 | 1.0000 |
| Grin2a | 1.2898 | 0.2282 | 1.0000 | 1.4780 | 0.1742 | 1.0000 |
| Grin2b | 0.7591 | 0.4803 | 1.0000 | 0.2403 | 0.8166 | 1.0000 |
| Grin2c | 1.3719 | 0.1930 | 1.0000 | 2.0639 | 0.0680 | 0.9417 |
| Grin2d | 1.7826 | 0.1109 | 0.9925 | 0.2956 | 0.7657 | 1.0000 |
| Grip1 | 1.9917 | 0.0748 | 0.9605 | 0.6064 | 0.5936 | 1.0000 |
| Grm1 | 0.6242 | 0.5464 | 1.0000 | 0.3532 | 0.7260 | 1.0000 |
| Grm2 | 1.2014 | 0.2395 | 1.0000 | 1.1948 | 0.2699 | 1.0000 |
| Grm3 | 0.0817 | 0.9372 | 1.0000 | 0.5415 | 0.6005 | 1.0000 |
| Grm4 | 0.0409 | 0.9587 | 1.0000 | 0.9368 | 0.3795 | 1.0000 |
| Grm5 | 1.7283 | 0.0834 | 0.9951 | 0.4022 | 0.7198 | 1.0000 |
| Grm7 | 0.7147 | 0.5735 | 1.0000 | 1.6326 | 0.1438 | 0.9960 |
| Grm8 | 1.0299 | 0.3109 | 1.0000 | 0.1287 | 0.8979 | 1.0000 |
| Homer1 | 1.9550 | 0.0802 | 0.9710 | 0.5549 | 0.5789 | 1.0000 |
| Igf1 | 0.5989 | 0.5682 | 1.0000 | 1.8385 | 0.1028 | 0.9824 |
| Inhba | 0.1165 | 0.8919 | 1.0000 | 0.4264 | 0.6764 | 1.0000 |
| Jun | 2.9252 | 0.0163 | 0.5094 | 2.3881 | 0.0488 | 0.8416 |
| Junb | 3.4492 | 0.0112 | 0.2550 | 1.7831 | 0.1124 | 0.9844 |
| Kif17 | 0.7673 | 0.4705 | 1.0000 | 1.7375 | 0.0732 | 0.9892 |
| Klf10 | 0.4054 | 0.9439 | 1.0000 | 1.6209 | 0.1401 | 0.9979 |
| Mapk1 | 1.7265 | 0.1161 | 0.9951 | 2.3917 | 0.0476 | 0.8416 |
| Mmp9 | 0.1795 | 0.8204 | 1.0000 | 1.5424 | 0.1590 | 1.0000 |
| Ncam1 | 0.5563 | 0.5870 | 1.0000 | 0.4349 | 0.6654 | 1.0000 |
| Nfkb1 | 0.0849 | 0.9308 | 1.0000 | 2.4694 | 0.0394 | 0.7961 |
| Nfkbib | 0.4718 | 0.8003 | 1.0000 | 1.4319 | 0.1677 | 1.0000 |
| Ngf | 0.4270 | 0.6864 | 1.0000 | 0.9696 | 0.3674 | 1.0000 |
| Ngfr | 1.6174 | 0.1324 | 0.9988 | 0.1958 | 0.8670 | 1.0000 |
| Nos1 | 1.1009 | 0.2948 | 1.0000 | 3.6820 | 0.0020 | 0.2644 |
| Nptx2 | 0.0855 | 0.9418 | 1.0000 | 0.4755 | 0.6859 | 1.0000 |
| Nr4a1 | 2.0433 | 0.0602 | 0.9512 | 0.8997 | 0.3835 | 1.0000 |
| Ntf3 | 1.7555 | 0.1150 | 0.9939 | 1.7083 | 0.1262 | 0.9914 |
| Ntf5 | 3.4003 | 0.0084 | 0.2729 | 1.0765 | 0.3277 | 1.0000 |
| Ntrk2 | 0.0842 | 0.9387 | 1.0000 | 2.3997 | 0.0382 | 0.8304 |
| Pcdh8 | 0.4915 | 0.6184 | 1.0000 | 1.3499 | 0.2075 | 1.0000 |
| Pick1 | 0.5030 | 0.6207 | 1.0000 | 1.0454 | 0.3043 | 1.0000 |
| Pim1 | 2.6424 | 0.0330 | 0.6717 | 4.2979 | 0.0020 | 0.1335 |
| Plat | 0.4053 | 0.7040 | 1.0000 | 2.8331 | 0.0174 | 0.6306 |
| Plcg1 | 1.9893 | 0.0970 | 0.9605 | 2.5342 | 0.0452 | 0.7568 |
| Ppp1ca | 1.9932 | 0.0240 | 0.9592 | 2.4985 | 0.0392 | 0.7832 |
| Ppp1cc | 0.9188 | 0.3749 | 1.0000 | 1.2980 | 0.2305 | 1.0000 |
| Ppp1r14a | 2.6975 | 0.0198 | 0.6351 | 1.2661 | 0.2330 | 1.0000 |
| Ppp2ca | 1.3606 | 0.2038 | 1.0000 | 1.9850 | 0.0908 | 0.9652 |
| Ppp3ca | 0.8023 | 0.4532 | 1.0000 | 0.1437 | 0.9151 | 1.0000 |
| Prkca | 0.1026 | 0.9079 | 1.0000 | 0.6793 | 0.5004 | 1.0000 |
| Prkcc | 1.1744 | 0.2562 | 1.0000 | 1.0875 | 0.3078 | 1.0000 |
| Prkg1 | 1.5265 | 0.1572 | 1.0000 | 2.4857 | 0.0252 | 0.7896 |
| Rab3a | 0.5568 | 0.5737 | 1.0000 | 0.0467 | 0.9651 | 1.0000 |
| Rela | 1.0270 | 0.3329 | 1.0000 | 2.0485 | 0.0707 | 0.9438 |
| Reln | 0.3049 | 0.7784 | 1.0000 | 2.1285 | 0.0558 | 0.9262 |
| Rgs2 | 2.0380 | 0.0737 | 0.9525 | 1.7142 | 0.1238 | 0.9914 |
| Rheb | 0.2457 | 0.8134 | 1.0000 | 0.2203 | 0.8263 | 1.0000 |
| Sirt1 | 0.3793 | 0.7021 | 1.0000 | 3.5587 | 0.0124 | 0.2997 |
| Srf | 1.4641 | 0.1667 | 1.0000 | 2.3053 | 0.0524 | 0.8783 |
| Synpo | 2.0075 | 0.0709 | 0.9562 | 0.5716 | 0.5791 | 1.0000 |
| Timp1 | 1.7484 | 0.1157 | 0.9939 | 2.5558 | 0.0343 | 0.7485 |
| Tnf | 1.0193 | 0.3082 | 1.0000 | 3.6007 | 0.0020 | 0.2864 |
| Ywhaq | 1.6374 | 0.1302 | 0.9976 | 0.7420 | 0.4711 | 1.0000 |
Bold value indicates experiment-wise significance in permutation analysis.
RESULTS
Gene expression differing between adolescent and adult mice
A two-way ANOVA, Age × Drug Condition, found that there were thirteen genes showing a point-wise significant main effect of Age, see Table 1. Only the four genes showing experiment-wise significance are detailed below. Only the results of individual analysis of variance for each of these genes are shown in the Fig. 1.
Table 1.
Genes showing a significant main effect of Age
| Gene symbol | Protein | P value | mRNA expression levels in adults (A) vs. adolescents (a) |
|---|---|---|---|
| Mapk1 | Mitogen-activated protein kinase 1 | 0.0001 | A > a |
| Camk2g | Calcium/calmodulin-dependent protein kinase II gamma | 0.0003 | A > a |
| Gria2 | Glutamate receptor, ionotropic, AMPA2 (alpha 2) | 0.0003 | A > a |
| Grm5 | Glutamate receptor, metabotropic 5 | 0.0005 | A > a |
| Gria3 | Glutamate receptor, ionotropic, AMPA3 (alpha 3) | 0.0011 | A > a |
| Grin2d | Glutamate receptor, ionotropic, NMDA2D (epsilon 4) | 0.0016 | A < a |
| Prkg1 | Protein kinase, cGMP-dependent, type I | 0.0025 | A > a |
| Adcy1 | Adenylate cyclase 1 | 0.0044 | A > a |
| Adam10 | A disintegrin and metallopeptidase domain 10 | 0.0044 | A > a |
| Adcy8 | Adenylate cyclase 8 | 0.0049 | A > a |
| Crem | CAMP responsive element modulator | 0.0055 | A > a |
| Gnai1 | Guanine nucleotide binding protein (G protein), alpha inhibiting 1 | 0.007 | A > a |
| Camk2a | Calcium/calmodulin-dependent protein kinase II alpha | 0.0071 | A > a |
Fig. 1.
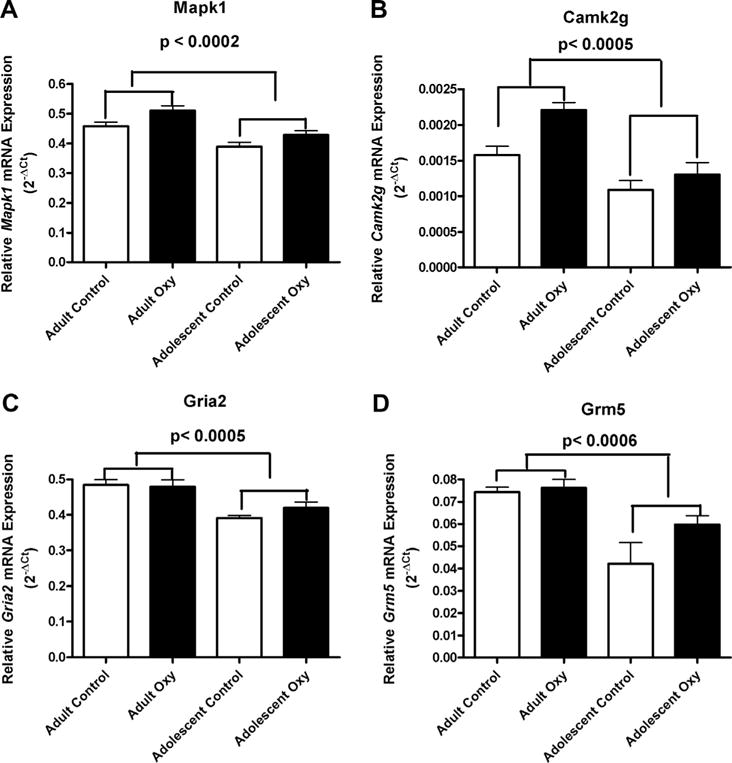
Effect of Age on Mapk1 (A), Camk2g (B), Gria 2 (C) and Grm5 (D) mRNA expression in the hippocampus of mice that had self administrated oxycodone and yoked controls. There were significantly lower Mapk1 mRNA levels in adolescent mice than in the adult mice, p < 0.0002. Also, the mRNA levels of Mapk1 were higher in mice that had self-administered oxycodone compared with those of the yoked saline controls (1A) (± SEM), p < 0.01. There were significantly lower levels of Camk2g mRNA levels in the adolescent mice than in the adult mice (p < 0.0005) (1B) (±SEM). The levels of Gria2 (p < 0.0005) and Grm5 (p < 0.0006) mRNA in the adolescent mice were significantly lower than those of the adult mice (1C and 1D, respectively) (± SEM).
Mitogen-activated protein kinase 1 (Mapk1)
The effect of age and oxycodone self-administration on Mapk1 mRNA expression in the hippocampus is shown in Fig. 1A. A two-way ANOVA showed a significant main effect of Age, F (1, 19) = 22.80, p < 0.0002, and Drug Condition, F (1, 19) = 8.34, p < 0.01, without significant interaction. There were lower Mapk1 mRNA levels in adolescent mice than in the adult mice. The mRNA levels of Mapk1 were higher in mice that had self-administered oxycodone compared with those of the yoked saline controls.
Calcium/calmodulin-dependent protein kinase II gamma (Camk2g)
The effect of age on Camk2g mRNA expression in the hippocampus is shown in Fig. 1B. A two-way ANOVA showed that there was a significant main effect of Age, F (1, 19) = 20.02, p < 0.0005. There were significantly lower levels of Camk2g mRNA in the adolescent mice than in the adult mice.
Glutamate receptor, ionotropic AMPA2 (Gria2)
The effect of age on Gria2 mRNA expression in the hippocampus is shown in Fig. 1C. A two-way ANOVA showed that there was a significant main effect of Age, F (1, 19) = 20.06, p < 0.0005. The levels of Gria2 mRNA in the adolescent mice were lower than those of the adult mice.
Glutamate receptor, metabotropic 5 (Grm5)
The effect of age on Grm5 mRNA expression in the hippocampus is shown in Fig. 1D. A two-way ANOVA showed there was a significant main effect of Age, F (1, 19) = 17.71, p < 0.0005. There were significantly lower levels of Grm5 mRNA in adolescent mice than in adult mice.
Gene expression differing between oxycodone groups and yoked saline controls
Two-way ANOVAs showed that there were fifteen genes showing a point-wise significant main effect of Drug Condition, see Table 2. Only the two genes with experiment-wise significant differences are detailed below. Only the results of individual analysis of variance for each of these genes are shown in the Fig. 2.
Table 2.
Genes showing a significant main effect of Drug Condition
| Gene symbol | Protein | P value | Direction of change |
|---|---|---|---|
| Pim1 | Proviral integration site 1 | 0.0001 | ↑ |
| Akt1 | Thymoma viral proto-oncogene 1 | 0.0005 | ↑ |
| Cebpd | CCAAT/enhancer binding protein (C/EBP), delta | 0.0008 | ↑ |
| Cdh2 | Cadherin 2 | 0.0008 | ↑ |
| Jun | Jun oncogene | 0.0014 | ↑ |
| Arc | Activity-regulated cytoskeletal-associated protein | 0.002 | ↑ |
| Junb | Jun-B oncogene | 0.0032 | ↑ |
| Adcy1 | Adenylate cyclase 1 | 0.0036 | ↑ |
| Nos1 | Nitric oxide synthase 1, neuronal | 0.0036 | ↑ |
| Plcg1 | Phospholipase C, gamma 1 | 0.0048 | ↑ |
| Timp1 | Tissue inhibitor of metalloproteinase 1 | 0.0054 | ↑ |
| Tnf | Tumor necrosis factor | 0.0065 | ↑ |
| Mapk1 | Mitogen-activated protein kinase 1 | 0.0094 | ↑ |
| Ppp1r14a | Protein phosphatase 1, regulatory (inhibitor) subunit 14A | 0.0095 | ↓ |
| Ntf5 | Neurotrophin 5 | 0.0097 | ↓ |
Fig. 2.
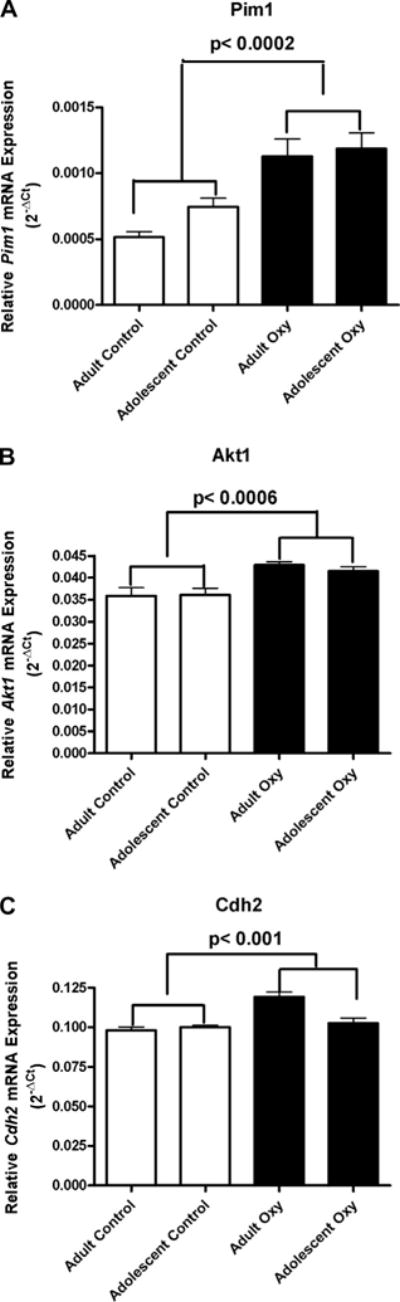
Effect of oxycodone self administration on Pim1 (A), Akt1 (B) and Cdh2 (C) mRNA expression in the hippocampus. Oxycodone self administration significantly affected Pim1 in the mouse hippocampus. Pim1 mRNA levels increased in mice that had self administered oxycondone for 14 consecutive days in both adolescent and adult groups (2A) (± SEM). Oxycodone self administration also affected Akt1 gene expression. Hippocampal Akt1 mRNA levels significantly increased in both adolescent and adult mice that had self administered oxycodone compared to yoked saline controls (2B) (± SEM). The effect of oxycodone self-administration on Cdh2 mRNA levels in the hippocampus is shown in Fig. 2C (± SEM). There were higher levels of Cdh2 mRNA in the hippocampus of mice that self-administered oxycodone compared to those of yoked-saline controls. The interaction effect was seen as an increase in mean value from adolescent to adult for oxycodone self administered mice but a decrease in mean value from adolescent to adult in yoked saline controls.
Proviral integration site 1 (Pim1)
The effect of oxycodone self-administration on Pim1 mRNA levels in the hippocampus is shown in Fig. 2A. A two-way ANOVA showed a significant main effect of Drug Condition, F (1, 19) = 22.65, p = 0.0001. There were higher levels of Pim1 mRNA in the hippocampus of mice that self-administered oxycodone compared to those of yoked-saline controls.
Thymoma viral proto-oncogene 1 (Akt1)
The effect of oxycodone self-administration on Akt1 mRNA levels in the hippocampus is shown in Fig. 2B. A two-way ANOVA revealed a significant main effect of Drug Condition, F (1, 19) = 38.98, p = 0.0005. Mice that had self-administered oxycodone had higher levels of Akt1 mRNA than those of the yoked-saline controls.
Gene expression showing a significant of Age × Drug Condition Interaction
Two-way ANOVAs showed that there were six genes showing a point-wise significant Age × Drug Condition Interaction, with no genes showing experiment-wise significance, see Table 3.
Table 3.
Gene expression showing a significant effect of Age × Drug Condition Interaction
| Gene symbol | Protein | P value |
|---|---|---|
| Ppp1ca | Protein phosphatase 1, catalytic subunit, alpha isoform | 0.0048 |
| Cdh2 | Cadherin 2 | 0.0057 |
| Rgs2 | Regulator of G-protein signaling 2 | 0.0170 |
| Crem | cAMP-responsive element modulator | 0.0211 |
| Ppp2ca | Protein phosphatase 2 (formerly 2A), catalytic subunit, alpha isoform | 0.0255 |
| Nfkb1 | Nuclear factor of kappa light polypeptide gene enhancer in B-cells 1, p105 | 0.0456 |
Gene expression showing a significant combined effect of Drug Condition and Age × Drug Condition Interaction
Two-way ANOVAs showed that there were twenty-two genes showing a point-wise significant combined effect of Drug Condition and Age × Drug Condition Interaction, see Table 4. Only the two genes with experiment-wise significant differences are detailed below.
Cadherin 2 (Cdh2)
The effect of oxycodone self-administration on Cdh2 mRNA levels in the hippocampus following 14-day oxycodone self-administration or yoked saline in adolescent and adult mice is shown in Fig. 2C. Two-way ANOVAs, Age × Drug Condition, showed a significant main effect of Age, F (1, 19) = 6.21, p < 0.05, a significant main effect of Drug Condition, F (1, 19) = 15.74, p < 0.001, and a significant Age × Drug Condition Interaction, F (1, 19) = 9.72, p < 0.01. The Fisher method showed that there was a significant combined Drug Condition and Age × Drug Condition effect, p < 0.0001. There were higher levels of Cdh2 mRNA in the hippocampus of mice that self-administered oxycodone compared to those of yoked-saline controls. The interaction effect was seen as an increase in mean value from adolescent to adult for oxycodone self-administering mice but a decrease in mean value from adolescent to adult in yoked saline controls.
Proviral integration site 1 (Pim1)
The effect of oxycodone self-administration on Pim1 mRNA levels is presented in Fig. 2A. The Fisher method showed that there was a significant combined main effect of Drug Condition and Age × Drug Condition Interaction, p < 0.001. Self administration led to higher levels of Pim1 mRNA in the hippocampus of adolescent and adult mice compared to those of yoked-saline controls.
Significant differences in gene expression by permutation analysis
Permutation analysis showed only two genes with experiment-wise significance between the oxycodone and saline controls in the adult mice, whereas none of the genes examined from adolescent mice showed experiment-wise significant difference in expression (see Table 5). In the adult groups, Cdh2 mRNA levels were significantly higher in the oxycodone self-administering group than in saline controls, p < 0.05 (Fig. 3A). In addition, cAMP responsive element modulator (Crem) mRNA levels were significantly higher in the oxycodone self-administering mice than in yoked saline control, p < 0.05 (Fig. 3B).
Fig. 3.
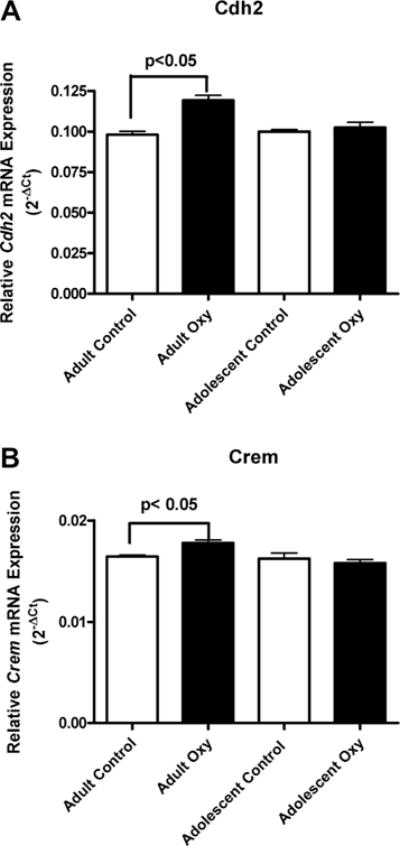
Effects of oxycodone on gene expression in the adult and adolescent mice are shown in Figure 3. In the adult groups, Cdh2 mRNA levels were significantly higher in oxycodone self administered group than saline controls, p < 0.05 (Fig. 3A) (± SEM). Crem mRNA levels were also significantly higher in the oxycodone self administered mice than in yoked saline control, p < 0.05 (Fig. 3B) (± SEM).
Correlation between the amount of oxycodone self administered and Crem mRNA levels
To quantify the relationship between the amounts of oxycodone self administered and alteration in mRNA levels following 14-days of oxycodone self administration, we examined the correlation between the levels of mRNA of each gene showing changes in response to oxycodone self administration and the amount of oxycodone self administered across all sessions or during the last session by each mouse. We found that there was a significant positive correlation between the amounts of oxycodone self-administered during the last self administration session and Crem mRNA levels, r = 0.960, p < 0.01 in the adult mice (Fig. 4A). There was also a significant positive correlation between the total amounts of oxycodone self-administered and Crem mRNA levels, r = 0.8985, p < 0.05 across the adult mice examined (Fig. 4B). No significant correlations were found in any other genes examined in this study (data not shown).
Fig. 4.
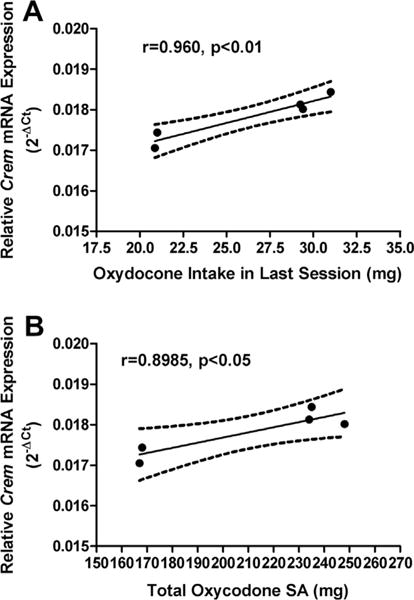
Correlation between the amount of oxycodone self administered and Crem mRNA levels. There was a significant positive correlation between Crem mRNA levels and the amounts of oxycodone self-administered in the last oxycodone self-administration session (A). There was also a significant positive correlation between Crem mRNA levels and the total amounts of oxycodone self-administered (B).
DISCUSSION
In the current study, we found that oxycodone self-administration significantly altered a number of genes involved in synaptic plasticity in the hippocampus of both the adolescent and adult mice. These genes included proviral integration site 1 and thymoma viral proto-oncogene 1, which showed experiment-wise significance between the oxycodone and saline groups. Proviral integration site 1 kinase is a short-lived serine/threonine kinase. Pim1 belongs to Ca2+/Calmodulin-dependent protein kinase family. Pim kinases are highly expressed in various tumors and enhance cell proliferation, survival (Muraski et al., 2007) and attenuate apoptosis (Shirogane et al., 1999). Thymoma viral proto-oncogene 1 is also a serine-threonine protein kinase. Akt is a critical mediator of growth factor-induced neuronal survival. The Akt pathway plays a critical role in mediating signal transduction in cell proliferation, differentiation and survival (e.g., Shao et al., 2010; Wang et al., 2012).
Mu opioid receptor (MOP-r) agonists such as morphine and heroin have been shown to cause structural plasticity in the hippocampus. Decrease in neurogenesis by 42% in the adult rat hippocampal granule cell layer was found following chronic administration of the MOP-r agonist morphine. A similar effect was also found in rats after chronic self-administration of heroin (Eisch et al., 2000). In a separate study, repeated morphine treatment led to a significant reduction of cellular proliferation in morphine-dependent animals, which rebounded after 1-week withdrawal and returned to normal after 2-week withdrawal (Kahn et al., 2005). Further, it was found that chronic morphine administration decreased neurogenesis by inhibiting dividing cells and progenitor cell progression to a more mature neuronal stage in the adult hippocampal subgranular zone (Arguello et al., 2008). Similar to the action of morphine, oxycodone is a short acting MOP-r agonist. Although there have been no reports of inhibition of neurogenesis by oxycodone, we speculate that oxycodone self-administration could also lead to decreased neurogenesis in the hippocampus. Thus, increases in both Pim1 and Akt1 kinases found in the mice that had self administered oxycodone for 14 days may be a compensatory response to inhibition of neurogenesis in the hippocampus induced by long-term oxycodone exposure.
MOP-r agonists have also been shown to modulate hippocampal functional plasticity. One study found that morphine dependence (i.e. after chronic morphine administration) attenuated the induction of LTP in rat hippocampal slices (Salmanzadeh et al., 2003). Another study demonstrated that while chronic morphine and heroin treatment reduced LTP in the rat hippocampus during withdrawal, this reduction in LTP could be reversed by re-exposure to the opiates (Pu et al., 2002). However, in a more recent study, heroin and morphine were shown to differentially alter hippocampal LTP since re-exposure to morphine restored reduced LTP during withdrawal in heroin-dependent rats, while heroin could not restore reduced LTP during withdrawal in morphine-dependent rats (Bao et al., 2007). This study demonstrates the importance of conducting experiments using other specific opiates, such as oxycodone, as they may have diverging effects on synaptic plasticity.
Mitogen-activated protein kinase and calcium/calmodulin-dependent protein kinase II are critical for synaptic plasticity and memory formation. One study found that levels of Mapk, CamkII a and Akt increased 24 h after inhibitory avoidance training in the rat hippocampus (Bekinschtein et al., 2010). Another study showed that phosphorylation levels of Mapk1/2, alpha subunit of CaMKII and Akt rapidly increased during early LTP at Schaffer collateral-CA1 mouse hippocampal synapses (Racaniello et al., 2009). Such increases in proteins kinases suggest that these kinases are closely involved in memory consolidation. In the present study, the expression of a number of genes was found to differ between the adult and adolescent hippocampus in the absence of oxycodone exposure, among them, Mapk1, CamkII g, Gria2 and Grm5 show experiment-wise significant differences. The significantly higher levels of expressions, especially in Mapk1 and CamkIIg, in adult hippocampus compared to adolescent hippocampus are important. Anatomically, neurocircuitries involved in learning and memory may not be as well developed within the adolescent hippocampus as in the adult. In addition, Mapk1 and CamkIIg, key elements for regulating synaptic plasticity and memory consolidation, are significantly lower in the adolescent hippocampus compared to those of the adult. These may, in part, determine more solid memory in adults than in adolescents.
Cadherin 2 (Cdh2) is a calcium-dependent adhesion transmembrane protein. The cadherin superfamily plays important roles in cell adhesion and forms adherent junctions to bind cells within tissues together. N-cadherin is abundantly expressed in migrating cells in the subventricular zone of the hippocampus and plays important roles in forming cell clusters and in regulating cell differentiation in this region (Yagita et al., 2009). One study found that persistence of coordinated LTP and dendritic spine enlargement at mature hippocampal CA1 synapses requires N-cadherin (Bozdagi et al., 2010). In another study, it was found that hippocampal N-cadherin mediated memory consolidation, at least in part, via cytoskeletal Mapk signaling (Schrick et al., 2007). The current study found that adult mice that self administered oxycodone had significantly higher Cdh2 mRNA levels compared to yoked saline control; which was not found in adolescent mice. The increases in Cdh2 gene expression may be closely associated with oxycodone self administration-related memory in the adult hippocampus. The lack of response of Cdh2 mRNA found in the adolescent hippocampus might be related to lower intake of oxycodone by adolescent compared with the adult mice (Mayer-Blackwell et al., 2014).
Crem encodes cAMP-responsive element modulator, binding to the cAMP responsive element, regulating transcription factors. This regulation is an important mechanism mediating the brain’s adaptation to changing environments. One study found that intracranial self stimulation upregulated the expression of synaptic plasticity-related genes including Crem in the rat hippocampus (Kadar et al., 2013). Other studies showed that the inducible cAMP early repressor (icer), encoded by Crem, plays an important role in the regulation of long-term plasticity underlying learning and memory (for review, see Borlikova and Endo, 2009). Our finding that Crem mRNA levels significantly differed between oxycodone and saline controls only in adult but not in adolescent mice suggests that Crem may play an important role in the higher intake of oxycodone found in the adult mice (Mayer-Blackwell et al., 2014). This is supported by the positive correlation between the amount of oxycodone self administered and levels of Crem mRNA found in the adult mice, but not in the adolescent mice.
Both striatum and hippocampus are brain regions playing crucial and complementary roles in learning. Striatum (especially dorsal) is known to regulate reward and habitual learning (e.g., Ito et al., 2002; Porrino et al., 2007; Belin and Everitt, 2008) whereas the hippocampus may be related to drug self-administration associated learning and memory (including contextual learning). The positive correlation between the amount of oxycodone self administered and striatal Maoa mRNA levels found in our earlier study in the same mice (Mayer-Blackwell et al., 2014) suggests that oxycodone self administration induced increase in striatal Maoa mRNA levels may be mechanistically related to increases in striatal dopamine levels as a result of oxycodone exposure (Zhang et al., 2009). It is interesting that more neurotransmitter genes showed significant changes in the striatum in adolescents compared to adults, but fewer hippocampal synaptic plasticity genes were altered in response to oxycodone self administration. Such a finding may suggest that adolescent synaptic plasticity genes in the hippocampus are either less responsive to oxycodone self administration or that adolescent hippocampus needs to undergo maturation in order to respond to oxycodone self administration.
One caveat in the present study is that our main control groups (yoked saline) do not directly assess whether the observed effects are due simply to oxycodone exposure, learning components of the acquisition/performance of the behavioral assay, or a combination of both. Thus it cannot be presently determined if the observed effects, and their differences in adolescents and adults, are due to specific interactions between oxycodone exposure and hippocampal-mediated learning components.
CONCLUSION
The current study led to the first identification of differences in gene expression in the hippocampus in adolescent versus adult mice as a result of chronic self-administration of oxycodone. Our results demonstrate different transcription profiles of specific targets involved in neuroplasticity (such as, Cdh2 and Crem), between adolescents and adults, providing initial avenues for future system-wide functional and mechanistic analyses.
Acknowledgments
This work was supported by NIH 1R01DA029147 (YZ) and the Dr. Miriam and Sheldon G. Adelson Medical Research Foundation (MJK).
We thank Drs. Orna Levran, Vadim Yuferov, Eduardo Butelman, Molly Deutsch-Feldman, Matthew Randesi for their help in preparing the manuscript.
Abbreviations
- LTP
long-term potentiation
- MOP-r
Mu opioid receptor
- PCR
polymerase chain reaction
References
- Adriani W, Laviola G. Windows of vulnerability to psychopathology and therapeutic strategy in the adolescent rodent model. Behav Pharmacol. 2004;15:341–352. doi: 10.1097/00008877-200409000-00005. [DOI] [PubMed] [Google Scholar]
- Arguello AA, Harburg GC, Schonborn JR, Mandyam CD, Yamaguchi M, Eisch AJ. Time course of morphine’s effects on adult hippocampal subgranular zone reveals preferential inhibition of cells in S phase of the cell cycle and a subpopulation of immature neurons. Neuroscience. 2008;157:70–79. doi: 10.1016/j.neuroscience.2008.08.064. [DOI] [PMC free article] [PubMed] [Google Scholar]
- Bao G, Kang L, Li H, Li Y, Pu L, Xia P, Ma L, Pei G. Morphine and heroin differentially modulate in vivo hippocampal LTP in opiate-dependent rat. Neuropsychopharmacology. 2007;32:1738–1749. doi: 10.1038/sj.npp.1301308. [DOI] [PubMed] [Google Scholar]
- Bekinschtein P, Katche C, Slipczuk L, Gonzalez C, Dorman G, Cammarota M, Izquierdo I, Medina JH. Persistence of long-term memory storage: new insights into its molecular signatures in the hippocampus and related structures. Neurotox Res. 2010;18:377–385. doi: 10.1007/s12640-010-9155-5. [DOI] [PubMed] [Google Scholar]
- Belin D, Everitt BJ. Cocaine seeking habits depend upon dopamine-dependent serial connectivity linking the ventral with the dorsal striatum. Neuron. 2008;57:432–441. doi: 10.1016/j.neuron.2007.12.019. [DOI] [PubMed] [Google Scholar]
- Belujon P, Grace AA. Hippocampus, amygdala, and stress: interacting systems that affect susceptibility to addiction. Ann N Y Acad Sci. 2011;1216:114–121. doi: 10.1111/j.1749-6632.2010.05896.x. [DOI] [PMC free article] [PubMed] [Google Scholar]
- Berke JD, Hyman SE. Addiction, dopamine, and the molecular mechanisms of memory. Neuron. 2000;25:515–532. doi: 10.1016/s0896-6273(00)81056-9. [DOI] [PubMed] [Google Scholar]
- Billa SK, Liu J, Bjorklund NL, Sinha N, Fu Y, Shinnick-Gallagher P, Moron JA. Increased insertion of glutamate receptor 2-lacking alpha-amino-3-hydroxy-5-methyl-4-isoxazole propionic acid (AMPA) receptors at hippocampal synapses upon repeated morphine administration. Mol Pharmacol. 2010;77:874–883. doi: 10.1124/mol.109.060301. [DOI] [PMC free article] [PubMed] [Google Scholar]
- Borlikova G, Endo S. Inducible cAMP early repressor (ICER) and brain functions. Mol Neurobiol. 2009;40:73–86. doi: 10.1007/s12035-009-8072-1. [DOI] [PMC free article] [PubMed] [Google Scholar]
- Bozdagi O, Wang XB, Nikitczuk JS, Anderson TR, Bloss EB, Radice GL, Zhou Q, Benson DL, Huntley GW. Persistence of coordinated long-term potentiation and dendritic spine enlargement at mature hippocampal CA1 synapses requires N-cadherin. J Neurosci. 2010;30:9984–9989. doi: 10.1523/JNEUROSCI.1223-10.2010. [DOI] [PMC free article] [PubMed] [Google Scholar]
- Carpenter-Hyland EP, Chandler LJ. Adaptive plasticity of NMDA receptors and dendritic spines: implications for enhanced vulnerability of the adolescent brain to alcohol addiction. Pharmacol Biochem Behav. 2007;86:200–208. doi: 10.1016/j.pbb.2007.01.016. [DOI] [PMC free article] [PubMed] [Google Scholar]
- Caruana DA, Alexander GM, Dudek SM. New insights into the regulation of synaptic plasticity from an unexpected place: hippocampal area CA2. Learn Mem. 2012;19:391–400. doi: 10.1101/lm.025304.111. [DOI] [PMC free article] [PubMed] [Google Scholar]
- Compton WM, Volkow ND. Major increases in opioid analgesic abuse in the United States: concerns and strategies. Drug Alcohol Depend. 2006;81:103–107. doi: 10.1016/j.drugalcdep.2005.05.009. [DOI] [PubMed] [Google Scholar]
- Eisch AJ, Barrot M, Schad CA, Self DW, Nestler EJ. Opiates inhibit neurogenesis in the adult rat hippocampus. Proc Natl Acad Sci U S A. 2000;97:7579–7584. doi: 10.1073/pnas.120552597. [DOI] [PMC free article] [PubMed] [Google Scholar]
- Ellgren M, Spano SM, Hurd YL. Adolescent cannabis exposure alters opiate intake and opioid limbic neuronal populations in adult rats. Neuropsychopharmacology. 2007;32:607–615. doi: 10.1038/sj.npp.1301127. [DOI] [PubMed] [Google Scholar]
- Garcia-Fuster MJ, Flagel SB, Mahmood ST, Mayo LM, Thompson RC, Watson SJ, Akil H. Decreased proliferation of adult hippocampal stem cells during cocaine withdrawal: possible role of the cell fate regulator FADD. Neuropsychopharmacology. 2011;36:2303–2317. doi: 10.1038/npp.2011.119. [DOI] [PMC free article] [PubMed] [Google Scholar]
- Hargreaves GA, Quinn H, Kashem MA, Matsumoto I, McGregor IS. Proteomic analysis demonstrates adolescent vulnerability to lasting hippocampal changes following chronic alcohol consumption. Alcohol Clin Exp Res. 2009;33:86–94. doi: 10.1111/j.1530-0277.2008.00814.x. [DOI] [PubMed] [Google Scholar]
- Hassan HE, Myers AL, Lee IJ, Chen H, Coop A, Eddington ND. Regulation of gene expression in brain tissues of rats repeatedly treated by the highly abused opioid agonist, oxycodone: microarray profiling and gene mapping analysis. Drug Metab Dispos. 2010;38:157–167. doi: 10.1124/dmd.109.029199. [DOI] [PMC free article] [PubMed] [Google Scholar]
- Hernandez-Rabaza V, Barcia JA, Llorens-Martin M, Trejo JL, Canales JJ. Spared place and object-place learning but limited spatial working memory capacity in rats with selective lesions of the dentate gyrus. Brain Res Bull. 2007;72:315–323. doi: 10.1016/j.brainresbull.2007.01.013. [DOI] [PubMed] [Google Scholar]
- Ito R, Dalley JW, Robbins TW, Everitt BJ. Dopamine release in the dorsal striatum during cocaine-seeking behavior under the control of a drug-associated cue. J Neurosci. 2002;22:6247–6253. doi: 10.1523/JNEUROSCI.22-14-06247.2002. [DOI] [PMC free article] [PubMed] [Google Scholar]
- Johnston LD. Prescription drug use by adolescents: what we are learning and what we still need to know. J Adolesc Health. 2009;45:539–540. doi: 10.1016/j.jadohealth.2009.09.004. [DOI] [PubMed] [Google Scholar]
- Johnston LD, O’Malley PM, Bachman JG, Schulenberg JE. Overview of Key Findings 2006. Vol. 76 National Institute on Drug Abuse. NIDA; 2006. Monitoring the Future: National Results on Adolescent Drug Use. [Google Scholar]
- Kadar E, Huguet G, Aldavert-Vera L, Morgado-Bernal I, Segura-Torres P. Intracranial self stimulation upregulates the expression of synaptic plasticity related genes and Arc protein expression in rat hippocampus. Genes Brain Behav. 2013;12:771–779. doi: 10.1111/gbb.12065. [DOI] [PubMed] [Google Scholar]
- Kahn L, Alonso G, Normand E, Manzoni OJ. Repeated morphine treatment alters polysialylated neural cell adhesion molecule, glutamate decarboxylase-67 expression and cell proliferation in the adult rat hippocampus. Eur J Neurosci. 2005;21:493–500. doi: 10.1111/j.1460-9568.2005.03883.x. [DOI] [PubMed] [Google Scholar]
- Kauer JA, Malenka RC. Synaptic plasticity and addiction. Nat Rev Neurosci. 2007;8:844–858. doi: 10.1038/nrn2234. [DOI] [PubMed] [Google Scholar]
- Kenney JW, Gould TJ. Modulation of hippocampus-dependent learning and synaptic plasticity by nicotine. Mol Neurobiol. 2008;38:101–121. doi: 10.1007/s12035-008-8037-9. [DOI] [PMC free article] [PubMed] [Google Scholar]
- Korostynski M, Kaminska-Chowaniec D, Piechota M, Przewlocki R. Gene expression profiling in the striatum of inbred mouse strains with distinct opioid-related phenotypes. BMC Genomics. 2006;7:146. doi: 10.1186/1471-2164-7-146. [DOI] [PMC free article] [PubMed] [Google Scholar]
- Marie-Claire C, Courtin C, Robert A, Gidrol X, Roques BP, Noble F. Sensitization to the conditioned rewarding effects of morphine modulates gene expression in rat hippocampus. Neuropharmacology. 2007;52:430–435. doi: 10.1016/j.neuropharm.2006.08.012. [DOI] [PMC free article] [PubMed] [Google Scholar]
- Mayer-Blackwell B, Schlussman SD, Butelman ER, Ho A, Ott J, Kreek MJ, Zhang Y. Self administration of oxycodone by adolescent and adult mice affects striatal neurotransmitter receptor gene expression. Neuroscience. 2014;258:280–291. doi: 10.1016/j.neuroscience.2013.10.062. [DOI] [PMC free article] [PubMed] [Google Scholar]
- Muraski JA, Rota M, Misao Y, Fransioli J, Cottage C, Gude N, Esposito G, Delucchi F, Arcarese M, Alvarez R, Siddiqi S, Emmanuel GN, Wu W, Fischer K, Martindale JJ, Glembotski CC, Leri A, Kajstura J, Magnuson N, Berns A, Beretta RM, Houser SR, Schaefer EM, Anversa P, Sussman MA. Pim-1 regulates cardiomyocyte survival downstream of Akt. Nat Med. 2007;13:1467–1475. doi: 10.1038/nm1671. [DOI] [PubMed] [Google Scholar]
- Nestler EJ. Molecular neurobiology of addiction. Am J Addict. 2001;10:201–217. doi: 10.1080/105504901750532094. [DOI] [PubMed] [Google Scholar]
- Porrino LJ, Smith HR, Nader MA, Beveridge TJ. The effects of cocaine: a shifting target over the course of addiction. Prog Neuropsychopharmacol Biol Psychiatry. 2007;31:1593–1600. doi: 10.1016/j.pnpbp.2007.08.040. [DOI] [PMC free article] [PubMed] [Google Scholar]
- Pu L, Bao GB, Xu NJ, Ma L, Pei G. Hippocampal long-term potentiation is reduced by chronic opiate treatment and can be restored by re-exposure to opiates. J Neurosci. 2002;22:1914–1921. doi: 10.1523/JNEUROSCI.22-05-01914.2002. [DOI] [PMC free article] [PubMed] [Google Scholar]
- Racaniello M, Cardinale A, Mollinari C, D’Antuono M, De Chiara G, Tancredi V, Merlo D. Phosphorylation changes of CaMKII, ERK1/2, PKB/Akt kinases and CREB activation during early long-term potentiation at Schaffer collateral-CA1 mouse hippocampal synapses. Neurochem Res. 2009;35:239–246. doi: 10.1007/s11064-009-0047-0. [DOI] [PubMed] [Google Scholar]
- Robbins TW, Everitt BJ. Limbic-striatal memory systems and drug addiction. Neurobiol Learn Mem. 2002;78:625–636. doi: 10.1006/nlme.2002.4103. [DOI] [PubMed] [Google Scholar]
- Rodriguez Parkitna JM, Bilecki W, Mierzejewski P, Stefanski R, Ligeza A, Bargiela A, Ziolkowska B, Kostowski W, Przewlocki R. Effects of morphine on gene expression in the rat amygdala. J Neurochem. 2004;91:38–48. doi: 10.1111/j.1471-4159.2004.02697.x. [DOI] [PubMed] [Google Scholar]
- Salmanzadeh F, Fathollahi Y, Semnanian S, Shafizadeh M. Dependence on morphine impairs the induction of long-term potentiation in the CA1 region of rat hippocampal slices. Brain Res. 2003;965:108–113. doi: 10.1016/s0006-8993(02)04144-6. [DOI] [PubMed] [Google Scholar]
- Schrick C, Fischer A, Srivastava DP, Tronson NC, Penzes P, Radulovic J. N-cadherin regulates cytoskeletally associated IQGAP1/ERK signaling and memory formation. Neuron. 2007;55:786–798. doi: 10.1016/j.neuron.2007.07.034. [DOI] [PMC free article] [PubMed] [Google Scholar]
- Shao JL, Wan XH, Chen Y, Bi C, Chen HM, Zhong Y, Heng XH, Qian JQ. H2S protects hippocampal neurons from anoxia-reoxygenation through cAMP-mediated PI3K/Akt/p70S6K cell-survival signaling pathways. J Mol Neurosci. 2010;43:453–460. doi: 10.1007/s12031-010-9464-4. [DOI] [PubMed] [Google Scholar]
- Shirogane T, Fukada T, Muller JM, Shima DT, Hibi M, Hirano T. Synergistic roles for Pim-1 and c-Myc in STAT3-mediated cell cycle progression and antiapoptosis. Immunity. 1999;11:709–719. doi: 10.1016/s1074-7613(00)80145-4. [DOI] [PubMed] [Google Scholar]
- Spear L. Modeling adolescent development and alcohol use in animals. Alcohol Res Health. 2000;24:115–123. [PMC free article] [PubMed] [Google Scholar]
- Volkow N. Drug dependence and addiction, III: expectation and brain function in drug abuse. Am J Psychiatry. 2004;161:621. doi: 10.1176/appi.ajp.161.4.621. [DOI] [PubMed] [Google Scholar]
- Vorel SR, Liu X, Hayes RJ, Spector JA, Gardner EL. Relapse to cocaine-seeking after hippocampal theta burst stimulation. Science. 2001;292:1175–1178. doi: 10.1126/science.1058043. [DOI] [PubMed] [Google Scholar]
- Wang XM, Zhou Y, Spangler R, Ho A, Han JS, Kreek MJ. Acute intermittent morphine increases preprodynorphin and kappa opioid receptor mRNA levels in the rat brain. Brain Res Mol Brain Res. 1999;66:184–187. doi: 10.1016/s0169-328x(99)00021-2. [DOI] [PubMed] [Google Scholar]
- Wang S, Chong ZZ, Shang YC, Maiese K. Wnt1 inducible signaling pathway protein 1 (WISP1) blocks neurodegeneration through phosphoinositide 3 kinase/Akt1 and apoptotic mitochondrial signaling involving Bad, Bax, Bim, and Bcl-xL. Curr Neurovasc Res. 2012;9:20–31. doi: 10.2174/156720212799297137. [DOI] [PMC free article] [PubMed] [Google Scholar]
- Yagita Y, Sakurai T, Tanaka H, Kitagawa K, Colman DR, Shan W. N-cadherin mediates interaction between precursor cells in the subventricular zone and regulates further differentiation. J Neurosci Res. 2009;87:3331–3342. doi: 10.1002/jnr.22044. [DOI] [PubMed] [Google Scholar]
- Zhang Y, Picetti R, Butelman ER, Schlussman SD, Ho A, Kreek MJ. Behavioral and neurochemical changes induced by oxycodone differ between adolescent and adult mice. Neuropsychopharmacology. 2009;34:912–922. doi: 10.1038/npp.2008.134. [DOI] [PMC free article] [PubMed] [Google Scholar]
- Zosel A, Bartelson BB, Bailey E, Lowenstein S, Dart R. Characterization of adolescent prescription drug abuse and misuse using the Researched Abuse Diversion and Addiction-related Surveillance (RADARS((R))) System. J Am Acad Child Adolesc Psychiatry. 2013;52:196–204.e192. doi: 10.1016/j.jaac.2012.11.014. [DOI] [PMC free article] [PubMed] [Google Scholar]