Abstract
Differentiation between cell surface-bound and internalized nanoparticles is challenging yet essential for accurately quantifying cellular uptake. Here, we describe a versatile mass spectrometry-based method that allows separate quantification of both cell surface-bound and internalized nanoparticles. This rapid method uses tuned laser fluencies to selectively desorb and ionize cell surface-bound cationic gold nanoparticles from intact cells, providing quantification of external particles. Overall nanoparticle quantities are obtained from the cell lysates, with subtraction of external particles from the total amount providing quantification of uptaken nanoparticles. The utility of this strategy was demonstrated through simultaneous quantitative determination of how cell-surface proteoglycans influence nanoparticle binding and uptake into cells.
Keywords: nanoparticle, mass spectrometry, cellular delivery, gold
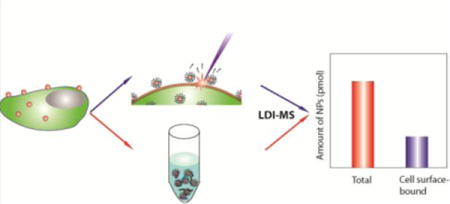
TOC image
The ability to finely control the size,1 shape2 and surface properties3 of nanoparticles (NPs) coupled with their ability to provide controlled release4,5 makes them potent carriers for cellular delivery of therapeutics. The unique optical and magnetic properties of NP cores likewise make them important imaging reagents.6,7 The localization of these materials is, however, essential to their utility with efficiency of cellular uptake is a key figure of merit in the engineering of NPs for biomedical applications. Most strategies for achieving uptake, however, rely on modification of NPs with ligands designed to interact with specific receptors or to interact strongly with the plasma membrane.8,9 Both strategies will generate simultaneous cell surface adhesion and internalization, with very different therapeutic/imaging outcomes for these two locations.
Despite the central importance of quantifying cellular uptake, quantitative differentiation of internalized and cell surface-bound NPs remains a significant challenge.10 Optical and microscopic techniques have been the most valuable in this regard. Confocal11 and fluorescence microscopy12 as well as transmission electron microscopy (TEM)13 are reliable methods for measuring the distribution of NPs on a cellular level. These methods can typically distinguish between NPs bound to the cell surface and those that have been internalized, and provide important insight into NP localization on a sub-cellular level. Quantitation using these methods, however can be challenging, in particular with small NPs.
Quantitative measurements of NP uptake into cells typically relies on methods such as inductively-coupled plasma mass spectrometry (ICP-MS)14 and flow cytometry.15,16 These methods are sensitive to a wide variety of materials and provide a relatively high-throughput, quantitative measure of NP uptake. Chemical etching is typically performed to differentiate which particles are actually internalized as compared to those that are simply adhering to the surface.17,18 Chemical etching, however, uses toxic reagents and disruptively low ionic strengths that limit its applicability.19 Molecular mass spectrometric techniques have the potential to provide quantitative information while simultaneously reporting on multiple NPs in their intact state. Our group has previously shown that laser desorption/ionization (LDI) MS is a versatile strategy that can successfully be used to detect a wide range of NPs with different materials and sizes. For example, LDI-MS was used to detect surface monolayers on quantum dots which enables monitoring of intracellular monolayer stability.20 Magnetic nanoparticle can also facilitate ionization when coupled with LDI-MS, which allows direct determination of ligand composition.21 Other examples include the imaging of carbon nanomaterials22 and AuNPs23 in animal tissues. Widely compatible with different NPs, LDI-MS has been used to determine cellular uptake24 and monitor stability of NPs in cells.25 We report here an extension of the LDI-MS method that uses tuned laser fluency to rapidly quantify cell surface-bound and internalized NPs. This LDI-MS method quantitatively distinguishes between cell surface-bound and internalized AuNPs through laser fluency absorption by the NP core that then enables desorption and ionization of the attached monolayers.26
A unique benefit of utilizing our nanoparticle-based LDI-MS method is that it capable of measuring multiple functionalized NPs in a single analysis due to the label-free and multiplex nature inherent to MS. This feature allows for the creation of specific adhesion and uptake profiles of different NPs. The combination of both optical and mass spectrometric methods allows for one to create a comprehensive picture of the uptake of various NPs in biological cells. Using the LDI-MS method with cell -level optical and quantitative methods enables the quantitative differentiation of extra- and intracellular NP distributions (Figure 1). Here, we demonstrate the utility of the LDI-MS method through quantitative assessment of the role of proteoglycans in determining cellular uptake of NPs, a challenging question that requires effective differentiation of surface-bound and internalized NPs.
Figure 1.
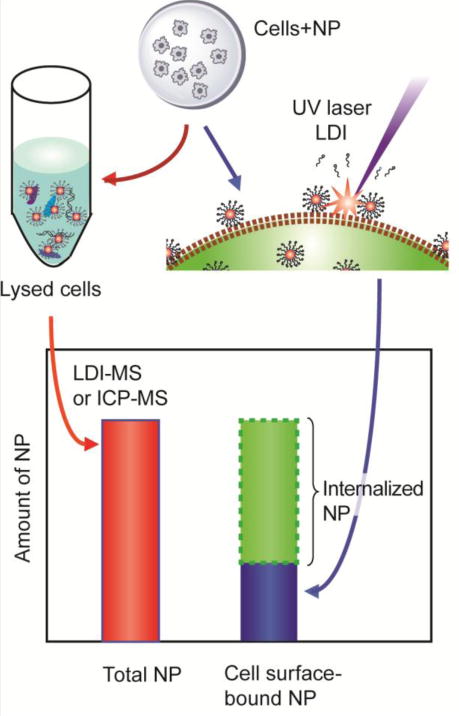
Workflow for quantifying total NP, cell surface-bound and internalized NPs using LDI-MS.
RESULTS AND DISCUSSION
The hypothesis underlying our research is the laser fluency could be tuned to desorb and ionize monolayers from NPs attached to the outside of intact cells but unable to penetrate intact cells membrane to desorb and ionize monolayers from NPs inside the cells. We first determined if AuNPs could be detected on intact cells by studying two cationic AuNPs (Figure 2a). Cells were cultured on poly-lysine coated indium tin oxide (ITO) glass slide, so that LDI-MS analyses could be performed directly following incubation without further manipulation of the cells. HeLa cells (20,000 cells) were incubated with 250 nM of AuNP 1 and AuNP 2 in serum-free media for 15 min. After incubation, the cells were washed and analyzed by LDI-MS. The ligand molecular ion or “mass barcodes” of AuNP 1 and 2 (m/z 464 and 422, respectively) are readily observed in the mass spectrum, as are fragment ions (loss of H2S from the ligands) and Au2+ (m/z 394) ions (Figure 2b).
Figure 2.
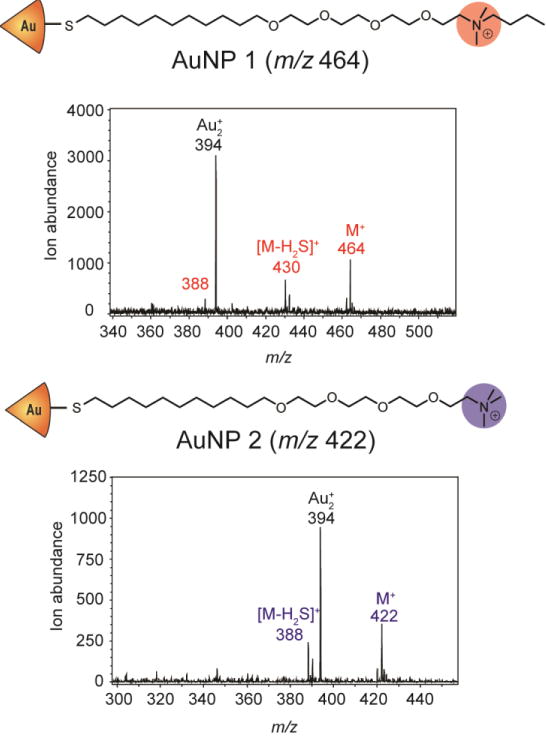
Structures of the monolayer-stabilized AuNPs used in this study and the m/z ratios of their ligand and core molecular ions and major fragments.
We determined the appropriate laser fluency for selectively detecting surface-bound AuNPs using pulse-chase kinetics. AuNPs 1 and 2 were sequentially incubated with the cells, so that AuNP 1 was pushed for internalization. After removal of surface-bound AuNP 1, AuNP 2 was added for cell surface binding, the cell samples analyzed by LDI-MS, with the distinct ligands on two nanoparticles allowing differentiation by LDI-MS. First, 250 nM of AuNP 1 was incubated with HeLa cells in serum free media for 60 min. After incubation, the cells were extensively washed with PBS to remove any AuNP 1 that was still bound to the cell surface. From separate ICP-MS measurements, we found that four wash cycles were sufficient to remove essentially all AuNPs bound to the cell surface (Figure 3a), leaving only the internalized AuNPs. In a control experiment using a polylysine-coated glass slide, no signal from AuNPs wasd etected in LDI-MS after the washing step, confirming that the effect of AuNPs on the substrate after the washing step was negligible. (Figure S1). After removal of cell-surface bound AuNP 1, 250 nM of AuNP 2 was then incubated with the cells for different amounts of time to allow AuNP 2 to both bind to the cell surface and be uptaken by the cells. As expected, a greater amount of AuNP 2 is associated with the cells after longer incubation times, as measured by LDI-MS of the cell lysate (Figure 3b), indicating that both cell uptake and cell adherence has occurred. During this time the level of AuNP 1 remained unchanged due to the relatively slow rate of exocytosis (Figure 3b).27 We incubated cells with AuNP 1 for 60 min, followed by washing and incubation with AuNP 2, at time points that provided approximately equal total quantities of the two NPs (Figure 3b). The cells were then subjected to laser irradiation at different laser fluencies, and mass spectra were acquired. The signal-to-noise ratios (S/N) of the mass barcodes for each NP were then compared (Figure 3d). S/N was used to evaluate the level of detection, where a peak of S/N over 5 was considered distinguishable from background and can be used for quantification.28 Results show that no ion signal is measured for either AuNP at energies below 2.39 J/cm2, but as the laser fluency is increased to 2.42 J/cm2, AuNP 2 is selectively and reproducibly detected. In control experiments using washed and unwashed cells that were incubated with only a single NP, only the unwashed cells provided an ion signal at laser fluencies below 2.45 J/cm2 (Figure S2). As the laser fluency is further increased past 2.45 J/cm2, both AuNPs can be detected from the intact cells, indicating that higher laser fluencies are sufficient to desorb and ionize NPs both inside and outside the cell. As expected, the NPs outside the cells are detected more efficiently at all the laser fluencies studied (Figure 3c), consistent with our initial hypothesis that the cell membrane of intact cells would hinder the desorption/ionization process.
Figure 3.

Differentiation of cell surface-bound and internalized AuNPs by tuning laser fluency (a) ICP-MS measurement of AuNP 1 levels in the cells after wash cycles showing essentially complete removal of surface-bound NPs. Paired sample t-test were performed, n=3; ***, P<0.01; **, P<0.05; n.s., P>0.05. (b) LDI-MS quantification of two AuNPs in cell lysate at different AuNP 2 incubation times. Note that AuNP 1 was first incubated for 60 min and then the cell monolayer was washed five times before incubation with AuNP 2. One-way ANOVA were performed on anount of AuNP 1, n=3, P<0.01, no significant difference between different time points was identified. (c) LDI-MS detection of AuNPs 1 and 2 from the intact cells. All error bars represent the standard deviation.
We next performed both energy depletion of cells and cell incubation at 4 °C. After energy depletion with sodium azide and 2-deoxyglucose, we observed both nanoparticles at lower laser fluency than expected (Figure S3), potentially due to the ability of sodium azide to dissociate the cell membrane from the cytoskeleton.29 Chase particle AuNP 2 was observed at much higher levels than pulse AuNP 1 as expected, with the observation of some level of internalized AuNP 1 consistent with our previous finding has shown that energy depletion cannot prevent internalization of positively charged nanoparticles.30 For cells incubated at 4 °C, both surface binding and internalization of nanoparticles were reduced to levels that could not be quantified, presumably due to reduced binding kinetics and cellular activity. We also compared our method with chemical etching. After incubating with AuNP 1, one batch of HeLa cells were treated through I2/KI etching process,17 whereas another batch was washed with DPBS for five times. We found that cells had dramatic morphological change and reduced cell density after etching compared to non-etched ones (Figure S4a), suggesting massive cell death after chemical etching, presumably due to osmotic stress when using the low ionic strength required for this method. Gold content in the supernatant from these samples was measured and compared with the cell surface-bound AuNP measured by LDI-MS (Figure S4b). Supernatant from non-etched showed agreement to LDI-MS measurement as one way-ANOVA test showed no significant difference. Interestingly, significantly higher amount of gold was measured for etched samples. Considering the loss of cells shown in figure S4a, it is possible that some AuNPs was removed with the cells unintentionally by the etching process.
We next quantified the cell surface-bound AuNPs using an AuNP internal standard and an external calibration on HepG2 cells. AuNP 1 was used as internal standard; increasing concentrations of AuNP 2 and a fixed concentration of AuNP 1 (100 nM) were incubated with cells for 15 min, during which time minimal NPs were internalized (See Figure 3b). After incubation, the intact cells were immediately analyzed by LDI-MS at the laser fluency (i.e. 2.42 J/cm2) that ionized only cell-surface bound AuNPs. Differences in behavior between cell types requires laser fluency calibration for different cell samples, adding additional experimentation. The resulting ion abundance ratios of the mass barcodes for AuNP 2 (m/z 422) and AuNP 1 (m/z 464) were plotted against the concentration ratio between the two AuNPs to generate a calibration curve (Figure 4a). Using this calibration curve, the relative amounts of AuNP 2 bound to the surface of the cells monolayer could be determined (black data points in Figure 4b). For each incubation time indicated, the internal standard (AuNP 1) was added at 100 nM (12.5 pmol) to the incubated sample and allowed to sit with the cells for 15 minutes before LDI-MS analysis. For comparison, a fraction of the cells was also lysed after different incubation times and the total NP content in the cells was determined by LDI-MS (red data points in Figure 4b). The difference between the total (red data) and cell surface bound (black data) amounts allows determination of AuNP 2 internalized (Figure 4b). It is worth notice that the amount of AuNP on cell surface is monotonically, which could be a reflection of cell shape and or surface structure modulation by exposure to positively charged AuNPs.31,32
Figure 4.
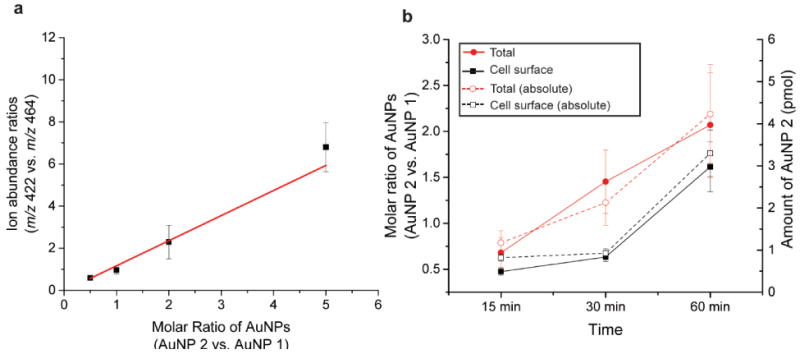
Quantification of cell surface-bound and total AuNPs in HepG2 cells. (a) Calibration curve obtained for AuNP 2 (m/z 422) when using AuNP 1 (m/z 464) as the internal standard (b) Relative amounts (solid) and absolute amount (pmol) (dashed) of AuNPs absorbed on cell surface and associated with the entire cells. The absolute amount of total AuNP 2 was measured by ICP-MS and the absolute amount of cell surface AuNP 2 was determined using the calibration curve.
Having established rapid and effctive quantification of nanoparticles, we demonstrated the utility of this method by determining how different cell-surface proteoglycans influence AuNP internalization as a demonstration of the utility of our method. Wild-type Chinese hamster ovary (CHO) cells and two proteoglycan knockdown mutants, CHO-2 (xylosyltransferase 1 deficient) and CHO-3 (galactosyltransferase 1 deficient) cells33 were incubated with AuNP 2 and analyzed (Figure 5a) (See Figure S5 in Supplementary Information for calibration curve for these cell lines). No measurable cell uptake occurs during the first 15 minutes of incubation, providing a quantitative measure of total NP adsorption in these cells using ICP-MS measurements on the cells at the 15 min time point and using these values to correlate ion abundance ratios and the absolute NP quantity (see Supplementary Information for details). The data in Figure 5 summarize the quantitative NP distributions in the three different cell types. Three conclusions can be obtained from these data: 1) The NP amounts on the cell surface do not change significantly during the course of incubation, indicating there is a rapidly achieved equilibrium between cell culture media and plasma membrane. 2) The NP amounts bound to plasma membrane differ based on cell glycosylation. The normal CHO cells have a higher level of cell surface adsorption than the proteoglycan knockdown mutants, consistent with the study by Payne et al. that proposed the importance of negatively charged proteoglycans as binding sites for cationic nanomaterials.34 3) Despite the difference in particle attachment, there was no significant difference in cellular uptake. Taken together, these studies provide direct evidence of the ability of nanoparticles to differentiate between cell surfaces based on glycosylation, an important issue for sensing35 and therapeutic strategies.36
Figure 5.
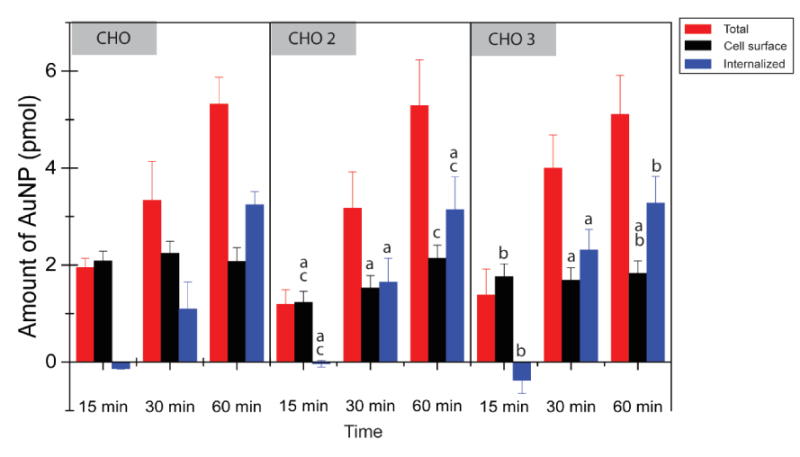
Quantities of AuNPs associated with the different CHO cell lines. One way-ANOVA (P<0.01) was performed, n=3, all error bars represent standard deviation. Letters above the bars indicate significance, in which a, b and c are in comparison with CHO, CHO2 and CHO3 at the same time point respectively.
CONCLUSION
We have shown that cell surface-bound AuNPs can be selectively detected and quantified using LDI-MS by choosing the appropriate laser fluency for analysis. Combination of this method with overall NP levels obtained through ICP-MS or LDI-MS of the cell lysate provides quantitative values for cell surface-bound and internalized NP. This method is rapid, reproducible, and avoids processing conditions that complicate etching-based methods. Given the wide range of nanomaterials that have been shown to be LDI-active,23,25,37–38,39 this method provides a highly versatile approach to addressing the long-standing challenge of quantifying nanoparticle internalization, with the potential to increase both throughput and accuracy for fundamental and translational studies of nanomaterials.
METHODS
Gold nanoparticle synthesis
The gold NPs and ligands were synthesized according to the previous reports.40 The Brust-Schiffrin two-phase synthesis method was used to synthesize 2 nm core AuNPs (Figure S7).41 After that, the Murray place-exchange was used to functionalize the AuNPs.42
Cell culture and interaction with gold nanoparticles
HeLa and HepG2 cells were cultured in a humidified atmosphere (5% CO2) at 37 °C and grown in Dulbecco’s modified eagle’s medium (DMEM, low glucose) supplemented with 10% fetal bovine serum (FBS) and 1% antibiotics (100 U/ml penicillin and 100 μg/ml streptomycin. CHO (ATCC CCL-61), CHO 2 (pgsB-618 (ATCC CRL-2241)) and CHO 3 (pgsA-745 (ATCC CRL-2242)) cells (20,000 cells/well) were cultured in a humidified atmosphere (5% CO2) at 37 °C and grown in F-12K medium supplemented with 10% fetal bovine serum (FBS), 1% antibiotics (100 U/ml penicillin and 100 μg/ml streptomycin) and 1% non-essential amino acids. The cells were split into two groups, one was plated on ITO glass slide and the other was on 96-well plate. After 24 h of plating, the cells were washed three times with cold phosphate buffer saline (PBS). Then, 125 μl of serum free DMEM containing AuNPs was added to the cells at 37 °C. After incubation, the cells were washed by cold PBS with one group analyzed directly on ITO glass slide and the other group was lysed for 30 min using lysis buffer (125 μl; Genlantis).
LDI-MS detection and quantification of gold nanoparticles in cell monolayer
ITO glass slides was coated with 0.1% poly-lysine solution for 5 minutes and then washed with deionized water 3 times to remove excess poly-lysine. The coated slides were then air dried. Open-ended Eppendorf (I.D. = 10 mm) tubes were glued to the coated slide on one end to generate media reservoirs for the cell culture. Planted cells on the slides were used for incubation with AuNPs. After incubation, the reservoirs were removed and cell monolayers on the substrate were analyzed by LDI-MS. All LDI-MS measurements were carried on a Bruker Autoflex III MALDI-TOF mass spectrometer. All mass spectra were acquired in the reflectron mode with an average of 100 laser shots at a repetition frequency at 100 Hz. The acceleration voltage was set to 19 kV. Bruker software (FlexAnalysis Version 3.3) was used for data analysis. At least 30 spectra were collected and averaged for each sample point.
LDI-MS detection and quantification of gold nanoparticles in cell lysate
The lysed cells containing AuNP 1 and/or AuNP 2 were centrifuged at 14,000 r.p.m. for 30 min. Cell pellets generated by this process were collected and washed with 60% acetonitrile/40% water to remove excess surfactants. Then, the pellets were transferred onto a 384 MTP grounded stainless steel MALDI target for LDI-MS analysis. External calibration curves were generated before sample analyses (See Figure S6 in Supplementary Information). Increasing concentrations of AuNP 2 (0, 1, 2, 5, 10 and 20 pmol) and a constant amount of AuNP 1 (5 pmol) were spiked into cell lysate and vortexed for 15 min. The resulting pellets from centrifugation were washed and analyzed by LDI-MS. The intensity ratios of the molecular ions for both AuNPs were plotted against AuNP molar ratios to generate a calibration curve. The quantities of AuNP were then determined by comparing with the calibration curve.
ICP-MS sample preparation and measurement
After incubation of the AuNPs with the cells, the lysed cells were digested with 0.5 ml of fresh aqua regia (highly corrosive; use with high caution) for 15 min. The digested samples were diluted to 10 ml with deionized water. A series of gold standard solutions (0, 0.2, 0.5, 1, 2, 5, 10 and 20 ppb) were prepared in 5 % aqua regia before each experiment. The gold standard solutions and cell lysate samples were measured on a PerkinElmer Nexion ICP mass spectrometer. The instrument was operated with 1,100W radiofrequency power, and the nebulizer argon flow rate was optimized around 0.9 to 1.1 l/min.
Supplementary Material
Acknowledgments
This research was supported by the NIH (GM GM077173, VR) and the NSF (Center for Hierarchical Manufacturing, CMMI-1025020 and CHE-1506725).
Footnotes
Supporting Information Available: This material is available free of charge via the Internet at http://pubs.acs.org.
Conflicts of Interest: The authors declare no competing financial interests.
References
- 1.Duncan B, Kim C, Rotello VM. Gold Nanoparticle Platforms as Drug and Biomacromolecule Delivery Systems. J Controlled Release. 2010;148:122–127. doi: 10.1016/j.jconrel.2010.06.004. [DOI] [PMC free article] [PubMed] [Google Scholar]
- 2.Tao AR, Habas S, Yang P. Shape Control of Colloidal Metal Nanocrystals. Small. 2008;4:310–325. [Google Scholar]
- 3.Faraji AH, Wipf P. Nanoparticles in Cellular Drug Delivery. Bioorg Med Chem. 2009;17:2950–2962. doi: 10.1016/j.bmc.2009.02.043. [DOI] [PubMed] [Google Scholar]
- 4.Meyer DE, Shin BC, Kong GA, Dewhirst MW, Chilkoti A. Drug Targeting Using Thermally Responsive Polymers and Local Hyperthermia. J Controlled Release. 2001;74:213–224. doi: 10.1016/s0168-3659(01)00319-4. [DOI] [PubMed] [Google Scholar]
- 5.Hong R, Han G, Fernández JM, Kim BJ, Forbes NS, Rotello VM. Glutathione-Mediated Delivery and Release Using Monolayer Protected Nanoparticle Carriers. J Am Chem Soc. 2006;128:1078–1079. doi: 10.1021/ja056726i. [DOI] [PubMed] [Google Scholar]
- 6.Gao X, Cui Y, Levenson RM, Chung LWK, Nie S. In Vivo Cancer Targeting and Imaging with Semiconductor Quantum Dots. Nat Biotechnol. 2004;22:969–976. doi: 10.1038/nbt994. [DOI] [PubMed] [Google Scholar]
- 7.Kircher MF, de la Zerda A, Jokerst JV, Zavaleta CL, Kempen PJ, Mittra E, Pitter K, Huang R, Campos C, Habte F, Sinclair R, Brennan CW, Mellinghoff IK, Holland EC, Gambhir SS. A Brain Tumor Molecular Imaging Strategy Using a New Triple-Modality MRI-Photoacoustic-Raman Nanoparticle. Nat Med. 2012;18:829–834. doi: 10.1038/nm.2721. [DOI] [PMC free article] [PubMed] [Google Scholar]
- 8.Brannon-Peppas L, Blanchette JO. Nanoparticle and Targeted Systems for Cancer Therapy. Adv Drug Delivery Rev. 2012;64:206–212. doi: 10.1016/j.addr.2004.02.014. [DOI] [PubMed] [Google Scholar]
- 9.Verma A, Stellacci F. Effect of Surface Properties on Nanoparticle-Cell Interactions. Small. 2010;6:12–21. doi: 10.1002/smll.200901158. [DOI] [PubMed] [Google Scholar]
- 10.Lesniak A, Salvati A. Nanoparticle Adhesion to the Cell Membrane and Its Effect on Nanoparticle Uptake Efficiency. J Am Chem Soc. 2013;135:1438–1444. doi: 10.1021/ja309812z. [DOI] [PubMed] [Google Scholar]
- 11.Verma A, Uzun O, Hu Y, Hu Y, Han H-S, Watson N, Chen S, Irvine DJ, Stellacci F. Surface-Structure-Regulated Cell-Membrane Penetration by Monolayer-Protected Nanoparticles. Nat Mater. 2008;7:588–595. doi: 10.1038/nmat2202. [DOI] [PMC free article] [PubMed] [Google Scholar]
- 12.Hartnann R, Weidenbach M, Neubauer M, Fery A, Parak WJ. Stiffness-Dependent In Vitro Uptake and Lysosomal Acidification of Colloidal Particles. Angew Chem Int. 2015;54:1365–1368. doi: 10.1002/anie.201409693. [DOI] [PubMed] [Google Scholar]
- 13.Sokolov K, Follen M, Aaron J, Pavlova I, Malpica A, Lotan R, Richards-kortum R. Advances in Brief Real-Time Vital Optical Imaging of Precancer Using Anti-Epidermal Growth Factor Receptor Antibodies Conjugated to Gold Nanoparticles. Cancer Res. 2004;63:1999–2004. [PubMed] [Google Scholar]
- 14.Chithrani BD, Ghazani Aa, Chan WCW. Determining the Size and Shape Dependence of Gold Nanoparticle Uptake into Mammalian Cells. Nano Lett. 2006;6:662–668. doi: 10.1021/nl052396o. [DOI] [PubMed] [Google Scholar]
- 15.Semmling M, Kreft O, Javier AM, Sukhorukov GB, Kas J, Parak WJ. A Novel Flow- Cytometry-Based Assay for Cellular Uptake Studies of Polyelectrolyte Microcapsules. Small. 2008;4:1763–1768. doi: 10.1002/smll.200800596. [DOI] [PubMed] [Google Scholar]
- 16.Kim JA, Åberg C, Salvati A, Dawson KA. Role of Cell Cycle on the Cellular Uptake and Dilution of Nanoparticles in a Cell Population. Nat Nanotechnol. 2011;7:62–68. doi: 10.1038/nnano.2011.191. [DOI] [PubMed] [Google Scholar]
- 17.Cho EC, Xie J, Wurm Pa, Xia Y. Understanding the Role of Surface Charges in Cellular Adsorption versus Internalization by Selectively Removing Gold Nanoparticles on the Cell Surface with a I2/KI Etchant. Nano Lett. 2009;9:1080–1084. doi: 10.1021/nl803487r. [DOI] [PubMed] [Google Scholar]
- 18.Braun GB, Friman T, Pang H-B, Pallaoro A, Hurtado de Mendoza T, Willmore A-Ma, Kotamraju VR, Mann AP, She Z-G, Sugahara KN, Reich NO, Teesalu T, Ruoslahti E. Etchable Plasmonic Nanoparticle Probes to Image and Quantify Cellular Internalization. Nat Mater. 2014;13:904–911. doi: 10.1038/nmat3982. [DOI] [PMC free article] [PubMed] [Google Scholar]
- 19.Cooper RA. Iodine Revisited. Int Wound J. 2007;4:124–137. doi: 10.1111/j.1742-481X.2007.00314.x. [DOI] [PMC free article] [PubMed] [Google Scholar]
- 20.Zhu Z-J, Yeh Y-C, Tang R, Yan B, Tamayo J, Vachet RW, Rotello VM. Stability of Quantum Dots in Live Cells. Nat Chem. 2011;3:963–968. doi: 10.1038/nchem.1177. [DOI] [PMC free article] [PubMed] [Google Scholar]
- 21.Yan B, Jeong Y, Mereante LA, Tonga GY, Kim C, Zhu Z-J, Vachet RW, Rotello VM. Characterization of Surface Ligands on Functionalized Magnetic Nanoparticles Using Laser Desorption/ionization Mass spectrometry (LDI-MS) Nanoscale. 2013;5:5063–5066. doi: 10.1039/c3nr01384g. [DOI] [PubMed] [Google Scholar]
- 22.Chen S, Xiong C, Liu H, Wan Q, Hou J, He Q, Badu-Tawiah A, Nie Z. Mass Spectrometry Imaging Reveals the Sub-Organ Distribution of Carbon Nanomaterials. Nat Nanotechnol. 2015;10:176–182. doi: 10.1038/nnano.2014.282. [DOI] [PubMed] [Google Scholar]
- 23.Yan B, Kim ST, Kim CS, Saha K, Moyano DF, Xing Y, Jiang Y, Roberts AL, Alfonso FS, Rotello VM, Vachet RW. Multiplexed Imaging of Nanoparticles in Tissues Using Laser Desorption/Ionization Mass Spectrometry. J Am Chem Soc. 2013;135:12564–12567. doi: 10.1021/ja406553f. [DOI] [PMC free article] [PubMed] [Google Scholar]
- 24.Zhu Z-J, Ghosh PS, Miranda OR, Vachet RW, Rotello VM. Multiplexed Screening of Cellular Uptake of Gold Nanoparticles Using Laser Desorption/ionization Mass Spectrometry. J Am Chem Soc. 2008;130:14139–14143. doi: 10.1021/ja805392f. [DOI] [PMC free article] [PubMed] [Google Scholar]
- 25.Zhu Z-J, Tang R, Yeh Y-C, Miranda OR, Rotello VM, Vachet RW. Determination of the Intracellular Stability of Gold Nanoparticle Monolayers Using Mass Spectrometry. Anal Chem. 2012;84:4321–4326. doi: 10.1021/ac203408v. [DOI] [PMC free article] [PubMed] [Google Scholar]
- 26.Zhu Z-J, Rotello VM, Vachet RW. Engineered Nanoparticle Surfaces for Improved Mass Spectrometric Analyses. Analyst. 2009;134:2183–2188. doi: 10.1039/b910428c. [DOI] [PubMed] [Google Scholar]
- 27.Kim CS, Le NDB, Xing Y, Yan B, Tonga GY, Kim C, Vachet RW, Rotello VM. The Role of Surface Functionality in Nanoparticle Exocytosis. Adv Healthcare Mater. 2014;3:1200–1202. doi: 10.1002/adhm.201400001. [DOI] [PMC free article] [PubMed] [Google Scholar]
- 28.Hoffmann ED, Stroobant V. Mass Spectrometry Principles and Applications. 3rd. John Wiley & Son, Ltd; West Sussex, England: 2007. [Google Scholar]
- 29.Tituskin I, Cho M. Regulation of Cell Cytoskeleton and Membrane Mechanics by Electric Field: Role of Linker Proteins. Biophys J. 2009;96:717–728. doi: 10.1016/j.bpj.2008.09.035. [DOI] [PMC free article] [PubMed] [Google Scholar]
- 30.Saha K, Kim ST, Yan B, Miranda OR, Alfonso FS, Shlosman D, Rotello VM. Surface Functionality of Nanoparticle Determines Cellular Uptake Mechanisms in Mammalian Cells. Small. 2013;9:300–305. doi: 10.1002/smll.201201129. [DOI] [PMC free article] [PubMed] [Google Scholar]
- 31.Prats-Mateu B, Ertl P, Toca-Herrera JL. Influence of HepG2 Cell Shape on Nanoparticle Uptake. Microsc Res Tech. 2014;77:560–565. doi: 10.1002/jemt.22374. [DOI] [PubMed] [Google Scholar]
- 32.Tang R, Moyano DF, Subramani C, Yan B, Jeoug E, Tonga GY, Duncan B, Yeh Y-C, Jiang Z, Kim C, Rotello VM. Rapid Coating of Surface with Functionalized Nanoparticles for Regulation of Cell Behavior. Adv Mater. 2014;26:3310–3314. doi: 10.1002/adma.201306030. [DOI] [PMC free article] [PubMed] [Google Scholar]
- 33.Stanley P, Caillibot V, Siminovitch L. Selection and Characterization of 8 Phenotypically Distinct Lines of Lectin-Resistant Chinese-Hamster Ovary Cells. Cell. 1975;6:121–128. doi: 10.1016/0092-8674(75)90002-1. [DOI] [PubMed] [Google Scholar]
- 34.Payne CK, Jones SA, Chen C, Zhuang X. Internalization and Trafficking of Cell Surface Proteoglycans and Proteoglycan-Binding Ligands. Traffic. 2007;8:389–401. doi: 10.1111/j.1600-0854.2007.00540.x. [DOI] [PMC free article] [PubMed] [Google Scholar]
- 35.Bajaj A, Rana S, Miranda OR, Yawe JC, Jerry DJ, Bunz UHF, Rotello VM. Cell Surface-Based Differentiation of Cell Types and Cancer States using a Gold Nanoparticle-GFP Based Sensing Array. Chem Sci. 2010;1:134–138. [Google Scholar]
- 36.Ernst B, Magnani JL. From Carbohydrate Leads to Glycomimetic drugs. Nat Rev Drug Discov. 2009;8:661–677. doi: 10.1038/nrd2852. [DOI] [PMC free article] [PubMed] [Google Scholar]
- 37.Castellana ET, Russell DH. Tailoring Nanoparticle Surface Chemistry to Enhance Laser Desorption Ionization of Peptides and Proteins. Nano Lett. 2007;7:3023–3025. doi: 10.1021/nl071469w. [DOI] [PubMed] [Google Scholar]
- 38.Wen X, Dagan S, Wysocki VH. Small-Molecule Analysis with Silicon-Nanoparticle-Assisted Laser Desorption/ionization Mass Spectrometry. Anal Chem. 2007;79:434–444. doi: 10.1021/ac061154l. [DOI] [PubMed] [Google Scholar]
- 39.Chen C, Chen Y. Fe3O4/TiO2 Core/Shell Nanoparticles as Affinity Probes for the Analysis of Phosphopeptides Using TiO2 Surface-Assisted Laser Desorption/Ionization Mass Spectrometry. Anal Chem. 2005;77:5912–5919. doi: 10.1021/ac050831t. [DOI] [PubMed] [Google Scholar]
- 40.Brust M, Walker M, Bethell D, Schiffrin DJ, Whyman R. Synthesis of Thiol-Derivatized Gold Nanoparticles in a Two-Phase Liquid-Liquid System. J Chem Soc, Chem Commun. 1994;7:801–802. [Google Scholar]
- 41.Templeton AC, Wuelfing WP, Murray RW. Monolayer-Protected Cluster Molecules. Acc Chem Res. 2000;33:27–36. doi: 10.1021/ar9602664. [DOI] [PubMed] [Google Scholar]
- 42.You C-C, Miranda OR, Gider B, Ghosh PS, Kim I-B, Erdogan B, Krovi SA, Bunz UHF, Rotello VM. Detection and Identification of Proteins Using Nanoparticle-Fluorescent Polymer “Chemical Nose” Sensors. Nat Nanotechnol. 2007;2:318–323. doi: 10.1038/nnano.2007.99. [DOI] [PubMed] [Google Scholar]
Associated Data
This section collects any data citations, data availability statements, or supplementary materials included in this article.


