Abstract
Purpose
To improve pseudo continuous arterial spin labeling (PCASL) robustness to off-resonance and pulsatile blood flow velocity.
Methods
The Bloch equations were solved to evaluate the effect of labeling parameters in a pulsatile flow model for a range of off-resonance. Experimental confirmation was achieved in volunteers using linear phase increase between labeling pulses to approximate off-resonance errors. The location of the labeling plane was first assessed on four volunteers, then a range of parameters, including balanced and unbalanced gradients, were explored in five more volunteers at an optimal labeling plane location.
Results
Simulations demonstrated that high velocities are vulnerable to off-resonance, that unbalanced PCASL outperforms balanced PCASL, that increased B1 and low average gradient improve the labeling efficiency for high velocity flow, and a low ratio of selective to average gradient improves off-resonance robustness. A good agreement between theory and experiment was observed.
Conclusion
The robustness of PCASL can be increased by selecting an unbalanced scheme with a low average gradient (0.5mT/m), a low ratio (7x) of selective to average gradients and the highest feasible B1 (1.8uT). Placing the labeling plane above the carotid bifurcation and below the V3 segment, usually between the second and third vertebrae, produces robust results.
Keywords: pseudo continuous arterials spin labeling (PCASL), balanced PCASL, unbalanced PCASL, labeling efficiency, off resonance
Introduction
Perfusion reflects both tissue activity and vascular supply. It is an important physiological parameter that can provide diagnostic information for numerous brain disorders including brain tumors (1) and stroke (2). Arterial spin labeling (ASL) is a non-contrast perfusion imaging method that provides non-invasive quantification of cerebral blood flow (CBF) using magnetic resonance imaging (MRI). ASL has demonstrated its accuracy and reproducibility by comparisons to dynamic susceptibility contrast (3) and positron emission tomography (PET) imaging (4). It can also be used to quantify correlated fluctuations in the activity of brain networks (5).
A recent consensus document (6) has identified pseudo continuous arterial spin labeling (PCASL) (7), as the preferred labeling method for ASL. Compared to continuous ASL, it requires no modification of hardware and avoids the asymmetric magnetization transfer effects (8), while it also provides higher SNR than pulsed ASL (9–11) and velocity selective ASL (12). PCASL has been widely used in clinical applications with generally good reliability (13). A lingering concern, however, is the potential variation in labeling efficiency, which is usually assumed to be constant. Efficiency variations across subjects can potentially be caused by tortuous or in-plane flow due to anatomical variations near the labeling plane or abnormal velocity of blood flow due to stenosis and other flow restriction. Additionally, PCASL is vulnerable to magnetic field variations at the labeling plane (14). In relatively rare cases of serious failure, almost complete loss of signal can be observed in affected arterial territories. Even more moderate efficiency loss degrades the accuracy of quantification and diagnosis with PCASL perfusion imaging.
Although CASL would ideally label all arterial blood independent of its velocity, in practice, the applied RF and gradient parameters must be optimized for a limited range of velocities. Since the range of velocities increases with applied RF power, optimal parameters typically set the RF to the maximum allowed by safety or hardware limits. Gradient parameters are then selected to optimize efficiency for the expected average velocity. Depending on the parameter and CASL method employed, differences of the velocity from the expected value can cause loss of efficiency (14). Measurements of systematically increased or decreased velocity, such as cerebrovascular reactivity studies, may also suffer from efficiency related errors. Since arterial velocity varies substantially over the cardiac cycle and the degree of pulsatility may vary across subjects and groups, including pulsatile flow effects in optimizations is important, yet it is not frequently done. As PCASL can be considered as a variant of CASL, a similar problem, therefore, needs to be addressed.
PCASL efficiency can also be strongly affected by magnetic field variations at the labeling plane. As phase shifts between PCASL RF pulses caused by magnetic field offsets increase, the difference between control and label scans drops dramatically, representing a loss of labeling efficiency. The effect can be more pronounced depending on the gradient scheme used for the control scan, since the label scan always has the same design in two main PCASL schemes. If gradients are kept unchanged relative to the label, an approach known as balanced PCASL (bPCASL) (15), stronger effects of magnetic field offsets are observed. For the fully compensated gradient control, an approach known as unbalanced PCASL (ubPCASL) (7), field effects can still be substantial, but are generally less than for bPCASL. Some calibration methods have been investigated to solve the off-resonance problem of PCASL. One approach is to calibrate the labeling efficiency at multiple off-resonance frequencies (16). However, the technique reduces the SNR per unit time and the temporal resolution of the acquisition. Another possible approach measures the labeling efficiency from feeding arteries (17). But the low SNR from reduced labeling efficiency cannot be compensated. Correction of B0 field inhomogeneity can also be performed in a pre-scan (14,18). Though potentially promising, these techniques are not currently recommended for clinical applications (6), because of their complexity and unknown robustness.
To improve the stability of PCASL, a robust labeling design is proposed. Theoretical results have been reported in the abstract form previously (19). Here we provide a detailed optimization of PCASL parameters that explicitly includes off-resonance and flow velocity variations. The results of the optimization were confirmed with volunteer studies.
Theory
In PCASL, the constant gradient and RF of CASL are simply replaced by the time average gradient and RF fields. On resonance, PCASL labeling efficiency, therefore, depends on the velocity and the labeling parameters in a similar manner to CASL using flow driven inversion.
On Resonance Efficiency and Flow Velocity
CASL labeling efficiency is high as long as the adiabatic condition (20) is met:
| [1] |
where is 42.57MHz/T, Gave is the average amplitude of the gradient, B1 is the average RF amplitude and V is flow velocity.
This can be rewritten in terms of upper and lower velocity cutoffs:
| [2] |
can be adjusted to set the velocity of maximum efficiency.
The fractional range of efficient response is characterized by
| [3] |
For high velocity spins, inefficiency occurs when RF is not strong enough to achieve rotation. For low velocity spins, inefficiency stems from substantial T2 decay during the gradual inversion.
For flow driven inversion, increasing B1 increases the range of velocities with high efficiency response and shifts the range of labeled velocities toward higher velocities. Lowering the average gradient also shifts the range of labeled velocity toward higher velocities. The above conclusions still hold for PCASL, since the on resonance labeling efficiency of PCASL is well approximated by the CASL with time averaged gradients and RF amplitude.
Off-Resonance Effects on PCASL
Off-resonance effects on PCASL are unique to the pulsed method, and are a direct result of the gaps introduced between RF pulses. Phase errors due to off-resonance can accumulate during the gaps and undermine labeling efficiency. Efficiency losses due to off-resonance are directly related to the magnitude of this phase shift. Hence larger magnetic field errors tend to occur at higher main magnetic field strengths, and longer gaps between RF pulses tend to increase the off-resonance errors.
Characteristic labeling efficiency responses as a function of phase error are plotted in Figure 1. The response was simulated with standard parameters (6): B1 1.5uT, selective gradient 10mT/m, average gradient 1mT/m, blood velocity 40cm/s, duration of Hann pulse 500us and gap between RFs 500us. The response at 0 phase shift represents the on-resonance case. The label response is the same for both bPCASL and ubPCASL, but the control response differs depending on the gradient strategy. The bPCASL control is simply a π shifted version of the label (Figure 1a). Hence the bPCASL difference between label and control must go to zero at around π/2. bPCASL has been used for its territory selective imaging capabilities, but it is unavoidably more sensitive to off-resonance (6). In contrast, the control of ubPCASL is almost independent of phase shift except exactly at π (Figure 1b). This feature enables a robust labeling efficiency design by optimizing the label response only.
Figure 1.
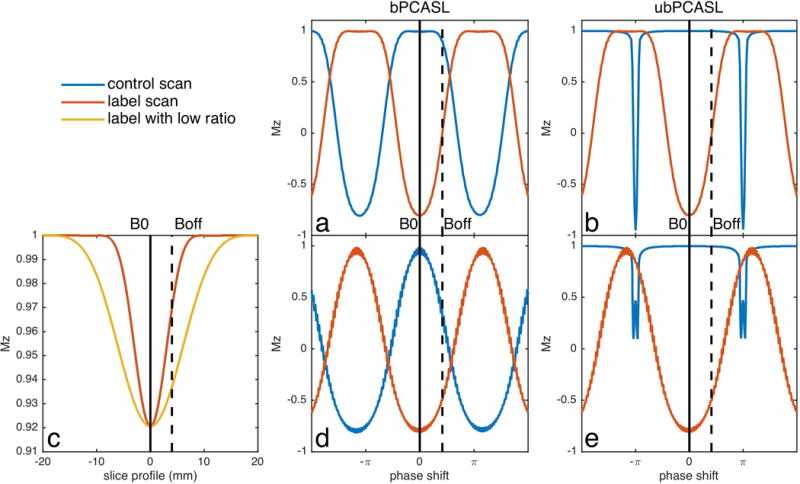
Inversion response of PCASL with standard parameters and with proposed optimal scheme for off-resonance. (a) Standard balanced scheme (bPCASL), (b) standard unbalanced scheme (ubPCASL), (d) bPCASL with low gradient ratio of selective to average gradients and (e) ubPCASL with low gradient ratio of selective to average gradients. (c) is the slice profile of one Hann pulse with standard (red) and low (yellow) ratio between selective and average gradient, which illustrates the method to improve labeling efficiency of off-resonance.
Insight into the effects of off-resonance on the labeling efficiency can be achieved by considering the spatial position of the RF pulse excitation response and the labeling plane location, Figure 1c. On-resonance, the labeling plane is centered on the peak of the RF response. With frequency offset, both the excitation response and labeling plane shift depending on the selective gradient and average gradient, respectively. However, the labeling plane shifts much more than the excitation response, because the average gradient, which decides the labeling plane, is usually smaller and more sensitive than the selective gradient, which decides the excitation slice profile. Spins rotating at this shifted labeling plane experience an effectively lower B1. Since reduced B1 primarily affects inversion efficiency of higher velocities, labeling efficiency loss at the high end of the velocity range should be expected. Improved off-resonance performance should be achieved by reducing the gradient under the RF pulse relative to the average gradient. This will broaden the slice profile (yellow line) and give an effectively higher B1 for inversion at off-resonance. The ratio of RF pulse gradient to average gradient must be kept high enough to avoid including aliased labeling planes within the RF response, however.
We should also note that reducing the gradient ratio of selective gradient (7mT/m) to averaged gradient (1mT/m) results in a wider inversion response to off-resonance in the label scan. This adjustment has negligible effect on the control scan of ubPCASL, which is relatively stable (Figure 1e). However, it narrows the response of the control scan in bPCASL (Figure 1d). Therefore, the strategy of low gradient ratio will improve the performance of ubPCASL, but provides little benefit for bPCASL. A desired response of bPCASL would have a steep transition band from unlabeled to inversion phase, which can’t be achieved by the proposed method.
Methods
Optimization of labeling efficiency was performed using a numerical solution of the Bloch equations. Since B1 is limited by SAR and the hardware of scanner, we only evaluated performance for feasible B1 parameters. Other parameters influencing the efficiency of pulsatile flow velocity and off-resonance, were subsequently confirmed with in-vivo evaluation in healthy volunteers.
Numerical Simulations and Optimization
Flow driven inversion was simulated with the hard pulse approximation of the Bloch equations (20) using a step size of 4us. Labeling RF pulses were 500us duration, followed by a 700us gap, which was chosen based on achievable timing on our 3 Tesla MRI scanner. Blood spins originated from 50mm below the labeling plane and were evaluated for inversion at 80mm above the tagging plane. A range of average gradients (Gave) 0.1-2mT/m, and ratios between the selective gradient during the RF pulse (Gmax) and averaged gradient, 1-14, were evaluated. T1 of blood was assumed to be 1650ms and T2 of arterial blood was 250ms. Simulations were performed for off-resonance phase shifts from 0Hz to 420Hz in the search of optimal parameters. All simulations were performed within MATLAB 2015a (Mathworks, Natick MA) on an Apple iMac computer (Apple Computer, Cupertino CA).
A pulsatile flow model was used to determine the weight of velocities for the calculation of efficiency. Following a prior PCASL optimization (14), we adapted a velocity time course from the center of a cross section of common carotid artery with RR cycle interval 917ms (21) and assumed an identical flow pattern in the internal carotid and vertebral arteries (Figure 2 top). The temporal course of blood flow velocity was chosen with peak systolic velocity 76cm/s at about 200ms and end diastolic velocity 30cm/s at about 100ms (22). The velocity was assumed to follow a laminar distribution in the cross-section of the artery (20).
| [4] |
The contribution of different velocities to blood flow was calculated as the flow weighted average across the velocity distribution function across the vessel and the cardiac cycle.
| [5] |
The total contribution was normalized and it is shown at the bottom of Figure 2.
| [6] |
To quantify the overall performance of a set of labeling parameters, we defined a metric Q as the mean of labeling efficiency weighted by the flow contributions of different velocities and across off-resonance, as mentioned above.
| [7] |
Figure 2.
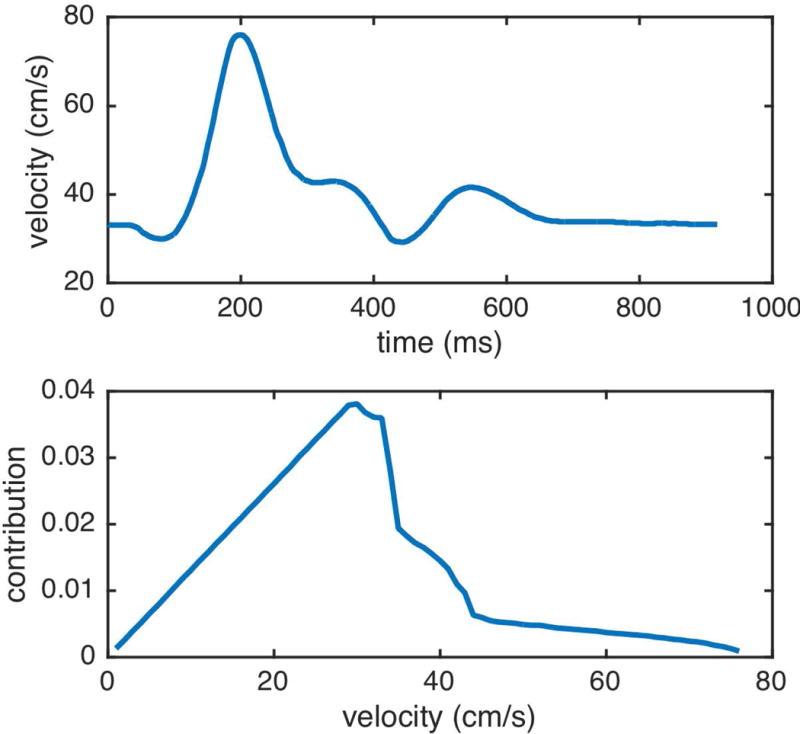
Internal carotid artery center velocity time course and normalized blood flow contribution per velocity.
Volunteer Experiments and Evaluations
All imaging was performed on a GE 3 Tesla HDxt scanner using the body coil for transmission and an eight-channel head array for reception. PCASL was performed with repeated Hann RF pulses. bPCASL was implemented with the same net gradient in control and label scans and ubPCASL used the same net gradient in the label scan, but zero-net gradient in the control. RF duration was 500us and the gap between RFs was 700us. Off-resonance effects were approximated by adding an extra phase ( ) offset between RF pulses.
| [8] |
where, is the off-resonance frequency and is the RF spacing of 1200us. Labeling duration was 2s and the post labeling delay was 1.8s.
Interleaved labeling and background suppression was used to reduce motion artifacts as previously described (23). The imaging volume, which was kept constant throughout all experiments, included most of the brain. Selective background suppression, inferior saturation, and labeling pulse positions were adjusted to match the chosen labeling plane location. Imaging was performed with a 3D single shot FSE with stack of spirals. FOV was 240mm × 240 mm, in-plane resolution was 8mm × 8mm, and 32 slices were acquired with thickness 4mm. Other parameters were: TR 5018ms, TE 14.1ms, and readout bandwidth ±125 KHz. Each PCASL acquisition included 30 images acquired with PCASL phase shifts corresponding to -450 Hz to 420 Hz off-resonance frequencies with step size of 30 Hz. Each acquisition required approximately 5 minutes.
Healthy volunteers were imaged following a protocol approved by the institutional committee on clinical investigations. All subjects provided written informed consent. Scans were performed with standard parameters near those suggested in the consensus document (6) and with our optimal parameters.
Four healthy volunteers (age 39±5 years) were studied to assess the labeling efficiency and off-resonance behavior at three different labeling plane locations. Time of flight angiography (TOF) was performed to identify arterial anatomy to specify the labeling planes. The flip angle was 15 degrees, the readout bandwidth was 20.83KHz, the FOV was 250mm x 250mm, the slice thickness was 1.8mm and TR was 31ms. Three locations were chosen based on the angiogram and inferior brain anatomy. As illustrated in Figure 3: L1: on the inferior border of the cerebellum (6); L2: above the carotid artery bifurcation and below the V3 segment; L3: below the bifurcation.
Figure 3.
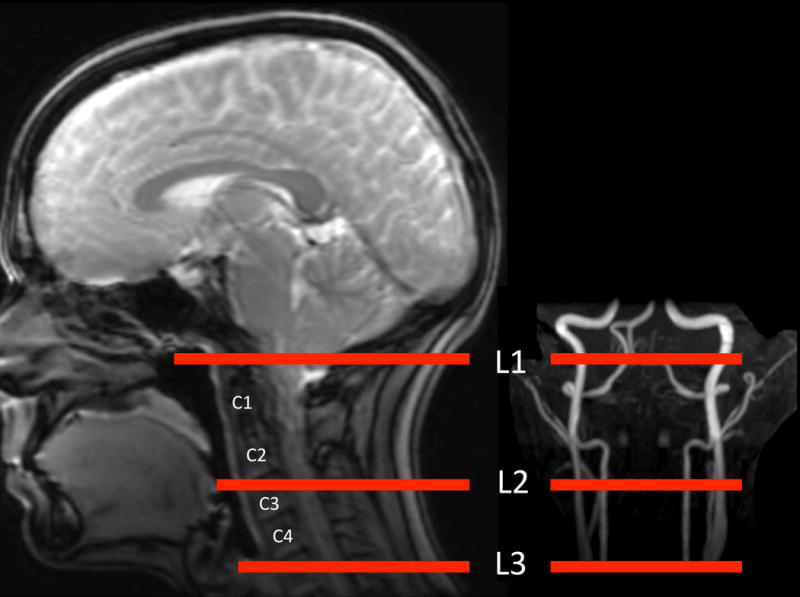
Illustration of labeling locations.
Two ubPCASL acquisitions were performed at each location: one with standard parameters recommended in the recent consensus document (Table 1 Standard ubPCASL) and the other with parameters suggested by our optimization (Table 1 Optimal B1 and Gradient ubPCASL).
Table 1.
PCASL scan parameters
| B1ave (uT) | Gave (mT/m) | Gmax (mT/m) | |
|---|---|---|---|
| Standard bPCASL | 1.5 | 1 | 10 |
| Standard ubPCASL | 1.5 | 1 | 10 |
| High B1 ubPCASL | 1.8 | 1 | 10 |
| Low Ratio ubPCASL | 1.5 | 1 | 7 |
| Optimal Gradient ubPCASL | 1.5 | 0.5 | 3.5 |
| Optimal B1 and Gradient ubPCASL | 1.8 | 0.5 | 3.5 |
A second set of five healthy volunteers (average age 31±8 years) was studied to compare the off-resonance efficiency dependence of different labeling parameters. Based on the result of the first experiment, L2 was selected as the labeling plane location. Six PCASL scans were performed at this labeling plane location with each of the labeling configurations in Table 1.
ASL images were reconstructed in MATLAB 2015a (The MathWorks Inc., Natick, MA, USA). The 3D stack of spirals data were reconstructed to images by 1D Fourier transform in the slice direction and non-uniform Fourier transform for each spiral disk. The phase map with 0Hz offset was used to combine multi-coil images in off-resonance scans.
The global brain signal was calculated as the mean signal of a 3D brain mask, which was generated by a constant threshold of ASL images with 0Hz offset. For each subject, signals were shifted so that the largest signal was located at zero frequency offset. Brain average signal for each parameter set and frequency offset was normalized to the on resonance signal of standard ubPCASL. The mean of the normalized signal and its standard error was calculated across subjects. To facilitate image averaging across subjects, ASL images were transformed to a standard atlas using the Statistical Parametric Mapping brain imaging analysis software (SPM12, Wellcome Trust Centre for Neuroimaging). The on-resonance ubPCASL images were used as reference images and motion between scans was ignored. Images were averaged across subjects for visual interpretation.
To quantify the performance of the different PCASL schemes, the variance of ASL labeling efficiency was calculated by the standard deviation of global signal across off-resonance. The coverage of off-resonance was evaluated by the area under the positive global ASL signal over off-resonance frequencies and normalized to the result of the standard ubPCASL.
Results
Numerical Simulations
Average labeling efficiency suggested different optimal parameters (red square) than consensus recommendation parameters (red circle), when considering velocity and off-resonance, Figure 4 top.
Figure 4.
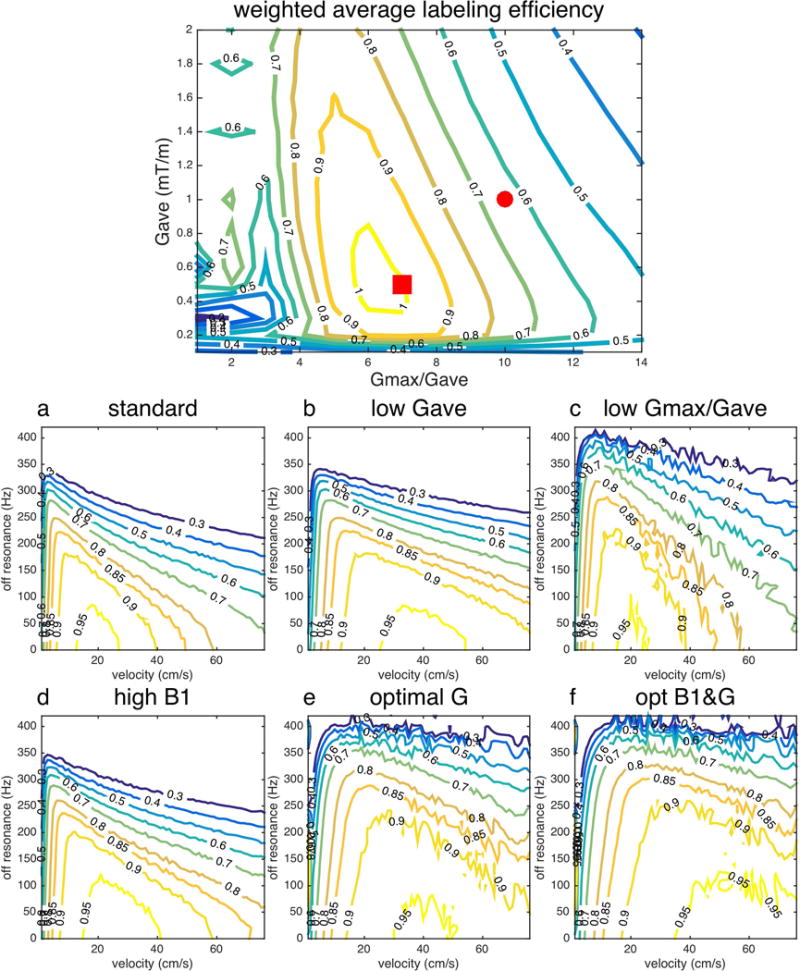
Labeling efficiency of ubPCASL at off-resonance 0-420Hz. (top) Average labeling efficiency (Q) for consensus recommended parameters (red circle, whose performance is shown in a) and new optimization gradient parameters (red square, whose performance is shown in e). Standard parameter (a), low average gradient (b) with B1=1.5uT, Gave=0.5mT/s, Gmax=5mT/s), low gradient ratio (c), high B1 (d), optimal gradients (e) and optimal B1 and gradient (f) parameters were listed in Table 1.
Labeling efficiency as a function of off-resonance confirmed the strong dependence of high velocity efficiency on off-resonance, Figure 4. With standard parameters (a) from Table 1, ubPCASL had the best performance of labeling efficiency at flow velocity 20cm/s on resonance. The labeling efficiency, however, reduced quickly at higher velocity and off-resonance frequencies. With lower average gradient and the same gradient ratio between selective and averaged gradients (b), ubPCASL expanded the labeling efficiency curve toward high velocity (40cm/s). With the same average gradient, but lower gradient ratio between selective to averaged gradients (c), the response of labeling efficiency expanded toward higher off-resonance coverage, while still keeping the best performance at flow 20cm/s. The contour lines of the efficiency were less smooth for low gradient ratio, perhaps due to perturbations from aliased labeling planes. The above results suggest that a low average gradient improves the high velocity flow efficiency and a low gradient ratio improves the off-resonance performance, as anticipated in the theory section. With 20% increase of B1 (d), the over-all performance was improved slightly by covering higher velocity blood flow and higher off-resonance frequency, compared to (a). The optimal gradient (e) and optimal B1 and gradient design (f) improved the coverage of both high velocity flow and off-resonance.
Volunteer Experiments
Figure 5 shows the ASL signal acquired at different labeling locations. When the labeling plane was located at L1, similar off-resonance responses were observed with standard parameters and optimal parameters. The optimal scheme, however, showed an asymmetric response. Since L1 was close to the petrous bone and optimal parameters result in a wider labeling plane, this labeling location could be more vulnerable to the adjacent bone tissue interface. At locations L2 and L3, the optimal parameters showed wider off-resonance coverage. But at location L3, the on-resonance signal was reduced by 20% (standard ubPCASL 0.82±0.02, optimal ubPCASL 0.86±0.05), compared with that of L1 (standard ubPCASL 1.06±0.07, optimal ubPCASL 0.99±0.05), and L2 (standard ubPCASL 1, optimal ubPCASL 0.99±0.03). A longer transit time from labeling plane to imaging plane and the turbulence in bifurcation of common carotid artery above L3 may result in the loss of signal.
Figure 5.
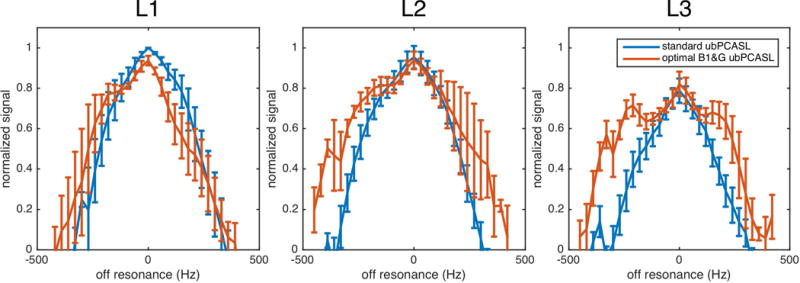
Off-resonance responses at three labeling locations.
For the standard parameters, the off-resonance response at location L3 was also narrower than that at locations L1 and L2. This suggests that the higher velocity in the common carotid artery attenuated the labeling efficient further. It had, however, minor impact on the performance of optimal parameters.
Considering both off-resonance coverage and SNR of on-resonance signal, L2 was an optimal labeling location. L2 was about 83mm below the anterior commissure-posterior commissure (AC-PC) line (83.1±16.9 mm), which was similar to the suggested distance in previous work (6,24). But this distance varied considerably between subjects, which indicated it was not a reliable anatomical landmark. A more stable way to choose labeling plane is based on anatomic features closer to the labeling plane, rather than absolute distance from AC-PC. Empirically, the location of L2 can be approximately selected between cervical vertebrae C2 and C3, as shown in Figure 3, or more precisely selected on the base of MR angiography.
Automatic linear gradient shimming of the imaging slab was performed using the default GE product prescan. At the labeling plane, on-resonance labeling was observed at variable frequency offsets across subjects (90, -60, -90, -120 and -120Hz). This suggests a considerable loss of efficiency when PCASL with consensus recommended parameters is employed, especially with balanced gradients at 3 Tesla.
Averaged ASL images of five subjects show the comparison of different PCASL parameters, Figure 6. bPCASL showed high perfusion signal in posterior regions with standard parameters. Since carotid arteries have higher flow velocity than vertebral arteries (25), the standard parameter of bPCASL and ubPCASL results in reduced labeling efficiency in most regions of gray matter, except the posterior region. In contrast, ubPCASL had more homogenous perfusion with optimal gradients and B1. Off-resonance performance was increased sequentially from standard bPCASL, standard ubPCASL, high B1 ubPCASL to optimal gradient ratio ubPCASL. Some improvement can also be seen at the highly off-resonance images (e.g. 390Hz). The quantification result in Table 2 shows that optimal B1 and gradient ubPCASL resulted in the least global signal variation and the largest coverage across off-resonance.
Figure 6.
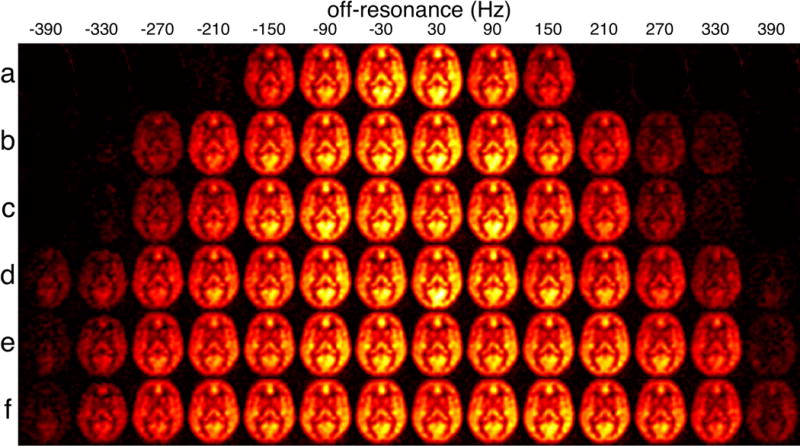
Group mean PCASL images as a function of off-resonance frequency for the six evaluated schemes: (a) standard bPCASL, (b) standard ubPCASL, (c) high B1 ubPCASL, (d) low ratio ubPCASL, (e) optimal gradient ubPCASL and (f) optimal B1 and gradient ubPCASL. Off-resonance frequencies (Hz) were labeled on the top. View window was chosen to show the positive ASL signal only.
Table 2.
The variance of labeling efficiency and off-resonance coverage of PCASL
| Standard bPCASL | Standard ubPCASL | High B1 ubPCASL | Low Ratio ubPCASL | Opt-G ubPCASL | Opt B1&G ubPCASL | |
|---|---|---|---|---|---|---|
| SD | 0.79 | 0.47 | 0.48 | 0.35 | 0.34 | 0.33 |
| Area | 0.65 | 1.00 | 1.05 | 1.25 | 1.35 | 1.42 |
The off-resonance response of five subjects (Figure 7 bottom) was consistent with the results of simulation (Figure 7 top). With standard parameters, ubPCASL (red) showed wider off-resonance coverage than bPCASL (dark blue). With 20% increased average B1 (yellow), the overall performance of ubPCASL was improved. The degree of improvement was, however, relatively small, because the feasible B1 was limited by SAR. As demonstrated in the simulation, experimental results show that a low ratio between selective gradient and average gradient (purple) improved the performance of off-resonance in ubPCASL. The extra ASL signal can be gained from optimal averaged gradient design for pulsatile velocity of blood flow, which are shown as the difference between optimal gradient (green) and low ratio ubPCASL (purple). The combination of higher B1 and optimal gradient design (light blue) delivered the best performance. The on-resonance performance, mean brain signal from 60Hz to -60Hz, of the optimal B1 and gradient ubPCASL (0.92±0.06) showed no significant difference from standard PCASL (bPCASL 0.99±0.03 and ubPCASL 1.03±0.05) using a Wilcoxon rank sum test.
Figure 7.
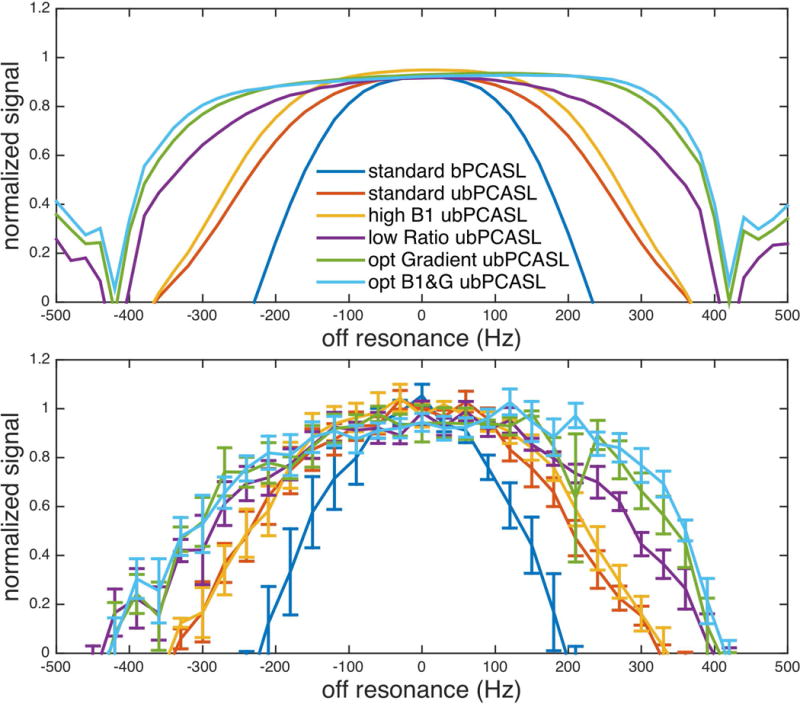
Off resonance response of PCASL with different parameters. Experimental results (bottom) were consistent with simulation results (top).
Discussion
In this work, we optimized labeling parameters linked to labeling efficiency in PCASL. A reliable labeling plane was selected based on anatomic features: above the carotid artery bifurcation and below the V3 segment or between cervical vertebrae C2 and C3, which resulted in high labeling efficiency and robust off-resonance performance. ubPCASL parameters were selected based on labeling theory and simulation. Consistent results between simulation and experiments were observed. A low average gradient and a low ratio of selective and averaged gradient improved labeling efficiency over a wide range of off-resonance and pulsatile blood flow velocity.
The location of the labeling plane is an essential part of PCASL. The choice of labeling plane is not only related to the geometry of artery and the velocity of blood flow, but also off-resonance, typically caused by bone-tissue and air-tissue interfaces or dental materials. Previous work suggested two choices for labeling plane locations: one is the inferior border of the cerebellum and the other is 85mm below the AC-PC line (18). The first one could label the blood closer to the brain, which may provide slightly higher perfusion signal. It may, however, suffer from susceptibility variations near the skull base, depending on the subject. The second choice is similar to the location proposed in this work, but it is selected based on absolute distance, which varies among subjects. We proposed a labeling location based on anatomic features: MR angiography or cervical vertebrae on localizer images. This location has demonstrated high SNR and robustness to off-resonance.
Optimization of labeling efficiency robustness involves careful choice of multiple labeling parameters, each of which must balance several factors. After maximizing B1 within the applied power limits, the choice of gradient amplitudes becomes the most important parameters to optimize. Our simulations and results have shown that choosing average and selective gradients based on-resonance efficiency may be a mistake. Robustness to off-resonance prefers a lower average gradient, since off-resonance reduces the effective B1. The benefits of lower average gradient are even more pronounced when the full range of velocities over the cardiac cycle are considered. Another critical parameter is the ratio of selective gradient to average gradient, which has a primary role in determining the off-resonance performance. A lower ratio will provide more robust labeling off-resonance. But this advantage must be traded off against two other constraints on this ratio. The first one is the need to minimized aliased labeling planes. For Hann shaped RF with 500us duration, we found empirically that 7 is a nearly optimal ratio. Another limiting factor is the overlap of the labeling region and the imaging plane, which can become a problem as the selective gradient is reduced resulting in a wider region directly affected by labeling RF.
In our study, the effect of off-resonance was experimentally approximated by introducing a phase increase between labeling RF pulses. While this approach mimics the labeling plane location shift of off-resonance, it does not shift the RF envelope location, as off-resonance will. Since this shift reduces the effect of off-resonance slightly, especially for low gradient ratio, our experimental results are a worse case for the low gradient ratio acquisitions. Including this effect should only amplify our conclusions regarding the benefit of low gradient ratios.
Though the trends of off-resonance robustness predicted by theory were also observed in-vivo, details of the off-resonance response curves were different. In Figure 7, the in-vivo response curves were less flat than the simulations and there was some sign of the asymmetry between positive and negative frequencies. Some of this discrepancy may reflect the use of phase shifts to approximate off-resonance, as described above. Another contribution may be from variations in off-resonance gradients with position. We tentatively attribute the reduced off-resonance robustness of the optimal PCASL at L1 to such effects induced by nearby bone tissue interfaces and more subtle effects may still be present at other labeling locations. Finally, deviations from idealized assumptions, including magnetization transfer in blood and flow distributions and velocities, could contribute to such differences.
Though our simulations were guided by appropriate flow waveforms, absolute flow velocities were not measured in this work. While our results were highly consistent between simulation and experiments, velocities at the labeling plane can be measured directly using phase contrast MRI (24). This may be particularly important for future work optimizing labeling efficiency in patients with arterial stenosis, where high blood flow velocities could exist at the labeling plane.
Our proposed parameters improve but did not eliminate vulnerability to magnetic field nonuniformity at the labeling plane. Full correction of nonuniformity effects using pre-calibration scan methods (14,18) could be a more complete solution to off-resonance problems, especially for balanced PCASL and higher field implementations. Though there are no fundamental obstacles to a fast precalibration field mapping scan (14), the challenges of robustly and automatically measuring and correcting fields in and near rapidly flowing blood, and bone-tissue and air-tissue interfaces are significant. An alternative strategy of precalibration by multiple phase offset perfusion measurement (18) also shows promise, but the robust fully automated implementation has not yet been demonstrated. Until such methods are optimized and widely available, the simpler selection of different labeling parameters proposed here can help to greatly improve robustness to magnetic-field nonuniformity. Even when precalibration methods are available, the use of these labeling parameters provides added robustness while preserving efficiency and reducing gradient switching and current demands.
Since the off-resonance performance of bPCASL is limited by its gradient design, the work mainly focused on ubPCASL. The performance differences between bPCASL and ubPCASL also depend on the spacing between labeling RFs. In multiphase PCASL (16), the authors found minor differences between the performance of bPCASL and ubPCASL when the off-resonance was small. This is true when the selective and refocusing gradients have similar durations, or with symmetric bipolar gradients. However, when the refocusing gradient is longer than the selective gradient (Figure 8 right), the response of bPCASL diverges from that of ubPCASL with smaller phase shift, highlighted by arrows. It indicates that off-resonance will have greater impact on bPCASL than ubPCASL. An earlier study optimizing bPCASL for off-resonance also identified the difficulty of overcoming off-resonance errors (14). Even with symmetric gradients, the performance of bPCASL is still limited by the π phase shift between control and label scans.
Figure 8.
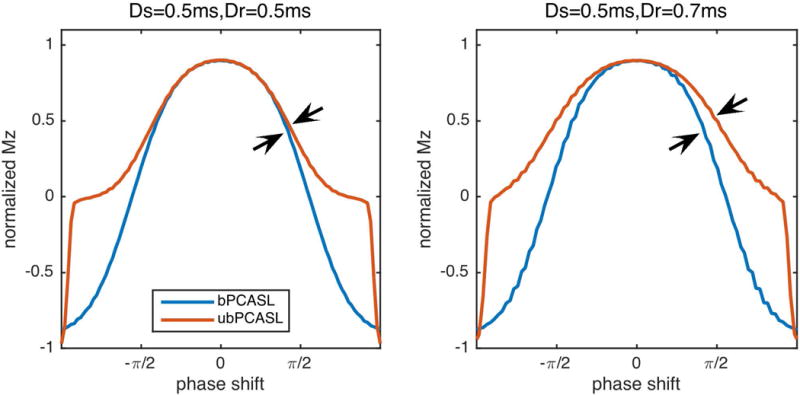
Effect of gradient duty cycle on labeling efficiency. If the duration of refocusing gradient (Dr) is longer than that of selective gradient (Ds), it resulted in more off-resonance sensitivity in bPCASL than ubPCASL.
The lower gradient amplitudes favored by our results have additional benefits not considered in our acquisitions. First, the reduction of gradient amplitudes should make possible a reduction in the gap between RF pulses in typical scanner systems where gradient switching limits the gap. This will have additional benefits for off-resonance robustness. Second, the acoustic noise produced by the PCASL preparation should be substantially decreased by the lower gradient amplitudes. This should increase patient comfort and tolerance.
Conclusion
PCASL labeling efficiency was evaluated theoretically as a function of off-resonance effects and arterial pulsatility and validated experimentally at several labeling locations. High B1, low average gradient, and low ratio of selective gradient to average gradient minimized the sensitivity of PCASL to off-resonance and pulsatile flow, with greater robustness to off-resonance observed for ubPCASL as compared with bPCASL. Optimal labeling was demonstrated above the bifurcation of common carotid artery and below the V3 segment, a location which can also be approximated by placement between the second and third cervical vertebrae based on anatomic localizer images. The proposed parameters are readily implemented to improve the accuracy and reproducibility of ASL.
Acknowledgments
This work was supported in part by the National Institute of Mental Health through R01MH080729
References
- 1.Provenzale JM, Mukundan S, Barboriak DP. Diffusion-weighted and perfusion MR imaging for brain tumor characterization and assessment of treatment response. Radiology. 2006;239:632–49. doi: 10.1148/radiol.2393042031. [DOI] [PubMed] [Google Scholar]
- 2.Albers GW, Thijs VN, Wechsler L, et al. Magnetic resonance imaging profiles predict clinical response to early reperfusion: The diffusion and perfusion imaging evaluation for understanding stroke evolution (DEFUSE) study. Ann Neurol. 2006;60:508–17. doi: 10.1002/ana.20976. [DOI] [PubMed] [Google Scholar]
- 3.Wang DJJ, Alger JR, Qiao JX, et al. The value of arterial spin-labeled perfusion imaging in acute ischemic stroke: comparison with dynamic susceptibility contrast-enhanced MRI. Stroke. [Internet] 2012;43:1018–1024. doi: 10.1161/STROKEAHA.111.631929. [DOI] [PMC free article] [PubMed] [Google Scholar]
- 4.Bokkers RP, Bremmer JP, van Berckel BN, Lammertsma AA, Hendrikse J, Pluim JP, Kappelle LJ, Boellaard R, Klijn CJ. Arterial spin labeling perfusion MRI at multiple delay times: A correlative study with H 2 15 O positron emission tomography in patients with symptomatic carotid artery occlusion. J Cereb Blood Flow Metab. 2010;30:222–229. doi: 10.1038/jcbfm.2009.204. [DOI] [PMC free article] [PubMed] [Google Scholar]
- 5.Dai W, Varma G, Scheidegger R, Alsop DC. Quantifying fluctuations of resting state networks using arterial spin labeling perfusion MRI. J Cereb Blood Flow Metab. 2015;36:463–473. doi: 10.1177/0271678X15615339. [DOI] [PMC free article] [PubMed] [Google Scholar]
- 6.Alsop DC, Detre JA, Golay X, et al. Recommended implementation of arterial spin-labeled perfusion MRI for clinical applications: A consensus of the ISMRM perfusion study group and the european consortium for ASL in dementia. Magn Reson Med. 2015;73:102–116. doi: 10.1002/mrm.25197. [DOI] [PMC free article] [PubMed] [Google Scholar]
- 7.Dai W, Garcia D, de Bazelaire C, Alsop DC. Continuous Flow-Driven Inversion for Arterial Spin Labeling Using Pulsed Radio Frequency and Gradient Fields. Magn Reson Med. 2008;60:1488–1497. doi: 10.1002/mrm.21790. [DOI] [PMC free article] [PubMed] [Google Scholar]
- 8.Detre JA, Leigh JS, Williams DS, Koretsky AP, Leight JS. Perfusion imaging. Magn Reson Med. 1992;23:37–45. doi: 10.1002/mrm.1910230106. [DOI] [PubMed] [Google Scholar]
- 9.Edelman RR, Chen Q. EPISTAR MRI: multislice mapping of cerebral blood flow. Magn Reson Med. 1998;40:800–805. doi: 10.1002/mrm.1910400603. [DOI] [PubMed] [Google Scholar]
- 10.Kim S-G, Tsekos NV. Perfusion Imaging by a Flow-sensitive Alternating Inversion Recovery (Fair) Technique: Application to Functional Brain Imaging. Magn Reson Med [Internet] 1997;37:425–435. doi: 10.1002/mrm.1910370321. [DOI] [PubMed] [Google Scholar]
- 11.Wong EC, Buxton RB, Frank LR. Implementation of Quantitative Perfusion Imaging Techniques for Functional Brain Mapping using Pulsed Arterial Spin Labeling. NMR Biomed. 1997;10:237–249. doi: 10.1002/(sici)1099-1492(199706/08)10:4/5<237::aid-nbm475>3.0.co;2-x. [DOI] [PubMed] [Google Scholar]
- 12.Wong EC, Cronin M, Wu W-C, Inglis B, Frank LR, Liu TT. Velocity-selective arterial spin labeling. Magn Reson Med. 2006;55:1334–1341. doi: 10.1002/mrm.20906. [DOI] [PubMed] [Google Scholar]
- 13.Telischak NA, Detre JA, Zaharchuk G. Arterial spin labeling MRI: Clinical applications in the brain. J Magn Reson Imaging [Internet] 2015;41:1165–1180. doi: 10.1002/jmri.24751. [DOI] [PubMed] [Google Scholar]
- 14.Jahanian H, Noll DC, Hernandez-Garcia L. B0 field inhomogeneity considerations in pseudo-continuous arterial spin labeling (pCASL): effects on tagging efficiency and correction strategy. NMR Biomed. 2011;24:1202–9. doi: 10.1002/nbm.1675. [DOI] [PubMed] [Google Scholar]
- 15.Wu WC, Fernández-Seara M, Detre JA, Wehrli FW, Wang J. A theoretical and experimental investigation of the tagging efficiency of pseudocontinuous arterial spin labeling. Magn Reson Med. 2007;58:1020–1027. doi: 10.1002/mrm.21403. [DOI] [PubMed] [Google Scholar]
- 16.Jung Y, Wong EC, Liu TT. Multiphase Pseudocontinuous Arterial Spin Labeling (MP-PCASL) for Robust Quantification of Cerebral Blood Flow. Magn Reson Med. 2010;64:799–810. doi: 10.1002/mrm.22465. [DOI] [PubMed] [Google Scholar]
- 17.Chen Z, Zhang X, Yuan C, Zhao X, van Osch MJP. Measuring the labeling efficiency of pseudocontinuous arterial spin labeling. Magn Reson Med. 2016 doi: 10.1002/mrm.26266. [DOI] [PubMed] [Google Scholar]
- 18.Luh W-M, Talagala SL, Li T-Q, Bandettini PA. Pseudo-continuous arterial spin labeling at 7 T for human brain: estimation and correction for off-resonance effects using a Prescan. Magn Reson Med. 2013;69:402–10. doi: 10.1002/mrm.24266. [DOI] [PMC free article] [PubMed] [Google Scholar]
- 19.Zhao L, Alsop DC. Improved Pseudo Continuous Arterial Spin Labeling Efficiency Robustness to Off Resonance and High Velocity. Proc Intl Soc Mag Reson Med. 2016:1488. doi: 10.1002/mrm.26513. [DOI] [PMC free article] [PubMed] [Google Scholar]
- 20.Maccotta L, Detre JA, Alsop DC. The efficiency of adiabatic inversion for perfusion imaging by arterial spin labeling. NMR Biomed. 1997;10:216–221. doi: 10.1002/(sici)1099-1492(199706/08)10:4/5<216::aid-nbm468>3.0.co;2-u. doi: 10.1002/(SICI)1099-1492(199706/08)10:4/5<216::AID-NBM468>3.0.CO;2-U. [DOI] [PubMed] [Google Scholar]
- 21.Holdsworth DW, Norley CJ, Frayne R, Steinman DA, Rutt BK. Characterization of common carotid artery blood-flow waveforms in normal human subjects. Physiol Meas. 1999;20:219–240. doi: 10.1088/0967-3334/20/3/301. [DOI] [PubMed] [Google Scholar]
- 22.Yazici B, Erdoğmuş B, Tugay A. Cerebral blood flow measurements of the extracranial carotid and vertebral arteries with Doppler ultrasonography in healthy adults. Diagn Interv Radiol. 2005;11:195–198. doi: 16320223. [PubMed] [Google Scholar]
- 23.Dai W, Robson PM, Shankaranarayanan A, Alsop DC. Reduced resolution transit delay prescan for quantitative continuous arterial spin labeling perfusion imaging. Magn Reson Med. 2012;67:1252–1265. doi: 10.1002/mrm.23103. [DOI] [PMC free article] [PubMed] [Google Scholar]
- 24.Aslan S, Xu F, Wang PL, Uh J, Yezhuvath US, Van Osch M, Lu H. Estimation of labeling efficiency in pseudocontinuous arterial spin labeling. Magn Reson Med. 2010;63:765–771. doi: 10.1002/mrm.22245. [DOI] [PMC free article] [PubMed] [Google Scholar]
- 25.Dolui S, Wang Z, Wang DJ, et al. Comparison of non-invasive MRI measurements of cerebral blood flow in a large multisite cohort. J Cereb Blood Flow Metab. 2016 doi: 10.1177/0271678X16646124. [DOI] [PMC free article] [PubMed] [Google Scholar]


