Abstract
A generalized Rayleigh–Plesset-type bubble dynamics model with a damage mechanism is developed for cavitation and damage of soft materials by focused ultrasound bursts. This study is linked to recent experimental observations in tissue-mimicking polyacrylamide and agar gel phantoms subjected to bursts of a kind being considered specifically for lithotripsy. These show bubble activation at multiple sites during the initial pulses. More cavities appear continuously through the course of the observations, similar to what is deduced in pig kidney tissues in shock-wave lithotripsy. Two different material models are used to represent the distinct properties of the two gel materials. The polyacrylamide gel is represented with a neo-Hookean elastic model and damaged based upon a maximum-strain criterion; the agar gel is represented with a strain-hardening Fung model and damaged according to the strain-energy-based Griffith's fracture criterion. Estimates based upon independently determined elasticity and viscosity of the two gel materials suggest that bubble confinement should be sufficient to prevent damage in the gels, and presumably injury in some tissues. Damage accumulation is therefore proposed to occur via a material fatigue, which is shown to be consistent with observed delays in widespread cavitation activity.
I. INTRODUCTION
A. Bubbles in therapeutic ultrasound
Either as an objective or as an undesirable consequence, application of therapeutic ultrasound often entails cavitation and subsequent bubble dynamics within soft tissue. Such bubble action is thought to cause injury1–3 in nominally noninvasive lithotripsy for comminution of kidney stones, both with commonly used shock waves in current clinical applications [shock-wave lithotripsy (SWL)] or with proposed high-intensity focused ultrasound bursts [burst-wave lithotripsy (BWL)]. Studies of pig kidneys exposed to SWL pulses—compressive shocks followed by rarefactions—suggest that the damage can be extensive and seems to occur during the treatment,4,5 in concert with the acoustic signature of cavitation.6,7 We consider SWL waveforms, though the present analysis is motivated primarily by BWL, for which we also report some specific recent experimental observations. BWL is an attractive alternative to SWL because it yields more uniform stone fragmentation in laboratory models, with fragment sizes related to the fundamental ultrasound frequency.8 Its lower pressure amplitudes and straightforward integration with real-time ultrasound imaging are also hoped to reduce kidney injury9 even while potentially faster clinical treatments are delivered. Still, experimental evidence in both animals3,10 and tissue-mimicking phantom gels9 indicate that cavitation-induced damage can still present a challenge for BWL.
While cavitation is an undesirable collateral effect in BWL, which provides our specific motivation, it is an essential feature in histotripsy, in which the violent action of cavitation bubbles provides the primary mechanism for removing tissue, often tumors.11–14 In this case, better control of cavitation might, for example, allow treatments at higher pulse-repetition frequency (PRF), i.e., faster clinical treatment, yet also suppress tissue injury outside of the target. We investigate possible mechanisms for injury to explain observations and help guide protocols and procedures to avoid injury.
B. Bubble dynamics
The basic theory for bubble mechanics in liquids is founded on the Rayleigh–Plesset equation, which describes the dynamics of a bubble with finite surface tension in a viscous incompressible Newtonian fluid and subjected to far-field pressure variation.15–18 In the long-wavelength limit, this pressure variation can correspond to a passing acoustic wave. The basic Rayleigh–Plesset formulation has been augmented to include first-order liquid compressibility,19–21 which provides for energy loss via acoustic radiation. This is important in some regimes so we likewise include compressibility effects.
Describing the corresponding bubble dynamics in soft tissues, even in this simplified single-bubble case, introduces additional challenges. Soft tissue is highly dissipative and can have sufficiently strong elastic resistance to counter bubble motion away from its stress-free reference size.22–26 To represent these mechanisms, models have been further generalized to viscoelastic material, often using the Kelvin–Voigt model for its simplicity. The infinite surrounding medium was modeled as a linear elastic material by Yang and Church27 and generalized to include finite-deformation elasticity with a neo-Hookean model by Gaudron et al.28 These models have been valuable for quantifying the relative importance of different mechanisms for confining bubbles within tissue, despite their significant simplifications.
The two main additions to the Kelvin–Voigt model in the present study are strain-hardening, which is known to be important in many tissues as well as in some gel models of tissues, and a fracture-like disruption based on reported results for other soft materials.29,30 Only with these additions do the models we develop reproduce the principal observations from recent BWL experiments in gel-based tissue phantoms.31 Because of its simplicity, the Kelvin–Voigt model has been used to model the viscoelastic behavior of hydrogels in conjunction with several experiments.32–36 As with any model, it simplifies the description and is understood to be insufficient to precisely describe all the mechanical behavior of hydrogels. There are alternative descriptions available, which potentially provide a better quantitative model for some types of deformation, such as linear and nonlinear Maxwell,22,23 upper-convected Maxwell,37 Zener, standard linear solid,38 Phan–Thien–Tanner,39 Jeffreys, Oldroyd-B, and Giesekus40 models. These are expected to provide better representations of the viscoelastic behavior if sufficiently parameterized, but experimental data are currently insufficient to do this for the present gels. Thus, the Kelvin–Voigt description is suited to our objectives since it provides the simplest description that will facilitate examination of bubble dynamics in our tissue-mimicking phantoms.
C. Gel-based tissue phantoms
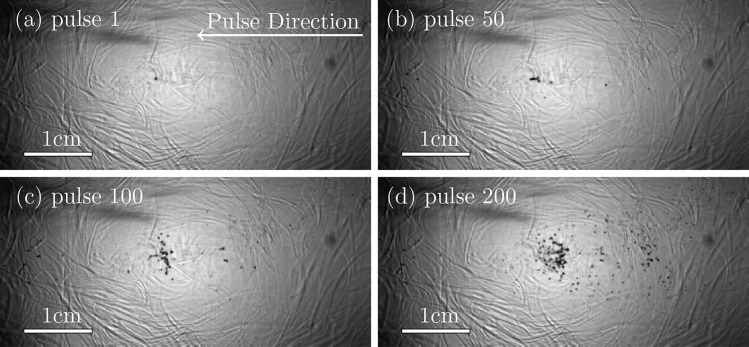
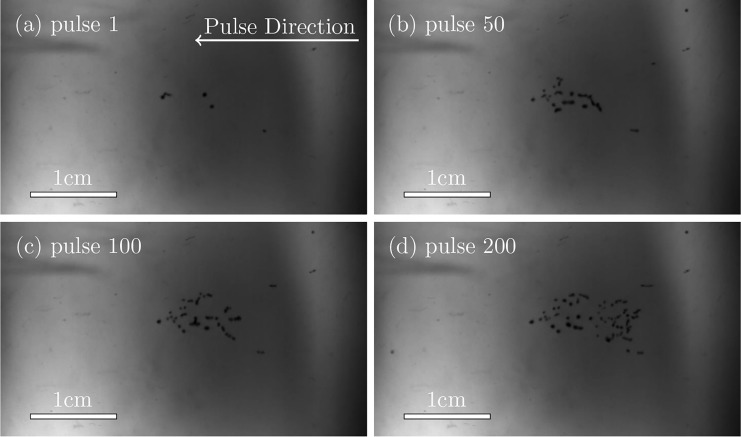
One of the main questions regarding tissue injury in SWL concerns why it takes so many (∼1000) shock waves to initiate significant tissue injury, as observed for example, by Bailey et al.6 This time also corresponds to the onset of the acoustic signatures of cavitation in pig kidneys in vivo.6,41 Recent experiments, investigating cavitation in polyacrylamide and agar gels show a similar delay (Figs. 1 and 2). The principal observations that motivate the present analysis are that bubbles become visually active at multiple though few sites during the initial pulses and that new cavities become apparent, each suddenly, over the course of hundreds of bursts, similar to what is deduced in pig kidney tissues during a SWL treatment.6 Furthermore, once active the bubbles are all of roughly the same size; they seem to share a similar maximum radius upon delivery of subsequent acoustic waves. To assess potential mechanisms leading to these observations, we develop a Rayleigh–Plesset-like bubble dynamics model with material properties based on independent quantification of the material properties of agar and polyacrylamide gels, including models for viscous dissipation, strain hardening, material fatigue, and fracture.
FIG. 1.
Bubbles in polyacrylamide gel. The imaged region is 5.41 cm × 2.48 cm. The BWL pulse has 20 cycles with base frequency 335 kHz, peak amplitude of 7.51 MPa and repeats at 200 Hz. Images are shown at times 10 cycles into the labeled pulse number.
FIG. 2.
Bubbles in agar gel. The imaged region is 4.24 cm × 2.48 cm. The BWL pulse has 20 cycles with base frequency 335 kHz, peak amplitude of 7.51 MPa and repeats at 200 Hz. Images are shown at 10 cycles into the pulse number as labeled.
D. Organization of this paper
The overarching hypothesis guiding the investigation is that during the initial pulses, some combination of viscous and elastic resistance confines the bubble growth. A bubble-dynamics model that incorporates material properties known to be important in similar gels is developed in Sec. II. Two constitutive models are motivated and implemented, with and without strain hardening as appropriate for each gel considered. Two damage mechanisms are proposed in Sec. IV: one is based on the widely used Griffith's fracture criterion, appropriate for agar gels; the other is based on observed maximum allowed stretch ratio, appropriate for polyacrylamide gels. When damage conditions are met, they predict rapidly growing damage volume, which is assumed to disrupt the gel's elastic and viscous characteristics. The driving BWL pressure pulse is based upon the waveform measurements described in Sec. V. It is shown in Sec. VI that with independently measured material properties, in conjunction with a standard material fatigue model due to cyclic loading, the basic experimental observations are reproduced. The bubble response to BWL and SWL pulses is compared in Sec. VII. Conclusions and implications are summarized in Sec. VIII.
II. BUBBLE DYNAMICS WITH STRAIN HARDENING
Though the bubbles might appear to be densely positioned in space in Figs. 1 and 2, this is in part an artifact of the two-dimensional projection of bubbles distributed within the transparent three-dimensional material. The cloud is approximately axisymmetric, so the bubbles seen in the images are distributed along the line of sight over a depth comparable to the observed vertical extent. Even at their greatest expansion and density, void fractions evaluated in an area of 1 cm × 1 cm corresponding to the center of bubble activity in the two-dimensional images are only about 6%. We therefore consider a single spherical bubble in an infinite material, which before damage is homogeneous and isotropic. This will be an especially good approximation when the bubbles are in their nascent stages of development.
The material stress is described by a nonlinear Kelvin–Voigt model, for which the elastic and viscous stresses sum as
| (1) |
The material is hyperelastic under the assumptions that (i) the elastic response is reversible, (ii) the stress depends only on the current strain, (iii) the material is isotropic, and (iv) the material is effectively incompressible. In this case, a strain energy density U determines the elastic stress tensor42
| (2) |
where I1, I2, and I3 are the principal invariants of the left Cauchy–Green tensor for deformation gradient . For an incompressible material, , so I3 = 1 and Eq. (2) becomes
| (3) |
We consider two models for U, both of which are commonly used to represent soft tissue-like materials and are motivated and parameterized for the specific gels we consider in Sec. III: the neo-Hookean model with
| (4) |
where η is the shear modulus, and the Fung model,43,44
| (5) |
where η and α are material properties. The Fung model Eq. (5) simplifies to the neo-Hookean model Eq. (4) in the limit of small (I1 − 3), so η in the Fung model can be considered the low-strain shear modulus, as described in more detail in Sec. III and the Appendix. The strain energy function U is only a function of the first principal invariant I1 for the models we consider, so Eq. (3) simplifies to
| (6) |
Both models have a simple form for the Cauchy stress when it is expressed for an incompressible material:
| (7) |
where p is the hydrostatic pressure, and
| (8) |
The viscous stress is purely deviatoric and is taken to be linearly related to the strain rate, so
| (9) |
where μ is the viscosity and u is the velocity.
Assuming spherical symmetry and neglecting the bubble-interior low-density gas dynamics, the governing equations can be simplified in the usual way18 to
| (10) |
where ρ is the density, and u is the radial velocity.
For the elastic contribution to the stress tensor, symmetry dictates that is diagonal, with components in spherical coordinates45
| (11) |
where r = r(ro, t) is the current position corresponding to stress-free reference configuration ro, R(Ro, t) is the bubble radius given reference-configuration bubble radius Ro, and is its time rate of change. Since for an incompressible material,
| (12) |
which integrates to
| (13) |
where the condition corresponds to having r = R at the bubble surface. Thus, the radial velocity is
| (14) |
and the first principal invariant of the left Cauchy–Green tensor B is
| (15) |
From Eq. (7), the corresponding contribution to the elastic stress tensor is
| (16) |
where is related to the hydrostatic stress p by28
| (17) |
The viscous contribution to the stress tensor based on Eq. (9) is
| (18) |
As appropriate for a nearly incompressible medium, dissipation associated with dilatation is neglected.46
Integrating Eq. (10) from the bubble radius r = R to (Ref. 18) r → ∞ yields
| (19) |
which now includes the time-dependent far-field pressure p∞(t). This is approximately uniform in the present applications since acoustic wavelengths (≈4.4 mm) are long relative to the bubble size (≈0.1 mm). In Eq. (19), S is the surface tension, and the internal bubble pressure pB is related to the bubble volume assuming an isentropic process
| (20) |
where pv is the vapor pressure, γ = 1.4 is the ratio of the specific heats, and pB,o is the equilibrium bubble pressure for R = Ro:
| (21) |
The final term in Eq. (19) includes all the effects of elasticity,
| (22) |
where from Eq. (13). By defining β = r/ro and recognizing that
| (23) |
Eq. (22) with becomes
| (24) |
which is a preferred form for its simplicity. For a neo-Hookean material, Eq. (24) can be integrated directly to obtain
| (25) |
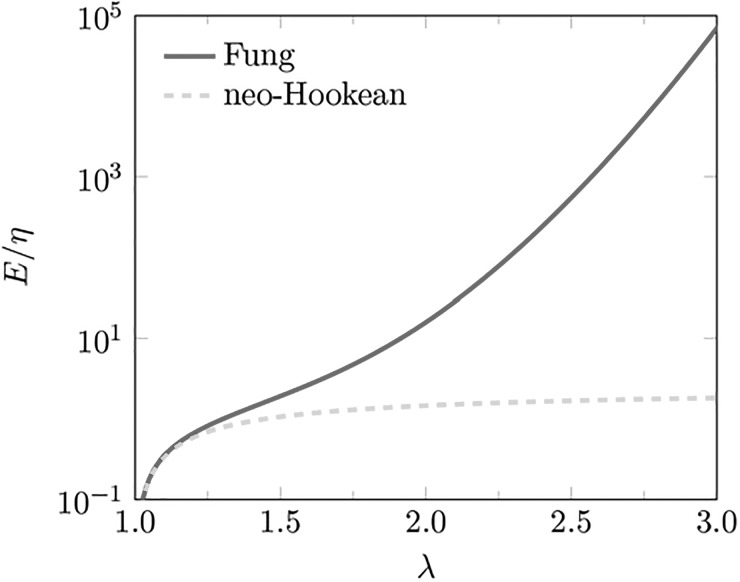
for the Fung model an adaptive quadrature is used to approximate the integral numerically up to the double-precision. The obvious and significant effect of the strain hardening in the Fung model can be seen by comparing E for different stretch ratios λ in Fig. 3.
FIG. 3.
(Color online) Confinement effect of elasticity vs stretch ratio for the Fung — (red) and neo-Hookean - - - (green) models.
First-order compressibility effects (based on a Mach number expansion in ) are added following the Keller–Miksis approach20,27,47
| (26) |
where c is the sound speed, and
| (27) |
We confirm that first-order compressibility effects obtained in this approach match those that would be obtained more rigorously following the matched asymptotic analysis by Yang and Church27 for both neo-Hookean and Fung models. In the absence of strain hardening, which corresponds to the neo-Hookean model, the current formulation Eq. (26) recovers the model developed by Gaudron et al.28 for polyacrylamide gel.
Although initial void sizes cannot be measured in the current gels, they are expected to have a distribution between 0.01 and 10 μm (Refs. 48 and 49). In Sec. VI, we will typically assume an initial radius of Ro = 0.1 μm, though the conclusions are insensitive to this choice. Since vapor pressure will be small (pv < 0.1 MPa) relative to the other pressures in Eq. (18), it is neglected. A small amount of gas is expected to be transferred into the bubble from the surrounding medium due to rectified diffusion,50,51 which is re-absorbed in the time (5 ms) between subsequent BWL bursts.52 Thus, for our purposes, we neglect mass diffusion, assume no change in Ro, and focus on viscous effects, elastic effects, and damage all of which seem to be of primary importance for the present regimes and materials. This assumption is further supported by the observations to which we compare. Residual bubbles, such as would be expected if significant gas diffused into the bubbles, are not seen between the application of BWL burst, so any gas exchange is expected to be small.
The sound speed of hydrogels are generally very close to water; thus, we take c = 1480 m/s. The surface tension of hydrogels are likewise similar to water, so we take S = 0.073 N/m (Ref. 53). Equation (26) is solved with an adaptive fifth-order Cash–Karp Runge–Kutta scheme,54 with initial conditions
| (28) |
III. MATERIAL PROPERTIES FOR GEL PHANTOMS
Hydrogels, such as the tissue phantoms in Figs. 1 and 2, consist of a sparse polymer network filled with a solvent of mostly water. Their elastic behavior has been studied, and is understood to depend upon many factors, including concentration and how the polymer chains are interlinked. Microindentation indicates Young's moduli are 175 kPa for the stiffer 2% agar and 30 kPa for the 5% polyacrylamide gels.31,55 For larger deformations, torsion tests show distinct strain-hardening for agar gel,56 which provides sufficient data to estimate α = 1 in Eq. (5), as described in the Appendix. In contrast, polyacrylamide gels display linear stress-strain behavior before rupture, and are therefore represented with the neo-Hookean model.57,58
The mass densities of both gels are close to that of water. Given the densities of water (ρ = 1000 kg/m3), agar (ρ = 1640 kg/m3), and acrylamide (ρ = 1130 kg/m3) (Ref. 59), yields ρ = 1012.8 kg/m3 for 2% agar and ρ = 1006.5 kg/m3 for 5% polyacrylamide gel.
There are no reported measurements of viscosity at our specific conditions, which are challenging because they include both high strains and high strain rates. However, there is sufficient data available to enable us to select reasonable ranges of values to assess the potential importance of viscous dissipation in Sec. VI. Assuming the same Kelvin–Voigt description we employ, Catheline et al.33 used transient elastography measurements of shear-wave speed at 400 Hz to deduce viscosity μ = 0.22 Pa s for agar. These low frequency measurements are complemented by measurements of shock attenuation in ballistic gelatin, which is a similar hydrogel tissue-mimicking phantom made of gelatin powder and water. Liu et al.34 report μ = 1 Pa s for the strain rates up to 5.2 × 10⁴ s–1, also assuming a Kelvin–Voigt model. These rates match those anticipated in cavitation, although at smaller strains. Typically, higher viscosities are measured for higher strains,60,61 up to the failure point. Thus, we take these values as lower bounds for the present conditions. Other measurements suggest significantly higher viscosities. Dynamic indentation measurements suggest that the viscosity for agar gel varies between μ = 5 and 900 Pa s for frequencies in the range 20–200 Hz (Ref. 35). Similarly, large deformation torsion experiments suggest that the viscosity for polyacrylamide gel varies between μ = 1 and 300 Pa s for the frequency range 0.01–30 Hz (Ref. 36).
In Sec. VI, we consider the behavior for this whole range of μ from 0.001 to 10.0 Pa s for both polyacrylamide and agar gels. Fortunately our conclusions do not hinge on the specific values. Indeed, assuming any of the values reported does not fundamentally alter our principal findings. It should also be recognized that there is no expectation that a single viscosity parameter could fully describe the dissipative behavior of the gels. The key fact we rely upon is that the gel is expected to be significantly dissipative, with an effective viscosity that far exceeds that of water (μ = 0.001 Pa s) in all deformation regimes.
IV. DAMAGE MODEL
A. Criteria for the onset of damage
The two criteria utilized to specify the onset of damage are introduced in the following subsections. The first criterion is based on Griffith's theorem, which is an energy based threshold mechanism, and appropriate, as we describe in the following, for the agar gel. The other is an ultimate strain limit that is based upon the gel microstructure, which is used to describe the polyacrylamide gel, which is likewise based on reported results discussed subsequently.
1. Agar failure: Griffith's theorem
Elastic materials store energy when deformed, and this energy provides the work that can reversibly return them to their initial configuration when applied stress is released. However, there is a finite amount of energy that a material can store, beyond which it fails via fracture. This limit corresponds to the energy required to generate new surfaces (e.g., cracks), and the corresponding threshold energy between these regimes constitutes Griffith's criterion: a crack will form and propagate when the elastic strain energy released by crack growth exceeds the surface energy of the new crack.62,63 Fracture toughness G is the corresponding material property that quantifies a material's resistance to fracture. An accepted quasi-static fracture toughness of G = 6.5 J/m2 is used for the agar gel,64 though again our principal conclusions are not strongly sensitive to this particular value.
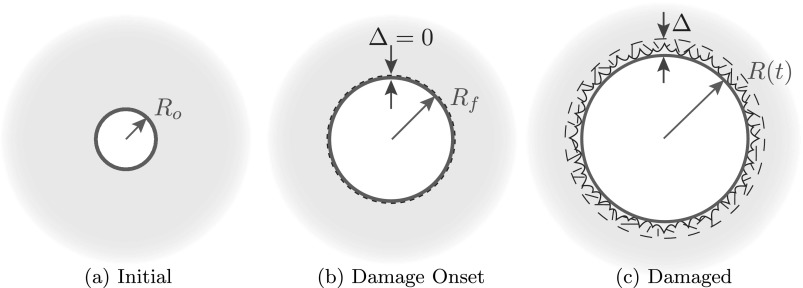
By this model, cracks initiate when a bubble grows from its initial radius Ro [Fig. 4(a)] to the onset of fracture at Rf [Fig. 4(b)]. However, subsequent crack geometries cannot be described just by an energy balance. Since no long cracks are obvious in the visualization, we assume that fracture damage is localized near the bubble, in some number of small damage features. The local details of fracture are likely to disrupt the spherical symmetry, though this is not prominent in the visualization either, so consistent with our overall description, we homogenize this damaged region into a Δ-thick spherical layer of damaged material beyond the bubble [Fig. 4(c)]. This assumption is expected to apply for the majority of bubbles that seem to remain spherical as in Figs. 1 and 2.
FIG. 4.
(Color online) Schematic of bubble growth with a fracture-like damage model. Ro is the initial bubble radius, Rf is the radius at which fracture occurs initially, R is the bubble radius at time t, and Δ is the thickness of the damaged material.
For this geometry, the stored strain energy is
| (29) |
and the energy release as the crack grows is
| (30) |
where A = πR2 is the surface area of the bubble.29,30 With λ = R/Ro representing the stretch ratio at the bubble surface,
| (31) |
with λd and β appearing as dummy variables. The energy released increases with λ, and fracture occurs when it reaches fracture toughness G. Thus, the resulting critical stretch ratio λf = Rf/Ro is30
| (32) |
with E in Eq. (31) embodying the elastic behavior of the specific material. For a neo-Hookean material Eq. (4),
| (33) |
The corresponding λf (or Rf) for the Fung model is evaluated numerically for any fracture toughness G, elastic parameter η, and initial cavity radius Ro. Some results for this are tabulated in Table I for Ro = 0.01 to 1 μm. Over this large range, Griffith's theorem predicts only a modest variation of λf, from λf = 1.45 to 3.05, in agreement with experiments for agar gel.30,56 The primary initial condition we consider, Ro = 0.1 μm, yields λf = 2.2, so the onset of fracture is Rf = 0.22 μm in most cases. Applying Griffith's theorem with fracture toughness as measured under quasi-static conditions, where viscous effects are negligible, constitutes a necessary assumption if we are to use available estimates of fracture toughness in our dynamic model. Extension of this to viscoelastic solids under dynamic loading would presumably allow a more accurate measure of the onset of fracture and improve our damage model.
TABLE I.
The fracture stretch ratio λf based on Eq. (32) for the Fung model Eq. (5) with α = 1, G = 6.5 J/m2 for different shear moduli η and initial cavity radius Ro.
| η (Pa) | |||||
|---|---|---|---|---|---|
| Ro (μm) | 102 | 103 | 104 | 105 | 106 |
| 1.0 | 2.65 | 2.41 | 2.16 | 1.85 | 1.45 |
| 0.1 | 2.86 | 2.65 | 2.41 | 2.16 | 1.85 |
| 0.01 | 3.05 | 2.86 | 2.65 | 2.41 | 2.16 |
2. Polyacrylamide failure: Ultimate strain
All gels must fracture (or somehow fundamentally fail) when strain exceeds the maximum allowed stretch λf of their constituent polymer chains. Measurements for polyacrylamide gel suggest that it is this mechanism that sets the stretch ratio to be λf = 2.1 for polyacrylamide gel.65,66 Applying Griffith's theorem to polyacrylamide gel Eq. (33), with G reported between 2 and 3.1 J/m2 (Ref. 67) for Ro = 0.001 to 1 μm, suggests λf between 9.9 and 122.5. Thus, polyacrylamide gel is expected to fail based on its particular microstructure rather than the Griffith's theorem energy balance since its constituent molecules are disrupted before the Griffith threshold is reached.
B. Damage zone thickness
Since we are particularly interested in how subsequent bubble dynamics are affected by damage, we also need to represent the effect of failure beyond its onset. For this, we assume that damage is localized to the neighborhood of the expanding void, and constrained by the same spherical symmetry of the bubble dynamics model. For both gel materials, when the bubble radius R ≥ Rf, we assume newly formed damage of thickness , measured from the current bubble radius. The boundary between the damaged and undamaged zones is thus at , and corresponds to λ = λf when damage is forming. Using Eq. (13), which can be inverted to determine the reference radius ro(r) for material currently at radius r, this condition corresponds to
| (34) |
which can be solved for the time dependent damage thickness with respect to the current bubble radius. Thus, new damage thickness is
| (35) |
where is the stretch ratio at the bubble surface. The overall damaged volume is tracked in time and increased whenever , where Δ is the maximum damage thickness up to the current time. The extent of damage is thus preserved from oscillation to oscillation.
In the dynamic model, the lack of elastic resistance of damaged material is accounted for by excluding the damaged region in the integration bounds of Eq. (22):
| (36) |
In addition, the viscosity of the damaged material is reduced to the viscosity of the solvent, in this case water. The effects of this damage on bubble evolution are reported in Sec. VI.
C. Fatigue damage with stress softening
Cyclic large deformation of gels such as we consider is expected to lead to stress softening due to fatigue, which weakens the material.68–70 We shall see in Sec. VI that in many cases the initial loading is insufficient to cause damage based on thresholds described in Sec. IV A. However, for these same loadings, the material is expected to degrade such that multiple pulses are required for material failure as would correspond to the observed behavior.
Several studies of hydrogels support such a mechanism. Martins dos Santos et al.70 quantified fatigue due to strain-controlled loading in agar gels and observed that the maximum stress resistance to compression decreases by about 50% for maximum strain of 22.8%, and 75% of the ultimate strain after 1000 cycles. Stress softening has also been reported for synthetic biopolymers used in medical devices.71–73 Ultra-high molecular weight polyethylene shows distinct stress softening due to cyclic loading.74 Similarly, fatigue has been shown in tests of soft tissues. Schulman and Bader75 reported a 50% decrease in ultimate tensile strength under cyclic loading for human extensor digitorum longs tendons. Several studies also reported fatigue phenomenon in cardiovascular tissues.76–79
Complicated phenomenological fatigue models have been proposed for fatigue damage of soft tissues with stress softening.80 However, specific quantitative models for stress softening under cyclic loading for agar and polyacrylamide are not currently available due to the lack of experimental data. Still, the fact that they will fatigue is certain, and fortunately a simple standard model is sufficient for our purposes. Fatigue under cyclic loading is assumed to decrease both viscous and elastic stresses with respect to the undamaged state by a factor α,75,80 which increases with each loading cycle from an initial α = 0 up to α = 1, at which point the gel affords no resistance, though in our cases the other damage mechanisms become activated before α = 1 would be achieved, switching from the slow fatigue to fast fracture mechanism. To incorporate fatigue modeled in this way into the bubble dynamics model, Eq. (27) is modified to include α as
| (37) |
Since fatigue is a probabilistic phenomenon, depending for example, on the local polymer network at each nucleation site, the specific rate at which α increases is expected to be different at each cavitation site leading to the typical scatter observed in fatigue experimental data.69 This is proposed here for the seemingly random appearance of new bubbles as variability in the reducing confinement due to fatigue allows fracture damage to occur at different sites at different times.
V. DRIVING PRESSURE PULSE
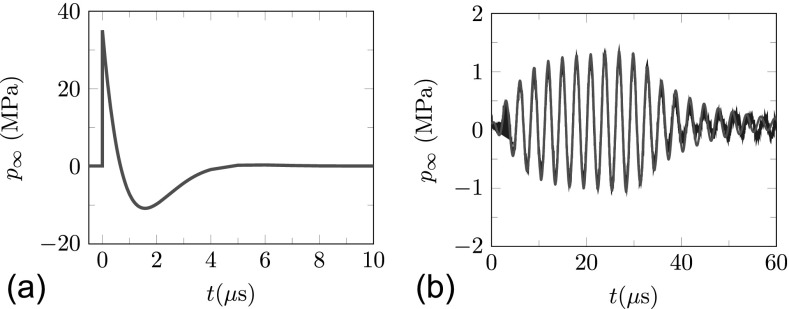
The model we consider is general, and could be used for any strong pressure signal. We consider two waveforms: a standard SWL pulse and a BWL pulse. The SWL profile is shown in Fig. 5(a) and represented by
| (38) |
where pamb = 0.1 MPa is the ambient pressure, is the peak positive pressure, and , which were chosen to match the waveform in a Dornier HM3 lithotripter.81,82 The BWL pulse is based upon focal pressure measurements of a BWL transducer using a fiber-optic hydrophone in a degassed water bath.64 The measured BWL pressure pulse is shown in Fig. 5(b) and is well-fitted by
| (39) |
where
| (40) |
is introduced to account for the asymmetric peak amplitude. The shown signal has n = 10 cycles, principal frequency of f = 335 kHz, peak negative pressure of 1 MPa and was used to set the ring-up and ring-down time for the pulse envelope τ1 = 5 μs and τ2 = 12 μs, respectively, in Eq. (39). The treatments of the gels in Figs. 1 and 2 and other animal studies3 used the same BWL source but operated at a higher intensity. Since it was not possible to provide an accurate measure of the signal at these higher pressures, extrapolation was used to estimate 7.51 MPa and 10.09 MPa. Full details and justification of this procedure are reported elsewhere. The number of cycles in the corresponding experiments did not show significant sensitivity to n ranging from n = 10 to 20; our present conclusions are insensitive to our typical choice of n = 10.
FIG. 5.
(Color online) Driving pressure pulse: (a) SWL pulse with maximum of 35 MPa and minimum of −10 MPa; (b) BWL pulse with n = 10 cycles, f = 335 kHz and 1 MPa; modeled based on Eq. (39) — (red), measured experimentally — (blue).
VI. BWL MODEL PREDICTION RESULTS
A. Polyacrylamide gel
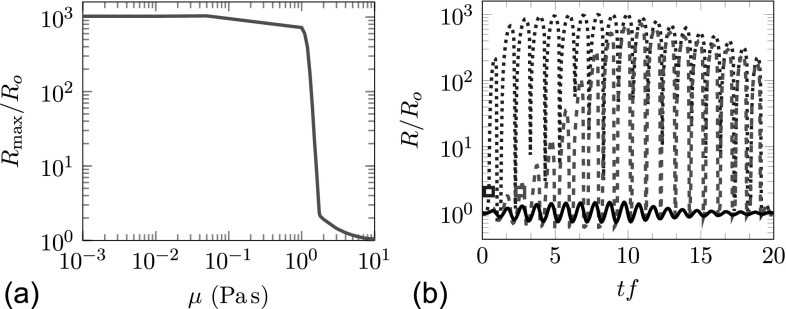
We first consider the polyacrylamide gel, which is simpler in the sense that it does not show strain hardening before fracture, the fracture itself initiates based on a simple strain criterion, and the elasticity is relatively weak. Given the uncertainty of the viscosity discussed in Sec. III, we also consider a wide range of viscosities between 0.001 and 10.0 Pa s. The maximum radius reached for this range is shown in Fig. 6(a). We see that the damage criterion λ > λf = 2.1, is not satisfied for μ > μc = 1.8 Pa s, so even a viscosity that is low compared some measurements for polyacrylamide suppresses the bubble motion sufficiently to preclude damage. Below this critical value, however, the damage is significant and bubbles grow to nearly 1000 times their initial size. Elastic confinement plays little role in this case, which can be anticipated since even the maximum elastic confinement at λf, as calculated from Eq. (25), is E = 15.2 kPa, which is only about 1/500 times the peak negative BWL pressure.
FIG. 6.
(Color online) Predicted bubble behavior in polyacrylamide gel: (a) the maximum bubble radius achieved during one BWL pulse for a wide range of possible gel viscosities (see Sec. III); and (b) the bubble radius history for μ = 0.01 Pa s · · · (blue), μ = 1.0 Pa s – – (red), and μ = 3.0 Pa s —, the rectangles correspond to the onset of damage.
Illustrative R(t) histories are shown in Fig. 6(b). For μ = 0.01 Pa s, viscosity has little effect and the bubble radius R(t) increases by a factor of about 1000 almost immediately. For μ = 1.0 Pa s, the bubble growth is initially suppressed. However, during the second cycle, the damage model activates, which reduces subsequent resistance and allows bubbles to grow still larger and cause still more damage on each subsequent cycle until it is essentially unconfined. For μ > μc = 1.8 Pa s, no damage occurs, and the bubble stays strongly confined, as shown for μ = 3.0 Pa s. This is the most likely scenario based on the viscosity estimates for the polyacrylamide gels discussed in Sec. III.
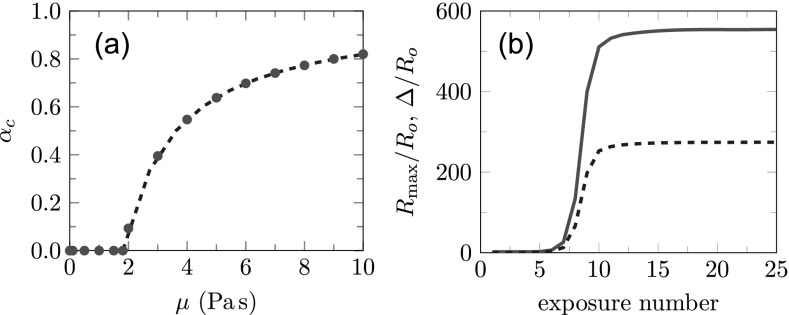
Still, even when the confinement is such that the bubble remains small, fatigue-induced material degradation is expected upon repeated BWL pulses, as discussed in Sec. IV C. Since elastic contribution to the total stress is small for polyacrylamide gel, the critical αc can be estimated to be
| (41) |
which is plotted in Fig. 7(a) along with results from the corresponding numerical solution, which includes elastic effects. When this critical α is reached, presumably within around 1000 pulses based on the gel fatigue experiments discussed in Sec. IV C, significant growth occurs as shown for μ = 3.0 Pa s and α = 0.4 in Fig. 7(b). To construct this plot, α greater than αc is chosen such that λ = 1.02 λf is reached during the first subsequent exposure, which leads to rapidly increasing damage and unconstrained bubble growth after only about seven more exposures. This is consistent with the rapid appearance of bubbles from unseen (presumably sub-pixel-size) defects in the gels. By the tenth pulse, both radii reach a long-time behavior. We note, however, that the final Rmax ≈ 554Ro after 25 pulses is still smaller than Rmax ≈ 1026Ro reported for μ = 0.01 Pa s in Fig. 6, which indicates that the high viscosity of the surrounding medium outside the damaged zone still provides some confinement.
FIG. 7.
(Color online) Fatigue behavior of polyacrylamide gel: (a) The critical stress softening αc for different gel viscosities: bubble dynamics model • (red) and – – (blue) Eq. (41); and (b) The maximum bubble radius — (red), and damage zone thickness – – (blue) for μ = 3.0 Pa s and α = 0.4 after stress softening with exposures.
B. Agar gel
We can anticipate that additional factors will dictate the behavior of the agar gel. At λf = 2.22, as indicated by Griffith criterion indicates in Sec. IV A 1, the maximum elastic confinement from (24) is E = 3.22 MPa, which is comparable to the negative pressure peaks of BWL pulse 7.51 MPa. Thus we expect elasticity to play a role in the bubble response. The bubble dynamics are again considered for a range of viscosities. For μ = 0.01 Pa s elasticity is capable of confining the bubble growth sufficiently to preclude damage during the first two cycles (Fig. 8). However, subsequently R(t) does exceed Rf leading to run-away damage. Interestingly, even for the much larger μ = 1.0 Pa s, also shown in Fig. 8, the damage model also activates yet bubble growth remains modest, with Rmax/Ro = 12.1. The stiffness and particularly the strain hardening of the agar are thus protective. Finally, for μ = 3.0 Pa s the radius R(t) stays below the damage onset threshold. The corresponding Rmax for the full range of viscosity is also plotted in Fig. 8(b), and it is clear that the requisite viscosity μc = 1.5 Pa s to suppress run-away damage and bubble growth is smaller than for polyacrylamide gel. The corresponding amount of strain softening necessary for fatigue to initiate fracture-like failure is shown in Fig. 8(c). The increased elastic confinement for agar gel causes deviation from viscosity-only model Eq. (41).
FIG. 8.
(Color online) Predicted bubble behavior in agar gel: (a) the bubble radius history for μ = 0.01 Pa s · · · (blue), μ = 1.0 Pa s – – (red), and μ = 3.0 Pa s —, the rectangles correspond to the onset of damage; (b) the maximum bubble radius achieved during one BWL pulse for a wide range of possible gel viscosities (see Sec. III); and (c) the critical stress softening αc vs viscosity; bubble dynamics model • (red) and – – (blue) Eq. (41).
VII. SWL AND COMPARISON WITH BWL
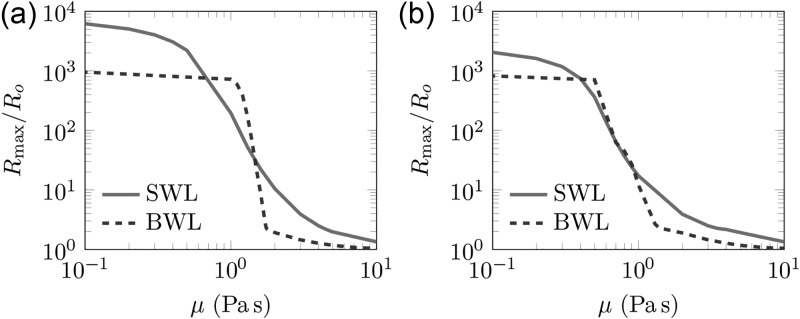
In this section, we investigate the model response to the SWL pulse and compare it with BWL results. The maximum bubble radius achieved during one pulse for a range of possible effective viscosities between μ = 0.1 and 10.0 Pa s is shown in Fig. 9. A smaller maximum bubble radius corresponds to a smaller damage thickness within our damage model, and might indicate less potential tissue damage in clinical lithotripsy treatments as well. For SWL, the critical no-damage viscosities are μc = 4.67 and 3.67 Pa s for polyacrylamide and agar gels, respectively. The larger μc compared to BWL suggests that αc for a given viscosity based on Eq. (41) is lower for the SWL pulse. Consequently, less fatigue is needed for SWL compared to BWL. While the current results suggest that fewer pulses are needed to initiate damage due to fatigue in SWL, damage in a treatment will depend on many factors, including specific amplitudes and number of pulses needed for stone comminution. A better understanding of BWL's ability to break kidney stones is therefore required to make a fair comparison.
FIG. 9.
(Color online) The maximum bubble radius for polyacrylamide and agar gels for a range of possible effective viscosities.
VIII. SUMMARY AND ADDITIONAL DISCUSSION
A high-speed camera showed particular bubble activity inside polyacrylamide and agar gels subjected to BWL pulses:
-
•
bubble activation at multiple sites during the initial pulses, with
-
•
further continuous appearance of suddenly large bubbles at new locations through the course of the observations
A Rayleigh–Plesset-type bubble dynamics model with a damage mechanism is developed to evaluate potential mechanisms of viscous confinement, elastic confinement, fracture-like damage and fatigue in both gel phantoms. The main features of the model include:
- constitutive models based on independent experimental data for the two materials:
-
(i)polyacrylamide (linear): neo-Hookean model, and
-
(ii)agar (strain hardening): Fung model;
-
(i)
- criteria for onset of damage based on reported results for each material:
-
(i)polyacrylamide: ultimate strain, and
-
(ii)agar: Griffith's fracture theorem;
-
(i)
incorporation of damage in the bubble dynamics; and
stress softening based upon a simple standard approach for fatigue under cyclic loading
The resulting model reproduces the key features of the experimental observations. It suggests that a combination of viscous and elastic resistance is capable of confining the bubble growth. For polyacrylamide, the main mechanical resistance comes from viscosity, while elastic resistance is significant for agar due to its strain hardening. Above a critical viscosity, within the range of those reported for these materials, the bubble growth is suppressed such that the damage model does not activate, and consequently no immediate damage or large bubble growth occurs. For these range of viscosities, the amount of fatigue driven stress softening required to activate the damage model is predicted, and verified by the bubble dynamics model.
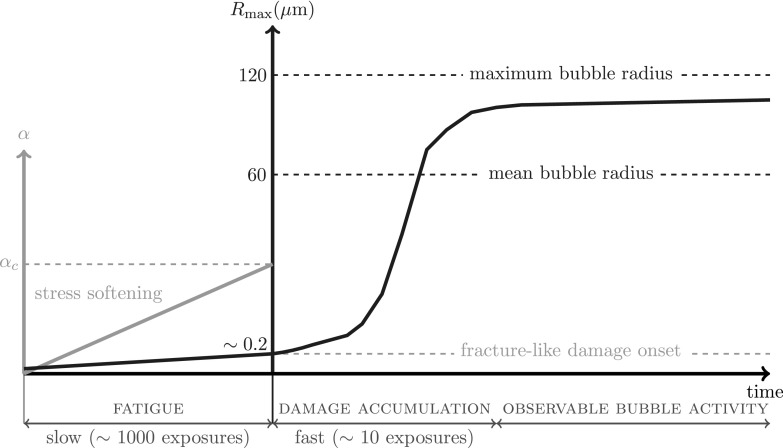
The overall mechanism, consistent with the observations that motivated this model, is summarized in Fig. 10. Initially, some nuclei are large enough, or defects make the material weak enough, such that some small number of bubbles appear with the first burst. Subsequently, bubbles appear after cyclic fatigue increases α to αc. Once this occurs, a fracture mechanism becomes activated. Unlike the fatigue, which is a slow accumulation of modest damage, both of the fracture criteria we introduced in Sec. IV A lead to an almost immediate and complete weakening of the material. This process completes to its ultimate bubble size after only a few cycles, but in this same period the bubbles become nearly unconfined. The stochastic character of the fatigue mechanisms explains their continuous appearance as different sites reach the critical point at different times; the rapidity of the fracture mechanism explains the apparent sudden (seemingly immediate) appearance of newly large bubbles during a treatment.
FIG. 10.
(Color online) Schematic of bubble activation process by focused ultrasound bursts in the presence of fracture-like and fatigue damage mechanisms. The mean and maximum bubble radii in the experimental images such as Figs. 1 and 2 (in Ref. 31) are about 60 and 120 μm, respectively.
Despite the apparent success of this model at explaining these basic observations, it should be reiterated that this model was developed precisely because diagnostic challenges currently preclude direct confirmation of these mechanisms. Additionally, better parameterized mechanical models that include micromechanical mechanisms beyond what can be represented in the simple Kelvin–Voigt model, would probably be necessary for close comparison with specific experimental observations. They are presented as a reasonable explanation given the known dynamics of bubble voids and the available properties of these gels used to make the phantoms. In tissues, the delay might alternatively be explained by additional mechanisms, such as the lack of nucleation sites83 or accumulation due to shear.84
ACKNOWLEDGMENTS
The authors are grateful for fruitful discussions with T. Colonius, K. Maeda, B. Dunmire, B. Cunitz, and M. Bailey. This work was supported by the National Institutes of Health (NIH) NIDDK Grant No. P01-DK043881.
APPENDIX: PARAMETERIZING THE FUNG MODEL FOR AGAR
The shear measurements of Barrangou et al.56 are used to estimate α in the Fung model Eq. (5) for agar. For pure shear, the deformation tensor is
| (A1) |
where γ is the shear strain. The corresponding left Cauchy–Green stress tensor is
| (A2) |
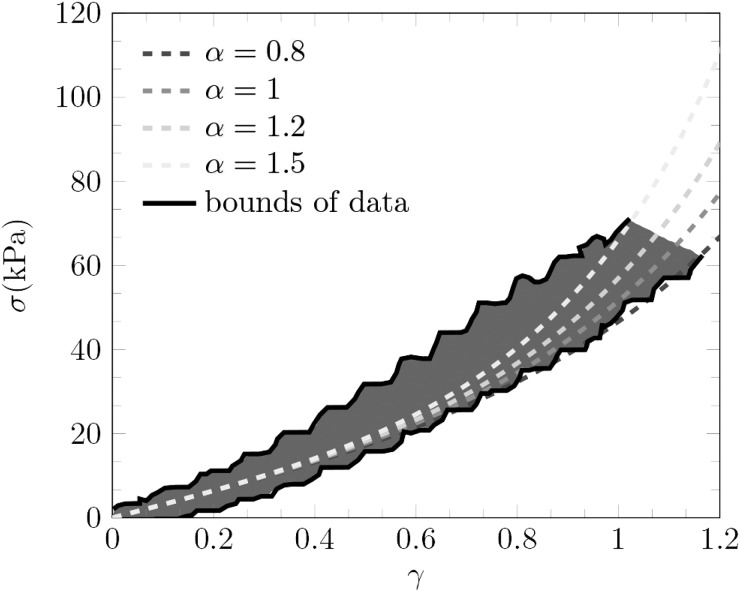
and the first invariant of B becomes I1 = γ2/2 + 3. Thus the shear stress simplifies to . The shear modulus was measured to be 31.3 kPa. A data fit to the experimental results suggests 0.8 ≤ α ≤ 1.5 for agar as shown in Fig. 11. We use α = 1 in Eq. (5), though choosing 0.8 ≤ α ≤ 1.5 does not alter our conclusions.
FIG. 11.
(Color online) Stress-strain curve for torsion experiments of agar at large strain. The black lines correspond to the bounds of the experimental data (gray region) reported in Barrangou et al. (Ref. 56) for agar measured at strain rate of 0.17 s–1.
References
- 1. Evan A. P., Willis L. R., McAteer J. A., Bailey M. R., Connors B. A., Shao Y., Lingeman J. E., Williams J. C., Fineberg N. S., and Crum L. A., “ Kidney damage and renal functional changes are minimized by waveform control that suppresses cavitation in shock wave lithotripsy,” J. Urol. 168, 1556–1562 (2002). 10.1016/S0022-5347(05)64520-X [DOI] [PubMed] [Google Scholar]
- 2. Matlaga B. R., McAteer J. A., Connors B. A., Handa R. K., Evan A. P., Williams J. C., Lingeman J. E., and Willis L. R., “ Potential for cavitation-mediated tissue damage in shockwave lithotripsy,” J. Endourol. 22, 121–126 (2008). 10.1089/end.2007.9852 [DOI] [PubMed] [Google Scholar]
- 3. Kreider W., Maxwell A. D., Cunitz B. W., Wang Y., Lee D., Sorensen M. D., Harper J. D., Sapozhnikov O. A., Khokhlova V. A., and Bailey M. R., “ In vivo cavitation thresholds and injury observations related to burst wave lithotripsy,” J. Acoust. Soc. Am. 138, 1846–1846 (2015). 10.1121/1.4933875 [DOI] [Google Scholar]
- 4. Evan A. P. and McAteer J. A., “ Q-effects of shock wave lithotripsy,” in Kidney Stones: Medical and Surgical Management ( Lippincott-Raven, Philadelphia, NY, 1996), pp. 549–570. [Google Scholar]
- 5. Shao Y., Connors B. A., Evan A. P., Willis L. R., Lifshitz D. A., and Lingeman J. E., “ Morphological changes induced in the pig kidney by extracorporeal shock wave lithotripsy: Nephron injury,” Anat. Rec. A Discov. Mol. Cell. Evol. Biol. 275, 979–989 (2003). 10.1002/ar.a.10115 [DOI] [PubMed] [Google Scholar]
- 6. Bailey M. R., Pishchalnikov Y. A., Sapozhnikov O. A., Cleveland R. O., McAteer J. A., Miller N. A., Pishchalnikova I. V., Connors B. A., Crum L. A., and Evan A. P., “ Cavitation detection during shock-wave lithotripsy,” Ultrasound Med. Biol. 31, 1245–1256 (2005). 10.1016/j.ultrasmedbio.2005.02.017 [DOI] [PubMed] [Google Scholar]
- 7. Leighton T. G., Fedele F., Coleman A. J., McCarthy C., Ryves S., Hurrell A. M., De Stefano A., and White P. R., “ A passive acoustic device for real-time monitoring of the efficacy of shockwave lithotripsy treatment,” Ultrasound Med. Biol. 34, 1651–1665 (2008). 10.1016/j.ultrasmedbio.2008.03.011 [DOI] [PubMed] [Google Scholar]
- 8. Maxwell A. D., Cunitz B. W., Kreider W., Sapozhnikov O. A., Hsi R. S., Harper J. D., Bailey M. R., and Sorensen M. D., “ Fragmentation of urinary calculi in vitro by burst wave lithotripsy,” J. Urol. 193, 338–344 (2015). 10.1016/j.juro.2014.08.009 [DOI] [PMC free article] [PubMed] [Google Scholar]
- 9. Kreider W., Maxwell A. D., Cunitz B. W., Wang Y.-N., Lee D., Maeda K., Movahed P., Khokhlova V. A., Bailey M. R., Colonius T., and Freund J., “ Ultrasound imaging feedback to control kidney injury caused by burst wave lithotripsy,” in 33rd World Congress of Endourology & SWL, London, UK, 2015. [Google Scholar]
- 10. Wang Y.-N., Kreider W., Maxwell A., Lee D., Park J., Cunitz B., Sorensen M., Handa R., Bailey M., and Khokhlova V., “ The use of Magnetic Resonance Imaging to evaluate injury caused by burst wave lithotripsy for stone comminution,” in 33rd World Congress of Endourology & SWL, London, UK, 2015. [Google Scholar]
- 11. Roberts W. W., Hall T. L., Ives K., Wolf J. S., Fowlkes J. B., and Cain C. A., “ Pulsed cavitational ultrasound: A noninvasive technology for controlled tissue ablation (histotripsy) in the rabbit kidney,” J. Urol. 175, 734–738 (2006). 10.1016/S0022-5347(05)00141-2 [DOI] [PubMed] [Google Scholar]
- 12. Xu Z., Fowlkes J. B., Ludomirsky A., and Cain C. A., “ Investigation of intensity thresholds for ultrasound tissue erosion,” Ultrasound Med. Biol. 31, 1673–1682 (2005). 10.1016/j.ultrasmedbio.2005.07.016 [DOI] [PMC free article] [PubMed] [Google Scholar]
- 13. Wang Y. N., Khokhlova T., Bailey M., Hwang J. H., and Khokhlova V., “ Histological and biochemical analysis of mechanical and thermal bioeffects in boiling histotripsy lesions induced by high intensity focused ultrasound,” Ultrasound Med. Biol. 39(3), 424–438 (2013). 10.1016/j.ultrasmedbio.2012.10.012 [DOI] [PMC free article] [PubMed] [Google Scholar]
- 14. Khokhlova V. A., Fowlkes J. B., Roberts W. W., Schade G. R., Xu Z., Khokhlova T. D., Hall T. L., Maxwell A. D., Wang Y. N., and Cain C. A., “ Histotripsy methods in mechanical disintegration of tissue: Towards clinical applications,” Int. J. Hyperthermia 31(2), 145–162 (2015). 10.3109/02656736.2015.1007538 [DOI] [PMC free article] [PubMed] [Google Scholar]
- 15. Plesset M. S., “ The dynamics of cavitation bubbles,” J. Appl. Mech. 16, 277–282 (1949). [Google Scholar]
- 16. Rayleigh J. W. S., “ On the pressure developed in a liquid during the collapse of a spherical cavity,” Philos. Mag. 34, 94–98 (1917). 10.1080/14786440808635681 [DOI] [Google Scholar]
- 17. Plesset M. S. and Prosperetti A., “ Bubble dynamics and cavitation,” Ann. Rev. Fluid Mech. 9, 145–185 (1977). 10.1146/annurev.fl.09.010177.001045 [DOI] [Google Scholar]
- 18. Brennen C. E., Cavitation and Bubble Dynamics ( Oxford University Press, New York, 1995), p. 286. [Google Scholar]
- 19. Gilmore F. R., “ The growth or collapse of a spherical bubble in a viscous compressible liquid,” Report No. 26-4, 1952.
- 20. Keller J. B. and Miksis M., “ Bubble oscillations of large amplitude,” J. Acoust. Soc. Am. 68, 628–633 (1980). 10.1121/1.384720 [DOI] [Google Scholar]
- 21. Prosperetti A. and Lezzi A., “ Bubble dynamics in a compressible liquid. Part 1. First-order theory,” J. Fluid Mech. 168, 457–478 (1986). 10.1017/S0022112086000460 [DOI] [Google Scholar]
- 22. Allen J. S., Roy R., and Church C. C., “ On the role of shear viscosity in mediating inertial cavitation from short–pulse, megahertz-frequency ultrasound,” IEEE Trans. Ultrason. Ferroelectr. Freq. Control 44, 743–751 (1997). 10.1109/58.655189 [DOI] [Google Scholar]
- 23. Allen J. S. and Roy R. A., “ Dynamics of gas bubbles in viscoelastic fluids. I. Linear viscoelasticity,” J. Acoust. Soc. Am. 107, 3167–3178 (2000). 10.1121/1.429344 [DOI] [PubMed] [Google Scholar]
- 24. Freund J. B., “ Suppression of shocked-bubble expansion due to tissue confinement with application to shock-wave lithotripsy,” J. Acoust. Soc. Am. 123, 2867–2874 (2008). 10.1121/1.2902171 [DOI] [PMC free article] [PubMed] [Google Scholar]
- 25. Maxwell A. D., Cain C. A., Hall T. L., Fowlkes J. B., and Xu Z., “ Probability of cavitation for single ultrasound pulses applied to tissues and tissue-mimicking materials,” Ultrasound Med. Biol. 39, 449–465 (2013). 10.1016/j.ultrasmedbio.2012.09.004 [DOI] [PMC free article] [PubMed] [Google Scholar]
- 26. Vlaisavljevich E., Maxwell A., Warnez M., Johnsen E., Cain C., and Xu Z., “ Histotripsy-induced cavitation cloud initiation thresholds in tissues of different mechanical properties,” IEEE Trans. Ultrason. Ferroelectr. Freq. Control 61, 341–352 (2014). 10.1109/TUFFC.2014.6722618 [DOI] [PMC free article] [PubMed] [Google Scholar]
- 27. Yang X. and Church C. C., “ A model for the dynamics of gas bubbles in soft tissue,” J. Acoust. Soc. Am. 118, 3595–3606 (2005). 10.1121/1.2118307 [DOI] [PubMed] [Google Scholar]
- 28. Gaudron R., Warnez M. T., and Johnsen E., “ Bubble dynamics in a viscoelastic medium with nonlinear elasticity,” J. Fluid Mech. 766, 54–75 (2015). 10.1017/jfm.2015.7 [DOI] [Google Scholar]
- 29. Diani J., “ Irreversible growth of a spherical cavity in rubber-like material: A fracture mechanics description,” Int. J. Fracture 112, 151–161 (2001). 10.1023/A:1013311526076 [DOI] [Google Scholar]
- 30. Gent A. N. and Wang C., “ Fracture mechanics and cavitation in rubber-like solids,” J. Mater. Sci. 26, 3392–3395 (1991). 10.1007/BF01124691 [DOI] [Google Scholar]
- 31. Movahed P., Kreider W., Maxwell A. D., Bailey M. R., and Freund J. B., “ Ultrasound induced bubble clusters and tunnels in tissue-mimicking agarose phantoms,” (unpublished) (2016). [DOI] [PMC free article] [PubMed]
- 32. Hamaguchi F. and Ando K., “ Linear oscillation of gas bubbles in a viscoelastic material under ultrasound irradiation,” Phys. Fluids 27(11), 113103 (2015). 10.1063/1.4935875 [DOI] [Google Scholar]
- 33. Catheline S., Gennisson J.-L., Delon G., Fink M., Sinkus R., Abouelkaram S., and Culioli J., “ Measurement of viscoelastic properties of homogeneous soft solid using transient elastography: An inverse problem approach,” J. Acoust. Soc. Am. 116, 3734–3741 (2004). 10.1121/1.1815075 [DOI] [PubMed] [Google Scholar]
- 34. Liu L., Fan Y., and Li W., “ Viscoelastic shock wave in ballistic gelatin behind soft body armor,” J. Mech. Behav. Biomed. Mater. 34, 199–207 (2014). 10.1016/j.jmbbm.2014.02.011 [DOI] [PubMed] [Google Scholar]
- 35. Nayar V. T., Weiland J. D., Nelson C. S., and Hodge A. M., “ Elastic and viscoelastic characterization of agar,” J. Mech. Behav. Biomed. Mater. 7, 60–68 (2012). 10.1016/j.jmbbm.2011.05.027 [DOI] [PubMed] [Google Scholar]
- 36. Zhang J., Daubert C. R., and Foegeding E. A., “ Characterization of polyacrylamide gels as an elastic model for food gels,” Rheol. Acta 44, 622–630 (2005). 10.1007/s00397-005-0444-5 [DOI] [Google Scholar]
- 37. Lind S. J. and Phillips T. N., “ Bubble collapse in compressible fluids using a spectral element marker particle method. Part 2. Viscoelastic fluids,” Int. J. Numer. Methods Fluids 71(9), 1103–1130 (2013). 10.1002/fld.3701 [DOI] [Google Scholar]
- 38. Hua C. and Johnsen E., “ Nonlinear oscillations following the Rayleigh collapse of a gas bubble in a linear viscoelastic (tissue-like) medium,” Phys. Fluids 25(8), 083101 (2013). 10.1063/1.4817673 [DOI] [Google Scholar]
- 39. Foteinopoulou K. and Laso M., “ Numerical simulation of bubble dynamics in a Phan-Thien–Tanner liquid: Non-linear shape and size oscillatory response under periodic pressure,” Ultrasonics 50, 758–776 (2010). 10.1016/j.ultras.2010.03.002 [DOI] [PubMed] [Google Scholar]
- 40. Warnez M. T. and Johnsen E., “ Numerical modeling of bubble dynamics in viscoelastic media with relaxation,” Phys. Fluids 27(6), 063103 (2015). 10.1063/1.4922598 [DOI] [PMC free article] [PubMed] [Google Scholar]
- 41. Evan A. P., Willis L. R., Lingeman J. E., and McAteer J. A., “ Renal trauma and the risk of long-term complications in shock wave lithotripsy,” Nephron 78, 1–8 (1998). 10.1159/000044874 [DOI] [PubMed] [Google Scholar]
- 42. Bower A. F., Applied Mechanics of Solids ( CRC Press, Boca Raton, FL, 2009), p. 775. [Google Scholar]
- 43. Fung Y. C., Biomechanics: Mechanical Properties of Living Tissues ( Springer; Science & Business Media, New York, 2013. [Google Scholar]
- 44. Fung Y. C., Fronek K., and Patitucci P., “ Pseudoelasticity of arteries and the choice of its mathematical expression,” Am. J. Physiol. Heart Circ. Physiol. 237, 620–631 (1979). [DOI] [PubMed] [Google Scholar]
- 45. Arfken G. B., Weber H. J., and Harris F. E., Mathematical Method for Physicists: A Comprehensive Guide ( Academic, Oxford, 2013), p.1220. [Google Scholar]
- 46. Prosperetti A., “ A generalization of the Rayleigh–Plesset equation of bubble dynamics,” Phys. Fluids 25, 409–410 (1982). 10.1063/1.863775 [DOI] [Google Scholar]
- 47. Ainslie M. A. and Leighton T. G., “ Review of scattering and extinction cross-sections, damping factors, and resonance frequencies of a spherical gas bubble,” J. Acoust. Soc. Am. 130, 3184–3208 (2011). 10.1121/1.3628321 [DOI] [PubMed] [Google Scholar]
- 48. Gent A. N. and Lindley P. B., “ Internal rupture of bonded rubber cylinders in tension,” Proc. R. Soc. A 249, 195–205 (1959). 10.1098/rspa.1959.0016 [DOI] [Google Scholar]
- 49. Lefevre V., Ravi-Chandar K., and Lopez-Pamies O., “ Cavitation in rubber: An elastic instability or a fracture phenomenon?,” Int. J. Fracture 192, 1–23 (2014). 10.1007/s10704-014-9982-0 [DOI] [Google Scholar]
- 50. Eller A. and Flynn H. G., “ Rectified diffusion during nonlinear pulsations of cavitation bubbles,” J. Acoust. Soc. Am. 37, 493–503 (1965). 10.1121/1.1909357 [DOI] [Google Scholar]
- 51. Crum L. A., Daniels S., Ter Haar G. R., and Dyson M., “ Ultrasonically induced gas bubble production in agar based gels: Part II, theoretical analysis,” Ultrasound Med. Biol. 13(9), 541–554 (1987). 10.1016/0301-5629(87)90180-3 [DOI] [PubMed] [Google Scholar]
- 52. Epstein P. S. and Plesset M. S., “ On the stability of gas bubbles in liquid–gas solutions,” J. Chem. Phys. 18, 1505–1509 (1950). 10.1063/1.1747520 [DOI] [Google Scholar]
- 53. Chakrabarti A. and Chaudhury M. K., “ Direct measurement of the surface tension of a soft elastic hydrogel: Exploration of elastocapillary instability in adhesion,” Langmuir 29, 6926–6935 (2013). 10.1021/la401115j [DOI] [PubMed] [Google Scholar]
- 54. Press W., Teukolsky S., Vetterling W., and Flannery B., Numerical Recipes in Fortran 77: The Art of Scientific Computing ( Cambridge University Press, New York, 1992), p. 933. [Google Scholar]
- 55. Choi I. and Shield R. T., “ Second-order effects in problems for a class of elastic materials,” Z. Angew. Math. Phys. 32, 361–381 (1981). 10.1007/BF00955616 [DOI] [Google Scholar]
- 56. Barrangou L. M., Daubert C. R., and Foegeding E. A., “ Textural properties of agarose gels. I. Rheological and fracture properties,” Food Hydrocoll. 20, 184–195 (2006). 10.1016/j.foodhyd.2005.02.019 [DOI] [Google Scholar]
- 57. Chen D. T. N., Wen Q., Janmey P. A., Crocker J. C., and Yodh A. G., “ Rheology of soft materials,” Annu. Rev. Condens. Matter Phys. 1, 301–322 (2010). 10.1146/annurev-conmatphys-070909-104120 [DOI] [Google Scholar]
- 58. Livne A., Bouchbinder E., Svetlizky I., and Fineberg J., “ The near-tip fields of fast cracks,” Science 327(5971), 1359–1363 (2010). 10.1126/science.1180476 [DOI] [PubMed] [Google Scholar]
- 59. Laurent T. C., “ Determination of the structure of agarose gels by gel chromatography,” BBA-Gen. Subjects 136, 199–205 (1967). 10.1016/0304-4165(67)90064-5 [DOI] [PubMed] [Google Scholar]
- 60. Bird R. B., Armstrong R. C., Hassager O., and Curtiss C. F., Dynamics of Polymeric Liquids ( Wiley, New York, 1977), Vol. 2, p. 421. [Google Scholar]
- 61. Ishizuka O. and Koyama K., “ Elongational viscosity at a constant elongational strain rate of polypropylene melt,” Polymer 21, 164–170 (1980). 10.1016/0032-3861(80)90055-5 [DOI] [Google Scholar]
- 62. Griffith A. A., “ The phenomena of rupture and flow in solids,” Philos. Trans. R. Soc. A 221, 582–593 (1921) 10.1098/rsta.1921.0006. [DOI] [Google Scholar]
- 63. Hutchens S. B., Fakhouri S., and Crosby A. J., “ Elastic cavitation and fracture via injection,” Soft Matter 12(9), 2557–2566 (2016). 10.1039/C5SM02055G [DOI] [PubMed] [Google Scholar]
- 64. Kwon H. J., Rogalsky A. D., and Kim D., “ On the measurement of fracture toughness of soft biogel,” Polym. Eng. Sci. 51, 1078–1086 (2011). 10.1002/pen.21923 [DOI] [Google Scholar]
- 65. Foegeding E. A., Gonzalez C., Hamann D. D., and Case S., “ Polyacrylamide gels as elastic models for food gels,” Food Hydrocoll. 8, 125–134 (1994). 10.1016/S0268-005X(09)80038-6 [DOI] [Google Scholar]
- 66. Sun J. Y., Zhao X., Illeperuma W. R. K., Chaudhuri O., Oh K. H., Mooney D. J., Vlassak J. J., and Suo Z., “ Highly stretchable and tough hydrogels,” Nature 489, 133–136 (2012). 10.1038/nature11409 [DOI] [PMC free article] [PubMed] [Google Scholar]
- 67. Kundu S. and Crosby A. J., “ Cavitation and fracture behavior of polyacrylamide hydrogels,” Soft Matter 5, 3963–3968 (2009). 10.1039/b909237d [DOI] [Google Scholar]
- 68. Miner M. A., “ Cumulative damage in fatigue,” J. Appl. Mech. 12, 159–164 (1945). [Google Scholar]
- 69. Dowling N. E., Mechanical Behavior of Materials: Engineering Methods for Deformation, Fracture, and Fatigue ( Prentice Hall, Upper Saddle River, NJ, 1993). [Google Scholar]
- 70. Martins dos Santos V. A. P., Leenen E. J. T. M., Rippoll M. M., van der Sluis C., van Vliet T., Tramper J., and Wijffels R. H., “ Relevance of rheological properties of gel beads for their mechanical stability in bioreactors,” Biotechnol. Bioeng. 56, 517–529 (1997). 10.1002/(SICI)1097-0290(19971205)56:5%3E517::AID-BIT5%3C3.0.CO;2-L [DOI] [PubMed] [Google Scholar]
- 71. Teoh S. H., “ Fatigue of biomaterials: A review,” Int. J. Fatigue 22, 825–837 (2000). 10.1016/S0142-1123(00)00052-9 [DOI] [Google Scholar]
- 72. Hertzberg R. W. and Manson J. A., Fatigue of Engineering Plastics ( Academic, New York, 1980), p. 295. [Google Scholar]
- 73. Krzypow D. J. and Rimnac C. M., “ Cyclic steady state stress–strain behavior of UHMW polyethylene,” Biomaterials 21, 2081–2087 (2000). 10.1016/S0142-9612(00)00138-1 [DOI] [PubMed] [Google Scholar]
- 74. Meyer R. W. and Pruitt L. A., “ The effect of cyclic true strain on the morphology, structure, and relaxation behavior of ultra high molecular weight polyethylene,” Polymer 42, 5293–5306 (2001). 10.1016/S0032-3861(00)00626-1 [DOI] [Google Scholar]
- 75. Schechtman H. and Bader D. L., “ Fatigue damage of human tendons,” J. Biomech. 35, 347–353 (2002). 10.1016/S0021-9290(01)00177-4 [DOI] [PubMed] [Google Scholar]
- 76. Broom N. D., “ The stress/strain and fatigue behaviour of glutaraldehyde preserved heart-valve tissue,” J. Biomech. 10, 707–724 (1977). 10.1016/0021-9290(77)90086-0 [DOI] [PubMed] [Google Scholar]
- 77. Broom N. D., “ Fatigue-induced damage in glutaraldehyde-preserved heart valve tissue,” J. Thorac. Cardiovasc. Surg. 76, 202–211 (1978). [PubMed] [Google Scholar]
- 78. Paez J. M., Sanmartín A. C., Herrero E. J., Millan I., Cordon A., Rocha A., Maestro M., Burgos R., Tellez G., and Castillo-Olivares J. L., “ Durability of a cardiac valve leaflet made of calf pericardium: Fatigue and energy consumption,” J. Biomed. Mater. Res. A 77, 839–849 (2006). 10.1002/jbm.a.30650 [DOI] [PubMed] [Google Scholar]
- 79. Sellaro T. L., Hildebrand D., Lu Q., Vyavahare N., Scott M., and Sacks M. S., “ Effects of collagen fiber orientation on the response of biologically derived soft tissue biomaterials to cyclic loading,” J. Biomed. Mater. Res. A 80, 194–205 (2007). 10.1002/jbm.a.30871 [DOI] [PubMed] [Google Scholar]
- 80. Martin C. and Sun W., “ Modeling of long-term fatigue damage of soft tissue with stress softening and permanent set effects,” Biomech. Model. Mechanobiol. 12, 645–655 (2013). 10.1007/s10237-012-0431-6 [DOI] [PMC free article] [PubMed] [Google Scholar]
- 81. Church C. C., “ A theoretical study of cavitation generated by an extracorporeal shock wave lithotripter,” J. Acoust. Soc. Am. 86(1), 215–227 (1989). 10.1121/1.398328 [DOI] [PubMed] [Google Scholar]
- 82. Cleveland R. O., Bailey M. R., Fineberg N., Hartenbaum B., Lokhandwalla M., McAteer J. A., and Sturtevant B., “ Design and characterization of a research electrohydraulic lithotripter patterned after the Dornier HM3,” Rev. Sci. Instrum. 71, 2514–2525 (2000). 10.1063/1.1150643 [DOI] [Google Scholar]
- 83. Lokhandwalla M., McAteer J. A., J. C. Williams, Jr. , and Sturtevant B., “ Mechanical haemolysis in shock wave lithotripsy (SWL): II. In vitro cell lysis due to shear,” Phys. Med. Biol. 46, 1245–1264 (2001). 10.1088/0031-9155/46/4/323 [DOI] [PubMed] [Google Scholar]
- 84. Freund J. B., Colonius T., and Evan A. P., “ A cumulative shear mechanism for tissue damage initiation in shock-wave lithotripsy,” Ultrasound Med. Biol. 33, 1495–1503 (2007). 10.1016/j.ultrasmedbio.2007.03.001 [DOI] [PMC free article] [PubMed] [Google Scholar]


