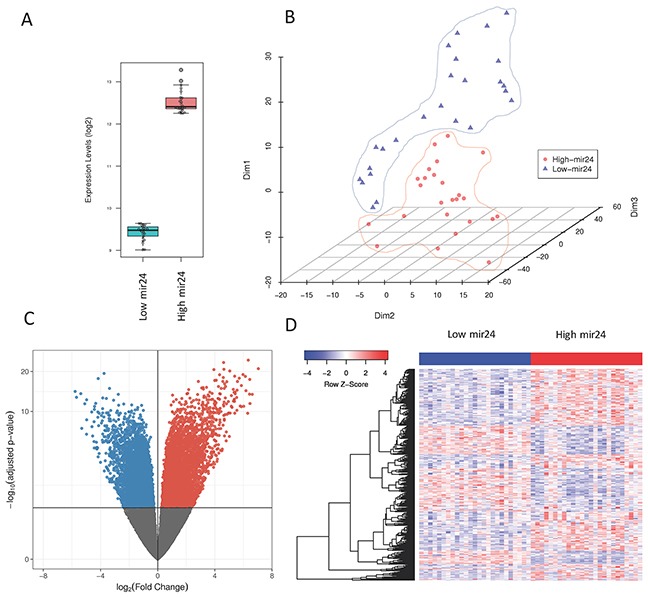
Figure 2.

(A) Box-plot of mir-24-3p levels in patients showing the highest (n=25) and lowest (n=25) expressing levels of mir-24-3p in primary tumors from the TCGA (B) t-SNE plot of patients with high and low mir-24-3p expressing levels showing the separation of the two conditions (C) Volcano plot of the genes differentially expressed based on mir-24-3p expression in primary tumors (high versus low) (D) Heatmap of the top 500 genes differentially expressed in patients with high versus low mir-24-3p levels.
