Abstract
Introduction
This study aims to answer the question of whether surgeons have different personalities to non-surgeons.
Methods
Members of the Royal College of Surgeons of England were sent an email survey containing 50 standard questions from the Five Factor personality assessment, which scores each respondent in five key personality traits (conscientiousness, agreeableness, neuroticism, openness, extroversion). Results were analysed and compared with a population-level data set from a survey conducted by the BBC.
Results
Five hundred and ninety-nine surgeons completed the survey. Analysis showed that surgeons scored significantly higher for conscientiousness, agreeableness, openness and neuroticism than non-surgeons (P < 0.05). Further analysis showed that female surgeons scored higher in openness and extroversion relative to the population average and that surgeons become more prone to neuroticism than non-surgeons as they age.
Conclusions
The results support the notion of a surgical personality, as well as indicating that female surgeons have significantly different personality profiles from male surgeons, and that age affects surgeons’ personalities in different ways to non-surgeons.
Keywords: Personality, Surgical personality, Surgery, Five Factor Model
Introduction
This study aimed to answer the question of whether surgeons have different personalities to non-surgeons. The answer to this question, aside from making good dinner table conversation for surgeons themselves, has significance for medical students choosing a career and wondering whether they will be suited to surgery. An understanding of the personality types associated with particular areas of healthcare also helps to inform workforce planning and recruitment efforts for the NHS and private providers, and also contributes to the development of effective teamworking practices in hospitals.
Previous studies have analysed the personality types within various fields of medicine and have found statistically significant variations in personality profile between surgeons and non-surgeons.1–7 These studies have generally been small samples confined to single institutions and have compared the profiles of surgeons within that single institution with the profiles of other medical specialties within that institution. It is therefore difficult to make generalised comments about all surgeons on the basis of these studies. The profiles of surgical or other specialist units within a single institution may be skewed by recruitment processes or by geographical factors. Further, the fact that the surgeons’ profiles are being compared with the personalities of other groups of medics only permits the conclusion that surgeons’ personalities differ from those of other medics. This study aims to draw more robust conclusions about the existence of a ‘surgical personality’ by using a large sample of surgeons from across the UK, in multiple institutions, with a cross-section of ages and career stages represented, and comparing against a very large sample of the whole UK population.
The analysis is based on survey data gathered from members of the Royal College of Surgeons of England (n = 599) and on a large-scale UK-wide survey conducted by the BBC (n = 386,375).8 Both surveys use the Five Factor model to break down personality into five key traits – extroversion, agreeableness, conscientiousness, neuroticism and openness to experience – which are measured on a scale of 0–100.9 The data from the two surveys are statistically analysed to determine whether certain traits are over- or under-represented among surgeons. Further analysis of the surgeons’ data investigates the relationship between other factors (age, gender) and personality type.
The five personality factors can be summarised as:
| Openness | Measures intellectual curiosity, creativity and a preference for novelty over routine. |
| Conscientiousness | Measures self-discipline, organisation, a sense of duty and a preference for planned behaviour rather than impulsivity. |
| Extroversion | Measures sociability, a preference for company, high energy levels and assertiveness. |
| Agreeableness | Measures a person’s tendency to be compassionate, cooperative and trusting. |
| Neuroticism | Measures a person’s tendency towards negative emotions such as anger, anxiety and depression; can be interpreted as a person’s degree of emotional stability. |
Methods
A questionnaire was constructed using PsyToolkit (www.psytoolkit.org), using 50 standard questions from the Five Factor personality assessment. The questions were sourced from the International Personality Item Pool (ipip.ori.org). The questionnaire was sent by email to all 20,500 members of the Royal College of Surgeons of England. Responses were incentivised with entry into a random prize draw to win £50 in Amazon vouchers. For the population-level data set, data were acquired from the UK Data Service (www.ukdataservice.ac.uk). Data were analysed using Gretl, Microsoft Excel and XLStat (Addinsoft).
A total of 848 responses were received to the surgeons’ questionnaire. Of these, 249 were discounted as incomplete, leaving a final sample size of 599. More responses were received from men – 341, compared with 256 from women (one respondent identified as transgender and one selected ‘prefer not to say’) but this reflects an overrepresentation of men in the surgical population. In fact, relative to the demographics of the profession, women are over-represented in this survey: women make up only around 10% of surgical specialists on the General Medical Council register, while 43% of the responses to this survey were from women.10
Although there were differences in the two survey methods – the surgeons’ survey was actively ‘pushed’ to surgeons while the BBC survey was ‘passive’ and relied on traffic to the BBC website and sharing on social media – the methodologies are alike enough to allow meaningful comparison.
Results
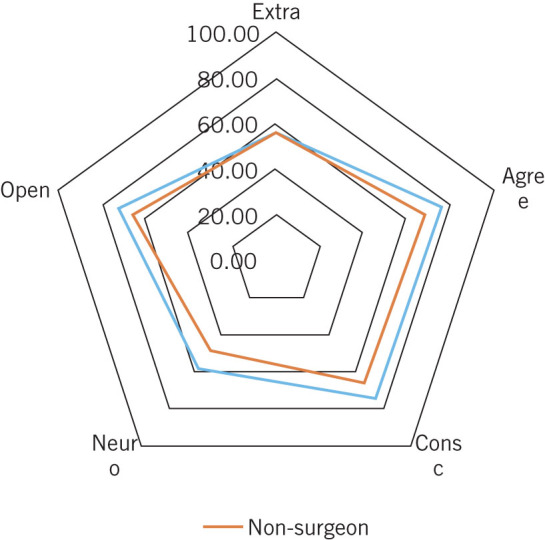
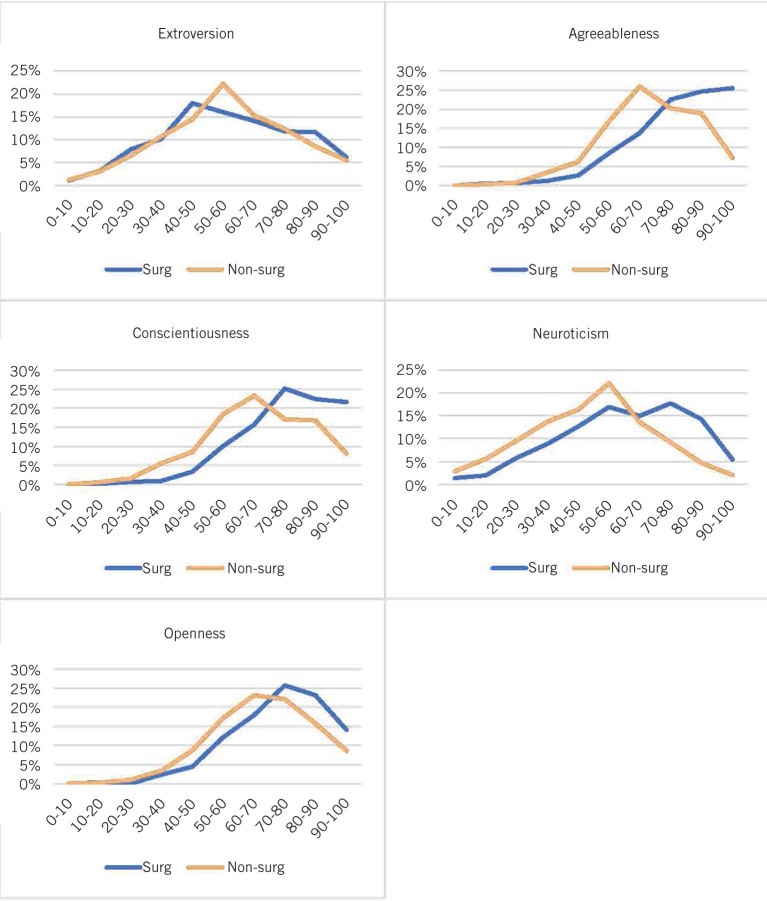
Tables 1 and 2 show summary descriptive statistics for the surgical and non-surgical populations. Figure 1 shows the frequency distributions of the various personality traits in the two populations, while boxplots in Figure 2 show the means and quartile distributions of the traits in the two populations. A two-sample t-test was conducted (Table 3), which confirmed statistically significant variations in the mean levels of agreeableness, conscientiousness, neuroticism and openness between the surgical and non-surgical populations. Table 4 shows the results of a two-tailed Mann–Whitney U test, with the null hypothesis of equal distributions for each character trait. The Mann–Whitney test allows us to reject the null hypothesis of equal distributions for a high degree of certainty (P < 0.0001) in every personality trait except extroversion. Both the t-test and the Mann-Whitney test support the notion of a surgical personality, which varies from the ‘average’ personality in that surgeons score significantly higher in agreeableness, conscientiousness, neuroticism and openness. A simple graphical representation of the surgical personality profile compared with the non-surgical profile is shown in Figure 3.
Table 1.
Summary descriptive statistics for surgical sample (n = 599).
| Extroversion | Agreeableness | Conscientiousness | Neuroticism | Openness | |
| Mean | 55.68 | 76.44 | 75.16 | 58.53 | 72.32 |
| Standard error | 0.88 | 0.66 | 0.64 | 0.85 | 0.62 |
| Median | 55 | 78.75 | 76.25 | 60 | 72.5 |
| Mode | 50 | 82.5 | 75 | 70 | 72.5 |
| Standard deviation | 21.6 | 16.06 | 15.58 | 20.87 | 15.25 |
Table 2.
Summary descriptive statistics for non-surgical sample (n = 386,375).a
| Extroversion | Agreeableness | Conscientiousness | Neuroticism | Openness | |
| Mean | 56.11 | 68.47 | 66.2 | 49.27 | 66.80 |
| Standard error | 0.03 | 0.03 | 0.03 | 0.03 | 0.03 |
| Median | 56.25 | 69.44 | 66.67 | 50 | 67.5 |
| Mode | 56.25 | 69.44 | 69.44 | 50 | 67.5 |
| Standard deviation | 20.58 | 15.55 | 17.45 | 20.32 | 16 |
aIt is of course highly likely that the ‘non-surgical’ sample contains a very small number of responses from surgeons (around 150, if the proportion of surgeons in the population is reflected). For the sake of simplicity, the very minor potential impact of these responses is ignored and the BBC survey is referred to as ‘non-surgical’.
Figure 1.
Frequency distribution charts comparing surgical and non-surgical samples
Figure 2.
Boxplots comparing surgical and non-surgical samples
Table 3.
Two-sample t-test results (H0: μ1 = μ2).
| Test | Extroversion | Agreeableness | Conscientiousness | Neuroticism | Openness | |||||||||
| Surgeon | Non-surgeon | Surgeon | Non-surgeon | Surgeon | Non-surgeon | Surgeon | Non-surgeon | Surgeon | Non-surgeon | |||||
| Mean | 55.65 | 56.11 | 76.41 | 68.47 | 75.14 | 66.20 | 58.55 | 49.27 | 72.37 | 66.80 | ||||
| Variance | 466.31 | 423.52 | 257.85 | 241.91 | 242.75 | 304.58 | 435.01 | 412.97 | 233.38 | 256.08 | ||||
| Observations | 599 | 386,375 | 599 | 386,375 | 599 | 386,375 | 599 | 386,375 | 599 | 386,375 | ||||
| Hypothesised mean difference | 0 | 0 | 0 | 0 | 0 | |||||||||
| df | 600 | 600 | 600 | 600 | 600 | |||||||||
| t Stat | –0.5199 | 12.105 | 14.0261 | 10.8769 | 8.925 | |||||||||
| P(T<=t) one-tail | 0.3017 | < 0.0001 | < 0.0001 | < 0.0001 | 0 | |||||||||
| t critical one-tail | 1.6474 | 1.6474 | 1.6474 | 1.6474 | 1.6474 | |||||||||
| P(T<=t) two-tail | 0.6033 | < 0.0001 | < 0.0001 | < 0.0001 | < 0.0001 | |||||||||
| t critical two-tail | 1.9639 | 1.9639 | 1.9639 | 1.9639 | 1.9639 | |||||||||
Table 4.
Mann–Whitney two-tailed test.
| Extroversion | Agreeableness | Conscientiousness | Neuroticism | Openness | |
| U | 117,245,187.5 | 80,770,749.5 | 80,678,813.5 | 85,856,668.5 | 91,920,420.0 |
| Expected value | 115,719,312.5 | 115,719,312.5 | 115,719,312.5 | 115,719,312.5 | 115,719,312.5 |
| Variance (U) | 7,449,223,463,804 | 7,441,894,820,084 | 7,447,132,628,375 | 7,448,675,099,107 | 7,447,493,365,353 |
| P-value (two-tailed) | 0.576 | < 0.0001 | < 0.0001 | < 0.0001 | < 0.0001 |
| alpha | 0.05 | 0.05 | 0.05 | 0.05 | 0.05 |
Figure 3.

Radar graph showing mean personality trait scores in the surgical and non-surgical samples
Personality traits have been shown to vary between men and women at a population level. However, our data reveal additional variations between the genders within the surgical population (Table 5). While in the non-surgical population, women score lower in extroversion than men; within the surgical population they score statistically significantly higher (Student’s t-test, P = 0.005). Likewise, in the non-surgical population, women score lower in agreeableness than men, within the surgical population they score significantly higher (Student’s t-test, P = 0.002).
Table 5.
Mean scores segmented by gender.
| Extroversion | Agreeableness | Conscientiousness | Neuroticism | Openness | |
| Male surgeons | 53.45 | 74.58 | 75.71 | 61.06 | 73.74 |
| Male non-surgeons | 56.9 | 70.01 | 67.96 | 51.87 | 65.47 |
| Female surgeons | 58.58 | 78.88 | 74.38 | 55.19 | 70.54 |
| Female non-surgeons | 54.7 | 65.72 | 63.07 | 44.64 | 69.16 |
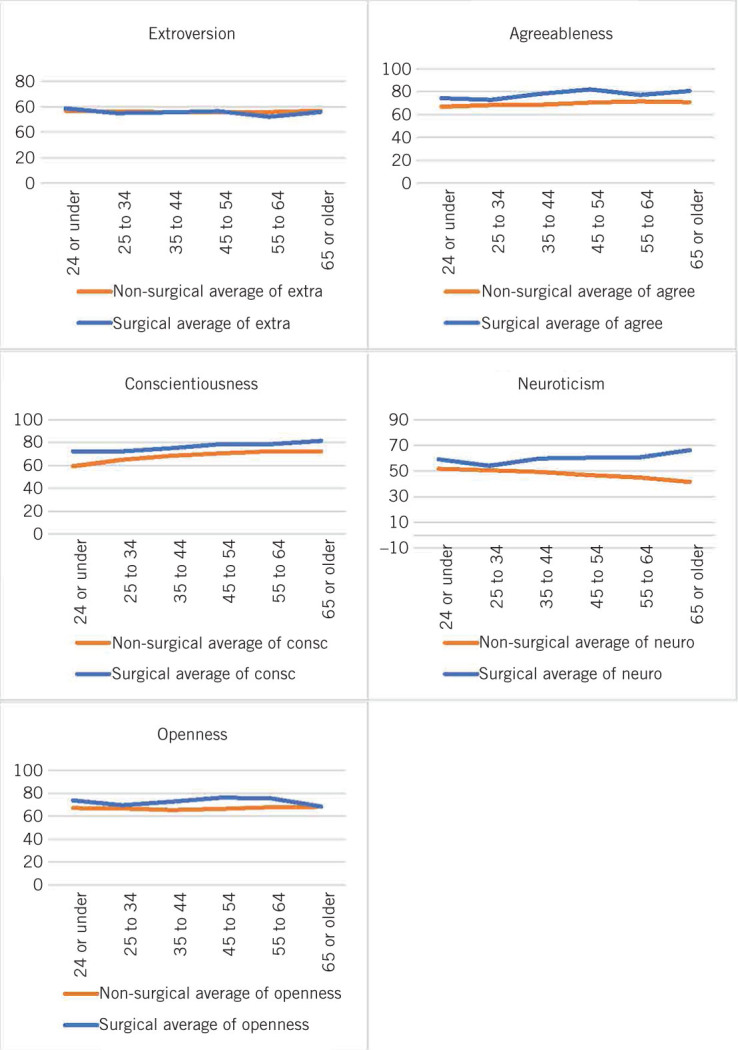
Age, as well as gender, affects personality profiles in the general population. To simplify and generalise: people become more agreeable, more conscientious, less open to experience, less neurotic and less extrovert as they age (Fig 4).11,12 Figure 5 plots the mean scores for surgeons and non-surgeons in each age group for each personality trait and reveals that the trends are similar in the two groups, with the notable exception of neuroticism. Older surgeons appear to be more prone to neuroticism than younger ones; while in the non-surgical population neuroticism is inversely correlated with age.
Figure 4.

Comparison of the variations in personality traits between age groups in the surgical and non-surgical samples
Discussion
The data firmly support the notion of a distinct ‘surgical personality’. Surgeons score statistically significantly above non-surgeons for agreeableness, conscientiousness, neuroticism and openness. These findings, on the whole, fit with the public perception of the surgical personality: that surgeons are among other things intellectually curious, highly disciplined, organised and assertive. The elevated levels of neuroticism – the tendency to exhibit negative emotions such as anger, anxiety, depression and vulnerability – might not immediately resonate with the popular conception of a surgeon but they do reinforce previous research, which has shown that surgeons are more prone to burnout and mental illnesses such as depression and anxiety.13,14
Age
Age is also shown to affect surgeons’ personalities in a different way from those of non-surgeons. Older surgeons showed elevated levels of neuroticism, whereas in the non-surgical population older people tended to report lower levels of neuroticism. These are not longitudinal data so one cannot state confidently that ‘surgeons get more neurotic as they age’. Even acknowledging the imitations of the data, though, the relative similarity of the effect of age on the other personality traits in the surgical and non-surgical populations make it tempting to infer that there are aspects of the profession of surgery – the high-stakes nature of the work, the long hours and the constant exposure to mortality – that over time increase a person’s susceptibility to emotions such as anxiety and depression.
Gender
Female surgeons are revealed to have significantly different personality profiles than male surgeons. They are significantly more extroverted and agreeable than male surgeons relative to the non-surgical population means. There are many possible explanations for this. One might note that, despite improvements in recruitment of women into surgery, there is still a substantial gender disparity in the surgical workforce.10 Whatever selection pressures have been responsible for this gender imbalance are also likely to have caused this differential in personality profiles between the genders. Perhaps it is possible that, to succeed in a predominantly male environment, female surgeons need to be – or feel they need to be – more agreeable and more extroverted. Or perhaps the training path into surgery naturally favours and selects more agreeable, extroverted women trainees. Given the scale of the gender imbalance in the profession and the recruitment challenges that surgery is facing, more research on this topic may well be beneficial.
References
- 1.Greenburg A., McClure DK, Penn NE. Personality traits of surgical house officers: faculty and resident views. Surgery 1982; : 368–372. [PubMed] [Google Scholar]
- 2.Schwartz RW Barclay JR, Harrell PL et al. Defining the surgical personality: a preliminary study. Surgery 1994; : 62–68. [PubMed] [Google Scholar]
- 3.McGreevy J, Wiebe D. A preliminary measurement of the surgical personality. Am J Surg 2002; : 121–125. [DOI] [PubMed] [Google Scholar]
- 4.Thomas JH. The surgical personality: fact or fiction. Am J Surg 1997; : 573–577. [DOI] [PubMed] [Google Scholar]
- 5.Drosdeck JM, Osayi SN, Peterson LA et al. Surgeon and nonsurgeon personalities at different career points. J Surg Res 2015; : 60–66. [DOI] [PubMed] [Google Scholar]
- 6.Eng MKH, Macneily AE, Alden L. The urological personality: is it unique? Can J Urol 2004; : 2,401–2,406. [PubMed] [Google Scholar]
- 7.Ahmed F, Khan T, Rashid W et al. A descriptive analysis of psychological traits among the health-care providers. CHRISMED J Health Res 2017; : 76–80. [Google Scholar]
- 8.Rentfrow PJ, et al. Regional personality differences in Great Britain. PLoS One 2015; : e0122245. [DOI] [PMC free article] [PubMed] [Google Scholar]
- 9.Digman JM. Personality structure: emergence of the Five-Factor Model. Annu Rev Psychol 1990; : 417–440. [Google Scholar]
- 10.Garner A, Bowbrick V. Suturing the surgical gender gap. BMJ Careers 2015; 25 February http://careers.bmj.com/careers/advice/Suturing_the_surgical_gender_gap (cited 1 October 2017).
- 11.Soldz S, Vaillant GE. The big five personality traits and the life course: a 45-year longitudinal study. J Res Pers 1999; : 208–232. [Google Scholar]
- 12.Specht J, et al. Stability and change of personality across the life course: the impact of age and major life events on mean-level and rank-order stability of the Big Five. J Pers Soc Psychol 2011; (4): 862–882. [DOI] [PubMed] [Google Scholar]
- 13.Gerada C, Jones R. Surgeons and mental illness: a hidden problem? BMJ Careers 2014; 22 April http://careers.bmj.com/careers/advice/view-article.html?id=20017282 (cited 1 October 2017).
- 14.Balch C. M. et al. Stress and burnout among surgeons: understanding and managing the syndrome and avoiding the adverse consequences. Arch Surg 2009; : 371–376. [DOI] [PubMed] [Google Scholar]


