Abstract
Butyrate, an essential factor for colonocytes and regulator in the development of colon cancer, is partially absorbed by the gut. It influences the proliferation and differentiation of several cell types including osteoblasts. We evaluated the effects of different doses of butyrate on differentiation and functionality of osteosarcoma cells in vitro and the expression of a pro-inflammatory phenotype in a normal or inflammatory environment. SaOS-2 osteosarcoma cells were induced to differentiate and contemporarily treated for 24 h, 48 h, or 7 days with sodium butyrate 10−4, 5 × 10⁻⁴, or 10−3 M in the presence or absence of tumor necrosis factor alpha (TNFα) 1 ng/mL, a pro-inflammatory stimulus. Despite the mild effects on proliferation and alkaline phosphatase activity, butyrate dose- and time-dependently induced the expression of a differentiated phenotype (RUNX2, COL1A1 gene expression, and osteopontin gene and protein expression). This was associated with a partial inhibition of nuclear factor kappa B (NF-κB) activation and the induction of histone deacetylase 1 expression. The net effect was the expression of an anti-inflammatory phenotype and the increase in the osteoprotegerin-to-receptor activator of nuclear factor kappa-B ligand (RANKL) ratio. Moreover, butyrate, especially at the highest dose, counteracted the effects of the pro-inflammatory stimulus of TNFα 1 ng/mL. Butyrate affects osteosarcoma cell metabolism by anticipating the expression of a differentiated phenotype and by inducing the expression of anti-inflammatory mediators.
Keywords: cytokines, histone deacetylases, NF-κB activation, osteosarcoma cells, sodium butyrate
Introduction
Butyric acid (BA) is a short-chain fatty acid (SCFA) naturally produced by resident bacteria in the colonic lumen of animals through the anaerobic fermentation of non-digestible polysaccharides (dietary fiber).1 In the colonic lumen, BA is mainly in sodium salt form (sodium butyrate (NaBu)) and colonocytes use NaBu as a primary energetic source (70% of overall energy requirements). In colonic tumor cells, the metabolic shift toward glycolysis as a primary energy source (Warburg effect)2 reduces NaBu uptake.3
Within the colon, NaBu forms a villus-to-crypt axis concentration gradient from 5 to 0.5 mmol/L. NaBu not used by the colonocytes enters the bloodstream and thus becomes available for all cells.4
The preventive effects of NaBu, and of alimentary fiber, on colon cancer are known.4 However, NaBu also exerts extra-colonic actions (i.e. red cell maturation) since it acts on basic molecular mechanisms (e.g. proliferation, differentiation),5 as demonstrated in diverse tumor-derived cell lines.4 Indeed, as a SCFA, butyrate is a readily usable, completely oxidizable, energy source preferred to glucose in non-transformed cells.6 NaBu is also a histone deacetylase (HDAC) inhibitor (HDACI), the first one to be discovered,7 favoring the hyperacetylated status of histone proteins and the transcriptionally active open conformation of chromatin.7,8 This action, as for other less effective SCFAs, also targets non-histone proteins (i.e. nuclear factor kappa B (NF-κB), MyoD, p53, and nuclear factor AT (NFAT), Sp1) mainly acting as transcription factors involved in inflammatory gene expression.9
Within the cell, NaBu concentrations determine its own fate: at low concentrations, NaBu satisfies the cell’s energy needs; at concentrations exceeding its energy needs (depending on cell type, range: 0.5–5 mmol/L), it acts as an HDACI.4
Thanks to its HDACI activity, NaBu is able to stimulate osteoblast functionality and differentiation.10–12 Recently, it has been demonstrated that NaBu suppresses proliferation and induces apoptosis in U2OS osteosarcoma (OS) cells through the regulation of MDM2-p53 signaling.13
The SaOS-2 cell line is a widely used model for studying osteoblast physiology, OS pathophysiology, and anti-tumor activities of selected compounds.14 In vivo, primary (OS) and secondary bone tumors produce cytokines that induce osteoclast-dependent bone resorption15 and recruit inflammatory cells, thus perpetuating this cycle.16 Osteolysis, a hallmark of bone tumors sustained by NF-κB activation, facilitates tumor growth and contributes to overall morbidity.17
The aim of this study was to evaluate the effects of different doses of NaBu on differentiation and functionality of OS cells in vitro and to test their effects on the expression of the inflammatory phenotype in a normal or an inflammatory environment induced by treating the cells with tumor necrosis factor alpha (TNFα).
Materials and methods
Reagents
Unless otherwise specified, all culture media, supplements, reagents, and assays were purchased from Thermo Fisher Scientific (MA, USA).
Cell cultures
The human OS cell line SaOS-2 (ECACC, Salisbury, UK) was cultured in complete medium (CM), consisting of Dulbecco’s modified Eagle medium (DMEM) containing 4.5 g/L of d-(+)-glucose and supplemented with 10% fetal bovine serum (FBS), 1 × 10⁵ U/L penicillin, 0.1 mg/L streptomycin, 0.25 mg/L amphotericin B, and 2 × 10⁻³ M l-glutamine. Cells were kept at 37°C in a 5% CO2–95% air humidified atmosphere. Cultures were checked for mycoplasma contamination.
For the experiments, cells were plated 3 × 10³/cm2 until 30% of confluence, then CM was turned into osteogenic medium (OM), consisting of CM, at lower glucose concentration (1.0 g/L), supplemented with 1.5 × 10⁻⁴ M l-ascorbic acid-2-phosphate, 10−2 M β-glycerophosphate, and 100 nM dexamethasone. Cells were treated with NaBu (Sigma-Aldrich, MO, USA) (10−4, 5.0 × 10⁻⁴, and 10−3 M in double-distilled sterile water) and/or 1.0 ng/mL recombinant human TNFα (in double-distilled sterile water; rhTNFα, PeproTech, NJ, USA). The effects were evaluated at 24 h, 48 h, and 7 days. Medium changes and treatments were performed every 48 h to keep a constant regimen of treatment. Untreated cells cultivated in CM were used as control (CTRL). Three independent experiments, comprising three replicates each for every evaluation, were carried out.
Proliferation and viability assays
SaOS-2 cells were seeded in a 24-well plate (Greiner Bio-One International, GmbH, A, EU) and treated as described above. Cell viability, indirectly assayed through measurement of the mitochondrial reducing potential, was assessed by alamarBlue® assay following the manufacturer’s instructions: 10× alamarBlue® reagent was added to OM and incubated for 4 h; fluorescence emission at λ 585 nm, following excitation at λ 570 nm, was read using a VICTOR® X3 Multilabel Counter (Perkin Elmer, Inc., MA, USA). The still adherent and viable cells were then frozen at −80°C until proliferation testing. Cell proliferation was indirectly evaluated by CyQUANT® cell proliferation assay using a green fluorescent dye that shows strong fluorescence enhancement when bound to cellular nucleic acids. Briefly, thawed plates were lysed in CyQUANT® cell lysis buffer, and total nucleic acid content was obtained from fluorescence emission at λ 520 nm after excitation at λ 480 nm. In order to eliminate the cell number effect, viability output was normalized to DNA content.
Alkaline phosphatase assay
SaOS-2 cells were seeded in 150-cm2 plastic flasks (Greiner Bio-One) and treated as described above. The cells were lysed in NP40 buffer, supplemented with a protease inhibitor cocktail and 1 mM phenylmethylsulfonyl fluoride (PMSF; Sigma-Aldrich) for 30 min on ice, then centrifuged at 13,000 r/min for 10 min at 4°C, and the supernatant was stored at −20°C until assayed. Protein content was determined with the Pierce® BCA protein assay.
Alkaline phosphatase (ALP) activity was measured using an ALP diethanolamine detection kit (Sigma-Aldrich). Lysates were incubated in 1.0 M diethanolamine, 5.0 × 10⁻⁴ M MgCl2, pH 9.8, and 1.34 × 10⁻² M 4-nitrophenyl phosphate (pNPP) as substrate at 37°C for 25 min. The absorbance of yellowish color developed (4-nitrophenol (pNP)) was read (λ 405 nm), and ALP specific activity was interpolated from a standard curve and normalized to total protein content.
Gene expression
Cell total RNA was extracted using a PureLink® RNA Mini Kit. On-column DNase treatment (PureLink® DNase Set) was carried out to avoid genomic DNA contamination. RNA quality was spectrophotometrically determined (NanoDrop ND-1000) and first-strand complementary DNA (cDNA) was synthesized (SuperScript® VILO™ cDNA synthesis kit) using 1.0 µg of total pure RNA. cDNA was used as a template of real-time polymerase chain reaction (PCR; SYBR® Select Master Mix); relative expression was calculated by the CT method and glyceraldehyde 3-phosphate dehydrogenase (GAPDH) used as housekeeping. The PCR primers are reported in Table 1.
Table 1.
Real-time PCR primer sequences.
| Gene | Forward 5′→3′ | Reverse 5′→3′ | Transcript ID | RefSeq |
|---|---|---|---|---|
| GAPDH | CACCATCTTCCAGGAGCGAG | AAATGAGCCCCAGCCTTCTC | ENST00000229239 | NM_002046 |
| RUNX2 | CCAACCCACGAATGCACTATC | TAGTGAGTGGTGGCGGACATAC | ENST00000371438 | NM_001024630 |
| SPP1 | CGCAGACCTGACATCCAGT | GGCTGTCCCAATCAGAAGG | ENST00000395080 | NM_001040058 |
| COL1A1 | AGGGCCAAGACGAAGACATC | GTTTCCACACGTCTCGGTCA | ENST00000225964 | NM_000088 |
| RELA | GCTGCATCCACAGTTTCCAG | TGGAAGGGGTTGTTGTTGGT | ENST00000406246 | NM_001243984 |
NF-kB activation
Total and phosphorylated RelA/NF-κB p65 (Ser 536) were measured in whole cells by a cell-based ELISA Human Phospho-RelA/NF-κB p65 (Ser 536) immunoassay (R&D Systems, MN, USA). Treated cells plated in 96-well plates were fixed and permeabilized. Total and phosphorylated p65 (Ser 536) was detected by double immunoenzymatic labeling and absorbance readings at λ 600 nm (phospho-RelA) and λ 450 nm (tot RelA).
Cytokine determination
Sandwich ELISA was built to measure interleukin 10 (IL-10), IL-6, receptor activator of nuclear factor kappa-B ligand (RANKL) (Peprotech), and osteoprotegerin (OPG; RayBiotech, GA, USA) concentrations in culture media. Cytokine concentrations were normalized to total protein content.
Western blotting
Proteins (150 μg) were loaded on 4%–15% gradient sodium dodecyl sulfate (SDS)-polyacrylamide gels to resolve the 66-kDa band corresponding to monomeric osteopontin (OPN) and then electroblotted onto Hybond-P polyvinylidene difluoride transfer membranes (BioRad Laboratories, CA, USA). After blocking (5% non-fat dry milk in phosphate-buffered saline (PBS), 30 min, RT), the membranes were incubated overnight at 4°C with 1:1000 of a rabbit anti-human OPN polyclonal antibody (Ab8448; Abcam, UK) in 5% non-fat dry milk in PBS. After washing with tween-supplemented tris-buffered saline (TBS-T) 0.3% for 30 min, the membranes were incubated for 1 h at RT with a goat anti-rabbit IgG horseradish peroxidase (HRP)-conjugated polyclonal antibody (1:5000; A0545; Sigma-Aldrich) and developed with a chemiluminescence enhancement kit (Clarity™ Western ECL blotting substrate; BioRad). GAPDH was used as housekeeping by means of 1:15,000 mouse anti-human GAPDH monoclonal antibody (G8795; Sigma-Aldrich). Band densities were quantified from digital acquisition by a Gel Logic 2200 Imaging System (Kodak, NY, USA) using NIH ImageJ software on the replicates of each of the independent experiments. OPN protein expression was normalized to GAPDH and described as fold increase compared to time-matched controls.
Statistical analysis
Statistical analysis was performed with GraphPad Prism version 6.0 (GraphPad Software, Inc., CA, USA). Values are described as mean ± standard deviation (SD). For each treatment, between-time point changes were determined with repeated-measures analysis of variance (ANOVA) and Tukey’s multiple comparisons post hoc test. For each time point, between-treatment differences were determined using one-way ANOVA and Tukey’s post hoc tests for multiple comparisons. Statistical significance was set at P < 0.05.
Results
Viability and proliferation
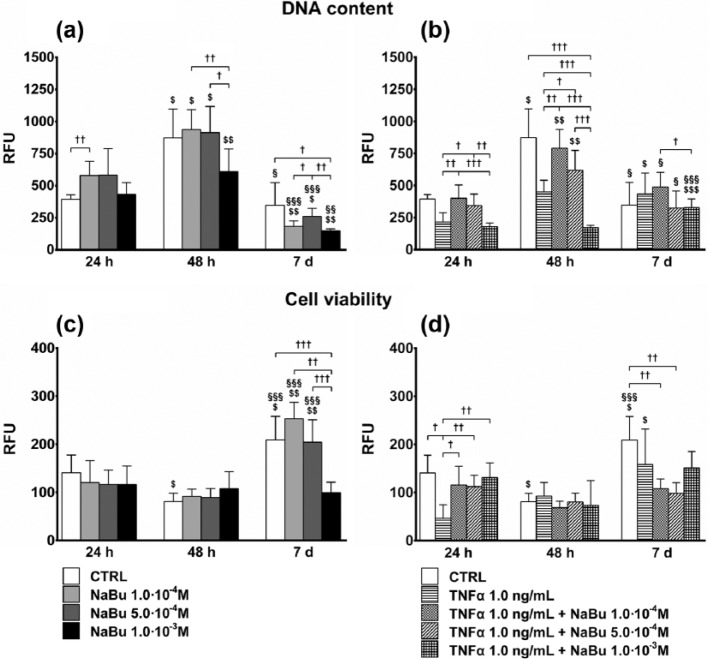
The maximum effect of NaBu was observed at 7 days when all NaBu doses decreased the DNA content, much more than the CTRL, in the presence of a comparable or even increased viability (vs 24 and 48 h).
At 24 h, low doses of NaBu increased DNA content as compared to the CTRL, while the higher dose had no effect. At 48 h, proliferation was significantly increased in the CTRL and NaBu-treated cells. Following NaBu 10−3 M treatment, however, it was significantly lower as compared to the CTRL and NaBu 10−4 and 5.0 × 10⁻⁴ M, which were comparable. At 7 days, the overall DNA content of the CTRL was reduced as compared to 48 h and even lower than that at 24 h for NaBu-treated cultures. NaBu 10−3 M inhibited proliferation as compared to treatments at 10−4 and 5.0 × 10⁻⁴ M, which did not differ from the CTRL, however (Figure 1(a)).
Figure 1.
Proliferation and cell viability. Effects of treatments on total DNA content of cultures (a, b) by CyQuant® test, and cell viability, normalized to DNA content (c, d), by alamarBlue® assay, at 24 h, 48 h, and 7 days of culture. (a) and (c) Proliferation index and cell viability, respectively, of untreated control (CTRL) and NaBu-treated cultures; (b) and (d) Proliferation index and cell viability, respectively, of CTRL, TNFα-, and TNFα + NaBu-treated cultures. Repeated-measures ANOVA was used to evaluate inter-time changes for each condition ($: vs 24 h, §: vs 48 h); Student’s t-test was used to evaluate inter-group differences at each time point (†). The number of symbols indicates the significance level (P < 0.05, P < 0.01, P < 0.001).
TNFα 1.0 ng/mL (Figure 1(b)) strongly reduced DNA content at 24 and 48 h as compared to the CTRL. At day 7, proliferation was increased, albeit not significantly, by the cytokine. NaBu partially counteracted the effects of TNFα. At 24 h and 48 h, NaBu 10−4 and 5.0 × 10⁻⁴ M tended to restore the basal condition by increasing the DNA content in the TNFα-treated cultures. Contrarily, treatment with NaBu 10−3 M in association with TNFα strongly increased the anti-proliferating effect. At day 7, all co-treatments increased DNA content, as compared to their counterparts treated with NaBu alone, to a level comparable to that of the CTRL.
The results of viability were normalized to the DNA content to obtain a clear indication about the entity of viability in relationship to the real cell number in culture. NaBu treatments did not substantially affect cell viability. The greatest effects were seen at day 7, with CTRL, NaBu 1.0 × 10⁻⁴, and NaBu 5.0 × 10⁻⁴ M-treated cells showing a twofold increase over the previous time points. NaBu 1.0 × 10⁻³ M had no effect (Figure 1(c)). Compared to the CTRL and TNFα + NaBu co-treated cells, TNFα decreased cell viability as early as 24 h. At day 7, viability was increased only in the CTRL and TNFα-treated cells (Figure 1(d)).
ALP activity
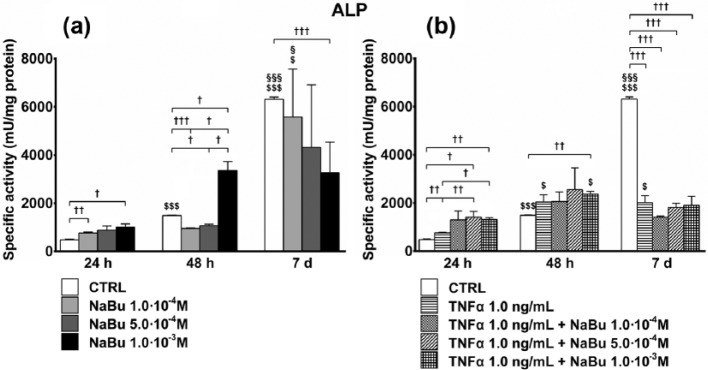
As early as 48 h, and much more at day 7, differentiation increased ALP specific activity. The effect of NaBu, even in this case, depended on the differentiation stage. In the early phases, NaBu 1.0 × 10⁻⁴ M (24 h) and 1.0 × 10⁻³ M (24 and 48 h) further induced ALP activity. Later (day 7), following NaBu 1.0 × 10⁻³ M treatment, ALP activity remained unchanged as compared to 48 h and significantly lower than in CTRL (Figure 2(a)).
Figure 2.
Specific activity of alkaline phosphatase (ALP). Effects of treatment on specific activity of ALP at 24 h, 48 h, and 7 days of culture. (a) ALP specific activity of untreated control (CTRL) and NaBu-treated cultures; (b) ALP specific activity of CTRL, TNFα-, and TNFα + NaBu-treated cultures. Repeated-measures ANOVA was used to evaluate inter-time changes for each condition ($: vs 24 h, §: vs 48 h); Student’s t-test was used to evaluate inter-group differences at each time point (†). The number of symbols indicates the significance level (P < 0.05, P < 0.01, P < 0.001).
At 24 h, TNFα slightly stimulated ALP activity as compared to the CTRL. The effects of co-treatment with NaBu/TNFα were greater as compared to that of TNFα at 24 h and, only for TNFα + NaBu 1.0 × 10⁻³ M at 48 h. On the contrary, at day 7, none of the treatments modified ALP activity as compared to 48 h, and they remained significantly lower than the CTRL (Figure 2(b)). At 24 h, the cultures treated with TNFα + NaBu 5.0 × 10⁻⁴ M expressed higher levels of ALP specific activity as compared to the NaBu 5.0 × 10⁻⁴ M-treated counterparts.
Differentiation
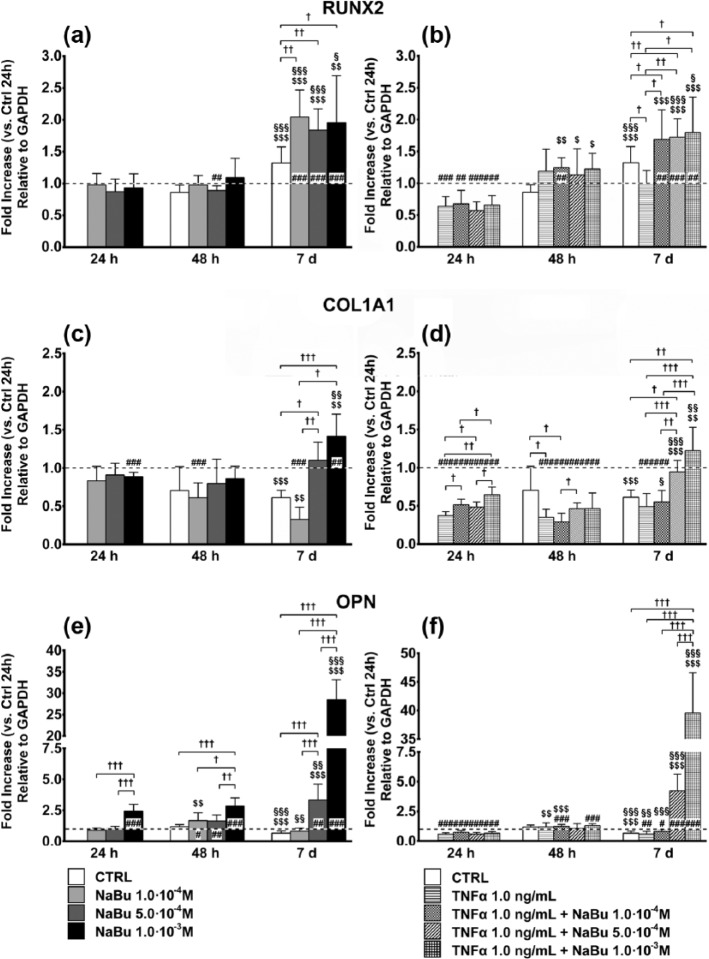
Expression of the SPP1 gene, encoding OPN, showed greater changes following NaBu treatment (Figure 3(e) and (f)). Despite a very slight decrease over 7 days in the CTRL, NaBu 10−3 M at 24 and 48 h and NaBu 5.0 × 10⁻⁴ M and 10−3 M at day 7 strongly induced SPP1 (3.5-fold and 30-fold, respectively, Figure 3(e)). TNFα, either alone or combined with NaBu, slightly lowered OPN expression at 24 h as compared to the CTRL. At day 7, SPP1 was fivefold induced by TNFα + NaBu 5.0 × 10⁻⁴ M and 40-fold by TNFα + NaBu 10−3 M (Figure 3(f)).
Figure 3.
Expression of key genes in osteoblastic differentiation. Effects of treatment on the expression of key genes in osteoblastic differentiation ((a, b): RUNX2; (c, d): COL1A1; (e, f): OPN) at 24 h, 48 h, and 7 days of culture. (a, c, and e) Changes in gene expression in untreated control (CTRL) and NaBu-treated cultures. (b, d, and f) Changes in gene expression in CTRL, TNFα-, and TNFα + NaBu-treated cultures. Relative gene expression is expressed as fold increase as compared to untreated CTRL at 24 h (placed at 1, dotted line). Repeated-measures ANOVA was used to evaluate inter-time changes for each condition ($: vs 24 h, §: vs 48 h); Student’s t-test was used to evaluate inter-group differences at each time point (†). Differences versus the untreated CTRL at 24 h are indicated by the symbol “#.” The number of symbols indicates the significance level (P < 0.05, P < 0.01, P < 0.001).
Although there was a 1.5-fold increase in RUNX2 gene expression at day 7, treatment with NaBu further induced RUNX2 expression as compared to the CTRL at day 7 and to the corresponding treatments at 24 and 48 h (twofold) (Figure 3(a)). Interestingly, when in co-treatment with TNFα, NaBu induced RUNX2 expression already at 48 h. At this time point, despite the lack of any significant effect of TNFα alone, NaBu + TNFα (regardless of NaBu concentration) induced a twofold increase in RUNX2 messenger RNA (mRNA). At day 7, following TNFα treatment, RUNX2 expression was still unchanged and significantly lower than the CTRL. Regardless of the NaBu concentration, instead, the TNFα-NaBu co-treatments enhanced RUNX2 expression as compared to CTRL and TNFα at the same time point and the previous time points (Figure 3(b)). Noteworthy, RUNX2 mRNA TNFα + NaBu-dependent induction at 48 h was always higher than NaBu alone, whereas NaBu-dependent induction at day 7 was comparable in both experimental settings.
COL1A1 gene expression followed a biphasic time- and dose-dependent response to both NaBu and TNFα + NaBu combinations. Compared to the CTRL, NaBu slightly decreased COL1A1 expression at 24 h, while there were no differences at 48 h (Figure 3(c)). At the same time points, both TNFα and TNFα-NaBu co-treatments reduced COL1A1 expression. However, while TNFα alone halved COL1A1 mRNA, NaBu induced a partial dose-dependent recovery, which was more evident at 48 h when COL1A1 expression did not differ from the CTRL (Figure 3(d)). At day 7, NaBu 5.0 × 10⁻⁴ and 1.0 × 10⁻³ M, alone or in combination with TNFα, induced COL1A1 gene expression by 50%–75% (Figure 3(c) and (d)).
OPN protein expression in cell lysates
Gradient gel electrophoresis showed resolution of the different aggregation states of OPN (polymeric, monomeric, and cleaved, Figure 4(a)). Band densitometry of the 66-kDa form (monomeric OPN), normalized to GAPDH expression, demonstrated a marked induction of OPN by NaBu 10−3 M at 48 h and day 7, even in the presence of TNFα, retracing the results from quantitative PCR (qPCR). TNFα alone, instead, had an inhibitory effect (Figure 4(b)). While the band profiles of the different OPN forms were qualitatively comparable for all treatments at 24 and 48 h, the band intensities of the polymeric forms of OPN at day 7 were clearly decreased following treatment with NaBu 10−3 M (Figure 4(a)).
Figure 4.
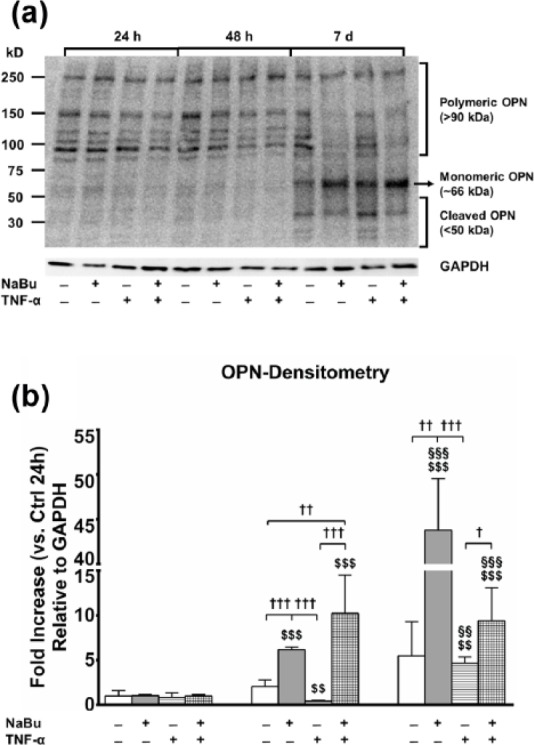
OPN protein expression in media and cell lysates. (a) Explicative image of PVDF membrane electroblotted from a PAGE and stained with rabbit anti-human and mouse anti-human GAPDH monoclonal antibody. Upper half: time points (24 h, 48 h, and day 7); lower half: combination of treatments (untreated CTRL, NaBu 10−3 M, TNFα, TNFα + NaBu 10−3 M); left half: molecular weight, based on the molecular marker loaded within the gel; right half: OPN forms corresponding to the different bands resolved by PAGE. (b) Densitometric analysis of the bands corresponding to the 66-kDa monomeric OPN, normalized to GAPDH protein expression. Relative gene expression is expressed as fold increase as compared to untreated CTRL at 24 h. Repeated-measures ANOVA was used to evaluate inter-time changes for each condition ($: vs 24 h, §: vs 48 h); Student’s t-test was used to evaluate inter-group differences at each time point (†). The number of symbols indicates the significance level (P < 0.05, P < 0.01, P < 0.001).
NF-κB activation and pro-inflammatory phenotype expression
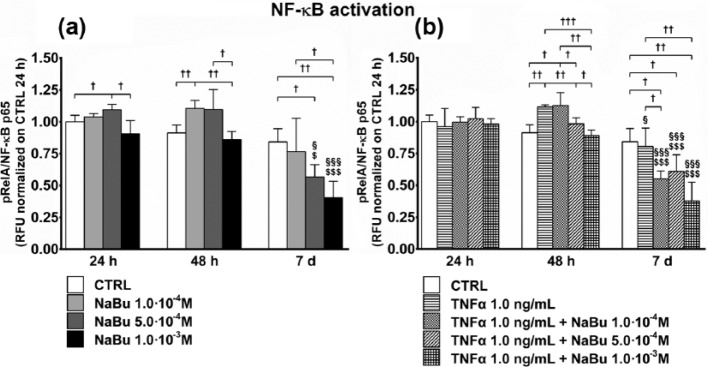
To understand whether NaBu affects NF-κB expression and activity, we evaluated RELA gene expression (Figure 5), which codifies for the p65 subunit of NF-κB, and its phosphorylation status (Figure 6). The results showed that despite a differentiation-associated decrease in RELA expression, NF-κB activation was dose-dependently inhibited by NaBu, at 7 days, regardless of TNFα co-treatment.
Figure 5.
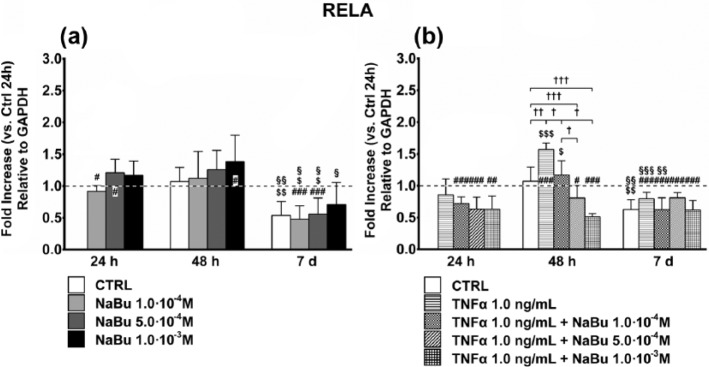
Expression of RELA subunit of NF-κB. Effects of treatment on gene expression of the RELA subunit of NF-κB at 24 h, 48 h, and 7 days of culture. (a) Changes in RELA gene expression in untreated control (CTRL) and NaBu-treated cultures. (b) Changes in RELA gene expression in CTRL, TNFα-, and TNFα + NaBu-treated cultures. Relative gene expression is expressed as fold increase as compared to untreated CTRL at 24 h (placed at 1, dotted line). Repeated-measures ANOVA was used to evaluate inter-time changes for each condition ($: vs 24 h, §: vs 48 h); Student’s t-test was used to evaluate inter-group differences at each time point (†). Differences versus the untreated CTRL at 24 h are indicated by the symbol “#.” The number of symbols indicates the significance level (P < 0.05, P < 0.01, P < 0.001).
Figure 6.
NF-κB activation. Effects of treatment on NF-κB activation (phospho-RelA/NF-κB p65) at 24 h, 48 h, and 7 days of culture. (a) NF-κB activation status of untreated control (CTRL) and NaBu-treated cultures. (b) NF-κB activation status of CTRL, TNFα-, and TNFα + NaBu-treated cultures. Repeated-measures ANOVA was used to evaluate inter-time changes for each condition ($: vs 24 h, §: vs 48 h); Student’s t-test was used to evaluate inter-group differences at each time point (†). The number of symbols indicates the significance level (P < 0.05, P < 0.01, P < 0.001).
RELA gene expression was unaffected by NaBu treatment over 7 days (Figure 5(a)). At 24 h, NaBu treatment, in the presence of TNFα, decreased RELA expression as compared to the relative CTRL. At 48 h, the TNFα-induced RELA expression was reverted by NaBu treatment in a dose-dependent manner. As for NaBu-only treatment, RELA expression at day 7 in treated cells was reduced to baseline due to progressive differentiation (Figure 5(b)).
NF-κB activation by NaBu was investigated for the ratio between the phosphorylated RelA (pRelA) and the total p65 subunit. Lower NaBu concentrations at 24 h (NaBu 5.0 × 10⁻⁴ M) and 48 h (NaBu 10−4 M) slightly but significantly activated NF-κB. Instead, NF-κB activation induced by NaBu at both 5.0 × 10⁻⁴ and 10−3 M was significantly reduced at day 7 as compared to the previous time points and the CTRL and NaBu 10−4 M (Figure 6(a)). At 24 h, TNFα and TNFα + NaBu combined treatment did not modify NF-κB activation as compared to the CTRL. At 48 h, TNFα and TNFα + NaBu 1.0 × 10⁻⁴ M had activating effects on NF-κB as compared to the CTRL and other treatments, and also as compared to 24 h (TNFα + NaBu 10−4 M). At day 7, consequent to all combined treatments except CTRL, NF-κB activation was reduced as compared to 24 and 48 h. However, while TNFα had no effect, the presence of NaBu dose-dependently reduced NF-κB activation (Figure 6(b)).
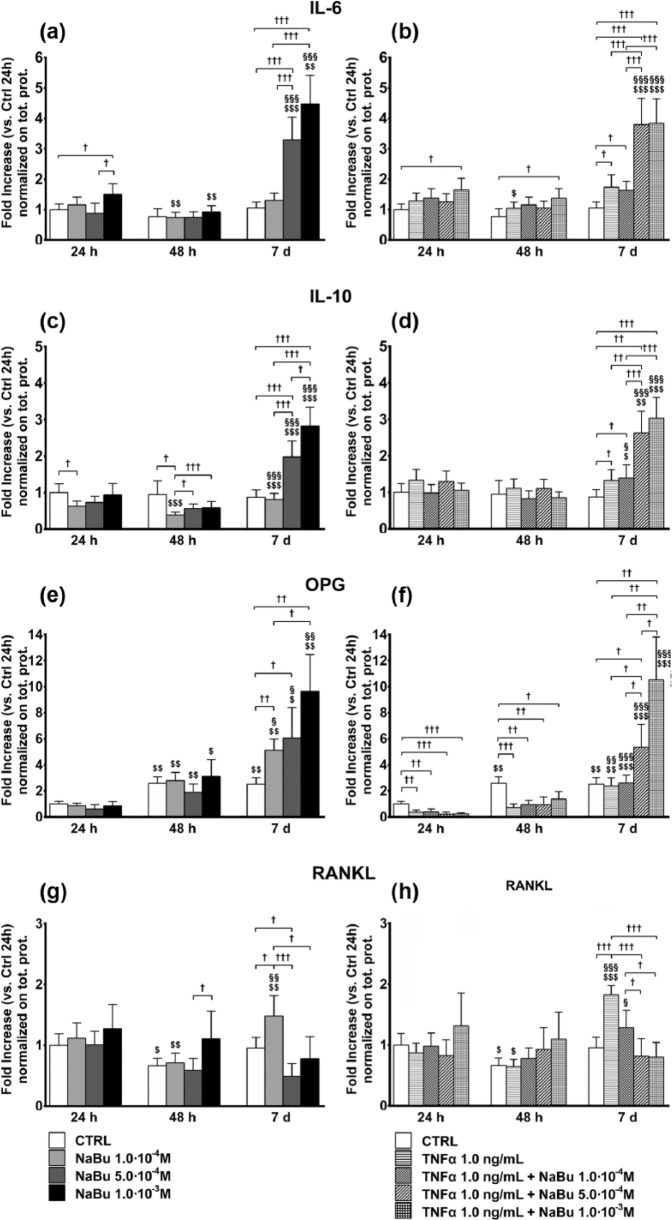
We then assessed the effects of treatment on concentrations of secreted cytokines (IL-6, IL-10, RANKL, and OPG) representative of the pro-inflammatory and pro-osteolytic phenotype in bone tumors. Together with the confirmation of the greater effect of NaBu after 7 days of treatment, cytokine measurement indicated a steep induction of the expression of anti-inflammatory mediators (IL-10 and OPG) unbalancing their ratio with the pro-inflammatory effector RANKL. At 24 h, IL-6 was induced by NaBu 10−3 M. At 48 h, it was slight decreased by NaBu 10−4 M and NaBu 10−3 M as compared to 24 h although not different from its relative control at 48 h. At day 7, NaBu 5.0 × 10⁻⁴ M and NaBu 10−3 M strongly increased (four- to fivefold) IL-6 content in the medium (Figure 7(a)). A similar behavior was observed following combined treatment of TNFα + NaBu, with TNFα being a weak inducer of IL-6 at 48 h and day 7, as compared to the relative controls (Figure 7(b)). The trend was similar for IL-10 (Figure 7(c) and (d)) although inhibition induced by NaBu treatments at 48 h.
Figure 7.
Cytokine concentrations in culture media. Effects of treatment on cytokine concentrations in culture media ((a, b): IL-6; (c, d): IL-10; (e, f): OPG; (g, h): RANKL) at 24 h, 48 h, and 7 days of culture. (a, c, e, and g) Cytokine concentrations in media from untreated control (CTRL) and NaBu-treated cultures. (b, d, f, and h) Cytokine concentrations in media from CTRL, TNFα-, and TNFα + NaBu-treated cultures. Repeated-measures ANOVA was used to evaluate inter-time changes for each condition ($: vs 24 h, §: vs 48 h); Student’s t-test was used to evaluate inter-group differences at each time point (†). The number of symbols indicates the significance level (P < 0.05, P < 0.01, P < 0.001).
OPG was induced in untreated cultures already at 48 h, which was not modified by NaBu treatments. At day 7, instead, OPG was dose-dependently induced by NaBu (up to 10-fold, Figure 7(e)). TNFα, alone or in combined treatment with NaBu (Figure 8(f)), repressed OPG expression at 24 and 48 h, while at day 7 TNFα + NaBu 5.0 × 10⁻⁴ M and, much more, TNFα + 10−3 M strongly increased OPG concentrations (5-fold and 12-fold, respectively).
Figure 8.
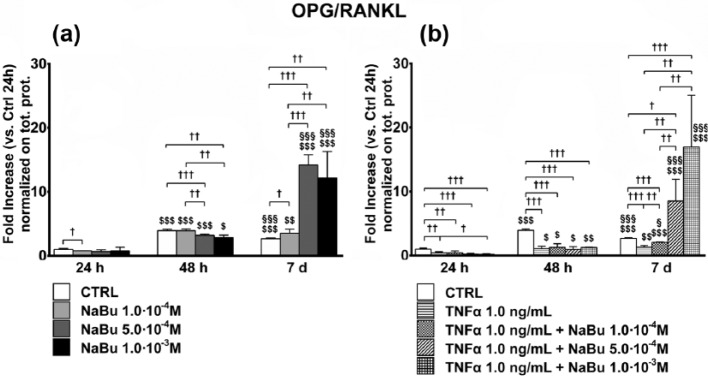
OPG-to-RANKL ratio in culture media. Effects of treatment on OPG-to-RANKL ratio concentrations in culture media at 24 h, 48 h, and 7 days of culture. (a) OPG-to-RANKL ratio in media from untreated control (CTRL) and NaBu-treated cultures. (b) OPG-to-RANKL ratio concentrations in media from CTRL, TNFα-, TNFα + NaBu-treated cultures. Repeated-measures ANOVA was used to evaluate inter-time changes for each condition ($: vs 24 h, §: vs 48 h); Student’s t-test was used to evaluate inter-group differences at each time point (†). The number of symbols indicates the significance level (P < 0.05, P < 0.01, P < 0.001).
RANKL was unaffected by treatment at 24 h, while it was downregulated at 48 h except following treatment with NaBu 10−3 M, which kept RANKL concentrations the same as at 24 h. As compared to the relative controls, RANKL was induced by NaBu 10−4 M and inhibited by NaBu 5.0 × 10⁻⁴ M at day 7 (Figure 7(g)). A similar behavior was observed in the presence of TNFα although TNFα alone exerted an inducing effect at day 7 that was reverted by NaBu 5.0 × 10⁻⁴ and 10−3 M (Figure 7(h)).
The OPG-to-RANKL ratio was slightly reduced by NaBu treatment at 24 and 48 h, comparably to TNFα treatment, while it was strongly and dose-dependently increased (up to 20-fold) by NaBu treatment, even in the presence of TNFα (Figure 8).
Discussion
Here, we report the effects of different doses of NaBu on differentiation and inflammatory phenotype expression in OS cells in vitro in the presence or not of a pro-inflammatory stimulus (TNFα) to mimic a pro-inflammatory environment similar to that found surrounding tumors. Cells grown with canonical differentiating factors were analyzed after 24 h, 48 h, and 7 days of NaBu treatment to study the acute response (24 and 48 h) and the mid-term response (day 7), in order to obtain an indication of more complex effects since SaOS-2 cells are partially differentiated and more accurately resemble the tumor phenotype.18,19
NaBu had dose- and time-dependent effects: low concentrations (10−4 M) sustained proliferation and expression of a pro-inflammatory phenotype at early time points, while high doses (5.0 × 10⁻⁴ to 10−3 M) had pro-differentiating effects inducing the expression of an anti-inflammatory, and possibly anti-osteolytic, phenotype at later time points.
The effects on proliferation, cell viability, and ALP activity (Figures 1 and 2) were limited with a greater anti-proliferative effect of NaBu 10−3 M at day 7. Although this decrease in DNA content, although also induced by the differentiation alone, could be intended as a cytotoxic effect of NaBu, the unchanged or even increased cell viability partially excluded this possibility. However, NaBu 10−3 M at 48 h increased ALP activity but not in the presence of TNFα. This could be read as an earlier induction of a functional phenotype by NaBu. ALP activity was, however, half of that of the CTRL at day 7. Unfortunately, the timing did not allow us to understand how ALP activity changed following NaBu treatment in the 5 days between the time points. ALP is a rather early differentiation marker of SaOS-2 cells;14 and our data, together with gene expression results, suggest that NaBu accelerates their differentiation.
OPN is a protein bone constituent involved in the extracellular matrix (ECM) and cell adhesion/migration depending on the balance between monomeric forms, polymeric forms (by the action of transglutaminase 2), and cleaved fragments. Secreted OPN acts as a pro-inflammatory cytokine involved in systemic inflammation, tumorigenesis, and metastatization.20
At day 7, NaBu strongly induced OPN mRNA and protein expression and modified its polymeric status (i.e. MW ⩾90 kDa21). Although its biological significance has not been investigated, this could be linked to cell motility, and, possibly, tumor invasiveness and inflammatory cells recruitment by tumor cells. Indeed, polymeric OPN creates a matrix that facilitates cell migration and functions as a chemoattractant for leukocytes.22
Previous studies have investigated the effects of BA on osteoblastic cell differentiation. Morozumi23 demonstrated that differentiation and mineralization in ROS17/2.8 cells were inhibited at 10−3 M, but bone sialoprotein (BSP) expression was increased.24 Instead, in line with our results, Katono et al.10 demonstrated that in normal human osteoblasts butyrate induced BSP, OPG, and OPN. The pro-osteogenic effect of NaBu was associated with the inhibition of HDAC1 activity25 and the enhancement of Runx2-dependent transcriptional activity.26
Primary and secondary bone tumors are frequent neoplasms. OS is the most common primary malignant tumor of bone (incidence 1–3 cases/year per million), affecting primarily children and adolescents, with a second peak at 50 years of age. Furthermore, due to its extension and vascularization, bone is the most common site for metastatization by many tumors.15
The HAT/HDAC system is a key epigenetic modulator and also a regulator for several enzymes and transcription factors: various HDACIs have been studied as anti-neoplastic agents, that is, suberanilohydroxamic acid (SAHA, Vorinostat) is approved by the United States Food and Drug Administration for the treatment of cutaneous T cell lymphoma27 and is currently in phase II/III trials for use in OS.15 Hence, regular dietary fiber intake, a prerequisite for endogenous production of HDACI NaBu, contributes to maintaining the homeostasis of various tissues including bone.
NF-κB negatively regulates osteoblast differentiation: NF-κB signaling inhibition in SaOS-2 cells decreases proliferation and enhances differentiation. Furthermore, NF-κB plays a pivotal role in the pathogenesis and progression of OS.28 Similarly, recent results indicate that NF-κB activation sustains the malignant phenotype in OS.29,30 In bone metastasis, resident osteoclasts and recruited tumor-associated macrophages (TAMs) drive metastatization.31 By releasing mediators and cytokines, tumor cells create an optimal environment for osteoclasts and TAMs, thus creating a self-sustaining cycle of bone damage and tumor-associated bony comorbidities.32 RANKL is a key mediator in this context. Expressed by osteoblast and T cells, in response to pro-inflammatory stimuli (e.g. TNFα, IL-1, IL-6), it activates NF-κB by binding its receptor activator of NF-κB (RANK) expressed on osteoclasts. OPG, a TNF-superfamily member like RANKL, antagonizes RANKL and acts as its decoy receptor.33 Tumor cells acquire the capability to express RANK, thus amplifying the effects of activation of the RANKL/RANK system and, hence, induce the expression of the plethora of soluble mediators that sustain tumor progression.34 The concept that the bone microenvironment plays a fundamental role in the progression of OS and bone metastasis is also supported by the fact that OPG does not directly affect tumor cells but rather inhibits osteolysis.35 The OPG/RANKL ratio, a key factor in determining cancer-associated osteolysis,36 is decreased in severe osteolysis.37
We observed that RelA expression, a NF-κB subunit, was unaffected by NaBu, but in the presence of TNFα RelA expression, it was downregulated at 24 and 48 h. Notably, TNFα induced RelA at 48 h, which was dose-dependently contrasted by NaBu (Figure 5). We then demonstrated that NaBu dose-dependently inhibited NF-κB activation at day 7, contrarily to a slight decrease induced by lower doses at earlier time points (Figure 6). This was associated with a strong increase in IL-6 (which can be considered an anti-inflammatory cytokine, depending on the molecular context38), IL-10, and OPG production and decrease in RANKL which was, instead, strongly induced by TNFα (Figure 7). The OPG/RANKL ratio was sustained by differentiation, increased 15-fold by NaBu and reduced by TNFα (Figure 8).
Several studies have described the association between the gut microbiome composition with several pathological conditions, including tumors, chronic inflammation, and bone metabolic disease.39 Being butyrate a representative product of bacteria resident within the gut, it is licit to hypothesize that it acts as a mediator of the gut microbiome activity.
A recently published paper, by reviewing the literature, indicates that the biology of mineralized tissue (i.e. bone and teeth) is strikingly dependent upon HDACs activity and their modulators. This activity is explicated through the control of the regional conformation of DNA and hence through the control of the expression key genes.40 Our data confirm this hypothesis but also suggest the activation of other mechanisms, possibly chromatin-independent, as is the action of HDAC on other targets (e.g. NF-κB) as previously reported in several models.41
Although physiological blood concentrations of NaBu barely exceed 0.5 mM after a fiber-rich meal, the supra-physiological doses of NaBu used here take into account the simplicity of the cellular model. Our results highlight the possible beneficial effects of NaBu on bone and, eventually, in the more general prevention of bone-associated tumors.
This study has several limitations that make further studies necessary. A first limitation is represented by the evidence of only slight effects induced by TNFα and, above all, on the activation of NF-κB (Figure 6). This would be due to the low TNFα concentration used (1 ng/mL) compared to those generally used to induce a strong inflammatory response in these cells (10 ng/mL).42,43 However, in our setting, we wanted to reproduce a low-grade chronic inflammatory condition and, hence, a low TNFα concentration was used.44,45 Additional studies should be also carried on in order to evaluate the effects of NaBu on short-term TNFα-treatments in order to better investigate the effects of butyrate on the acute NF-κB activation. The study is also limited by the lack of the investigation of possible cytotoxic effects of NaBu which would be helpful in understanding the anti-proliferative action of this microbial derivative.
In summary, taken together, our results show that NaBu affects OS cell metabolism by inducing differentiation and the expression of anti-inflammatory mediators. The mild pro-inflammatory effects of TNFα are counteracted by high doses of NaBu, especially after a mid-term treatment regimen.
Acknowledgments
S.P. and V. S. contributed equally to the work.
Footnotes
Declaration of conflicting interests: The author(s) declared no potential conflicts of interest with respect to the research, authorship, and/or publication of this article.
Funding: This work was funded by the Italian Ministry of Health.
ORCID iDs: Silvia Perego  http://orcid.org/0000-0002-4996-8130
Veronica Sansoni  http://orcid.org/0000-0003-0337-975X
Giuseppe Banfi  http://orcid.org/0000-0001-9578-5338
Giovanni Lombardi  http://orcid.org/0000-0002-8365-985X
References
- 1. Bach Knudsen KE, Serena A, Canibe N, et al. (2003) New insight into butyrate metabolism. Proceedings of the Nutrition Society 62: 81–86. [DOI] [PubMed] [Google Scholar]
- 2. Israel M, Schwartz L. (2011) The metabolic advantage of tumor cells. Molecular Cancer 10: 70. [DOI] [PMC free article] [PubMed] [Google Scholar]
- 3. Goncalves P, Martel F. (2013) Butyrate and colorectal cancer: The role of butyrate transport. Current Drug Metabolism 14: 994–1008. [DOI] [PubMed] [Google Scholar]
- 4. Bultman SJ. (2014) Molecular pathways: Gene-environment interactions regulating dietary fiber induction of proliferation and apoptosis via butyrate for cancer prevention. Clinical Cancer Research 20: 799–803. [DOI] [PMC free article] [PubMed] [Google Scholar]
- 5. Pajak B, Orzechowski A, Gajkowska B. (2007) Molecular basis of sodium butyrate-dependent proapoptotic activity in cancer cells. Advances in Medical Sciences 52: 83–88. [PubMed] [Google Scholar]
- 6. Brand-Miller JC. (2003) Glycemic load and chronic disease. Nutrition Reviews 61: S49–S55. [DOI] [PubMed] [Google Scholar]
- 7. Davie JR. (2003) Inhibition of histone deacetylase activity by butyrate. Journal of Nutrition 133: 2485S–2493S. [DOI] [PubMed] [Google Scholar]
- 8. Donohoe DR, Collins LB, Wali A, et al. (2012) The Warburg effect dictates the mechanism of butyrate-mediated histone acetylation and cell proliferation. Molecular Cell 48: 612–626. [DOI] [PMC free article] [PubMed] [Google Scholar]
- 9. Vinolo MA, Rodrigues HG, Nachbar RT, et al. (2011) Regulation of inflammation by short chain fatty acids. Nutrients 3: 858–876. [DOI] [PMC free article] [PubMed] [Google Scholar]
- 10. Katono T, Kawato T, Tanabe N, et al. (2008) Sodium butyrate stimulates mineralized nodule formation and osteoprotegerin expression by human osteoblasts. Archives of Oral Biology 53: 903–909. [DOI] [PubMed] [Google Scholar]
- 11. Lamour V, Detry C, Sanchez C, et al. (2007) RUNX2- and histone deacetylase 3-mediated repression is relieved in differentiating human osteoblast cells to allow high bone sialoprotein expression. Journal of Biological Chemistry 282: 36240–36249. [DOI] [PubMed] [Google Scholar]
- 12. Lombardi G, Perego S, Luzi L, et al. (2015) A four-season molecule: Osteocalcin. Updates in its physiological roles. Endocrine 48: 394–404. [DOI] [PubMed] [Google Scholar]
- 13. Xie C, Wu B, Chen B, et al. (2016) Histone deacetylase inhibitor sodium butyrate suppresses proliferation and promotes apoptosis in osteosarcoma cells by regulation of the MDM2-p53 signaling. Oncotargets and Therapy 9: 4005–4013. [DOI] [PMC free article] [PubMed] [Google Scholar]
- 14. Czekanska EM, Stoddart MJ, Richards RG, et al. (2012) In search of an osteoblast cell model for in vitro research. European Cells & Materials 24: 1–17. [DOI] [PubMed] [Google Scholar]
- 15. Kansara M, Teng MW, Smyth MJ, et al. (2014) Translational biology of osteosarcoma. Nature Reviews Cancer 14: 722–735. [DOI] [PubMed] [Google Scholar]
- 16. Van Driel M, van Leeuwen JP. (2014) Cancer and bone: A complex complex. Archives of Biochemistry and Biophysics 561: 159–166. [DOI] [PubMed] [Google Scholar]
- 17. Abu-Amer Y. (2009) Inflammation, cancer, and bone loss. Current Opinion in Pharmacology 9: 427–433. [DOI] [PMC free article] [PubMed] [Google Scholar]
- 18. Czekanska EM, Stoddart MJ, Ralphs JR, et al. (2014) A phenotypic comparison of osteoblast cell lines versus human primary osteoblasts for biomaterials testing. Journal of Biomedical Materials Research Part A 102: 2636–2643. [DOI] [PubMed] [Google Scholar]
- 19. McAllister SS, Weinberg RA. (2014) The tumour-induced systemic environment as a critical regulator of cancer progression and metastasis. Nature Cell Biology 16: 717–727. [DOI] [PMC free article] [PubMed] [Google Scholar]
- 20. Kahles F, Findeisen HM, Bruemmer D. (2014) Osteopontin: A novel regulator at the cross roads of inflammation, obesity and diabetes. Molecular Metabolism 3: 384–393. [DOI] [PMC free article] [PubMed] [Google Scholar]
- 21. Arjomandi M, Frelinger J, Donde A, et al. (2011) Secreted osteopontin is highly polymerized in human airways and fragmented in asthmatic airway secretions. PLoS ONE 6: e25678. [DOI] [PMC free article] [PubMed] [Google Scholar]
- 22. Nishimichi N, Hayashita-Kinoh H, Chen C, et al. (2011) Osteopontin undergoes polymerization in vivo and gains chemotactic activity for neutrophils mediated by integrin alpha9beta1. Journal of Biological Chemistry 286: 11170–11178. [DOI] [PMC free article] [PubMed] [Google Scholar]
- 23. Morozumi A. (2011) High concentration of sodium butyrate suppresses osteoblastic differentiation and mineralized nodule formation in ROS17/2.8 cells. Journal of Oral Science 53: 509–516. [DOI] [PubMed] [Google Scholar]
- 24. Yang L, Li Z, Li X, et al. (2010) Butyric acid stimulates bone sialoprotein gene transcription. Journal of Oral Science 52: 231–237. [DOI] [PubMed] [Google Scholar]
- 25. Lee HW, Suh JH, Kim AY, et al. (2006) Histone deacetylase 1-mediated histone modification regulates osteoblast differentiation. Molecular Endocrinology 20: 2432–2443. [DOI] [PubMed] [Google Scholar]
- 26. Schroeder TM, Westendorf JJ. (2005) Histone deacetylase inhibitors promote osteoblast maturation. Journal of Bone and Mineral Research 20: 2254–2263. [DOI] [PubMed] [Google Scholar]
- 27. Iwamoto M, Friedman EJ, Sandhu P, et al. (2013) Clinical pharmacology profile of vorinostat, a histone deacetylase inhibitor. Cancer Chemotherapy and Pharmacology 72: 493–508. [DOI] [PubMed] [Google Scholar]
- 28. Andela VB, Sheu TJ, Puzas EJ, et al. (2002) Malignant reversion of a human osteosarcoma cell line, SaOS-2, by inhibition of NFkappaB. Biochemical and Biophysical Research Communications 297: 237–241. [DOI] [PubMed] [Google Scholar]
- 29. Lu J, Song G, Tang Q, et al. (2015) IRX1 hypomethylation promotes osteosarcoma metastasis via induction of CXCL14/NF-kappaB signaling. Journal of Clinical Investigation 125: 1839–1856. [DOI] [PMC free article] [PubMed] [Google Scholar]
- 30. Mori K, Le Goff B, Berreur M, et al. (2007) Human osteosarcoma cells express functional receptor activator of nuclear factor-kappa B. Journal of Pathology 211: 555–562. [DOI] [PubMed] [Google Scholar]
- 31. Endo-Munoz L, Evdokiou A, Saunders NA. (2012) The role of osteoclasts and tumour-associated macrophages in osteosarcoma metastasis. Biochimica Et Biophysica Acta 1826: 434–442. [DOI] [PubMed] [Google Scholar]
- 32. Buenrostro D, Mulcrone PL, Owens P, et al. (2016) The bone microenvironment: A fertile soil for tumor growth. Current Osteoporosis Reports 14: 151–158. [DOI] [PMC free article] [PubMed] [Google Scholar]
- 33. Theoleyre S, Wittrant Y, Tat SK, et al. (2004) The molecular triad OPG/RANK/RANKL: Involvement in the orchestration of pathophysiological bone remodeling. Cytokine & Growth Factor Reviews 15: 457–475. [DOI] [PubMed] [Google Scholar]
- 34. Mori K, Ando K, Heymann D, et al. (2009) Receptor activator of nuclear factor-kappa B ligand (RANKL) stimulates bone-associated tumors through functional RANK expressed on bone-associated cancer cells? Histology and Histopathology 24: 235–242. [DOI] [PubMed] [Google Scholar]
- 35. Lamoureux F, Richard P, Wittrant Y, et al. (2007) Therapeutic relevance of osteoprotegerin gene therapy in osteosarcoma: Blockade of the vicious cycle between tumor cell proliferation and bone resorption. Cancer Research 67: 7308–7318. [DOI] [PubMed] [Google Scholar]
- 36. Kitazawa S, Kitazawa R. (2002) RANK ligand is a prerequisite for cancer-associated osteolytic lesions. Journal of Pathology 198: 228–236. [DOI] [PubMed] [Google Scholar]
- 37. Grimaud E, Soubigou L, Couillaud S, et al. (2003) Receptor activator of nuclear factor kappaB ligand (RANKL)/osteoprotegerin (OPG) ratio is increased in severe osteolysis. American Journal of Pathology 163: 2021–2031. [DOI] [PMC free article] [PubMed] [Google Scholar]
- 38. Lombardi G, Sanchis-Gomar F, Perego S, et al. (2016) Implications of exercise-induced adipo-myokines in bone metabolism. Endocrine 54: 284–305. [DOI] [PubMed] [Google Scholar]
- 39. Ohlsson C, Sjogren K. (2017) Osteomicrobiology: A new cross-disciplinary research field. Calcified Tissue International. Epub ahead of print 27 October 2017. DOI: 10.1007/s00223-017-0336-6. [DOI] [PMC free article] [PubMed] [Google Scholar]
- 40. Huynh NC, Everts V, Ampornaramveth RS. (2017) Histone deacetylases and their roles in mineralized tissue regeneration. Bone Reports 7: 33–40. [DOI] [PMC free article] [PubMed] [Google Scholar]
- 41. Quivy V, Van Lint C. (2004) Regulation at multiple levels of NF-kappaB-mediated transactivation by protein acetylation. Biochemical Pharmacology 68(6): 1221–1229. [DOI] [PubMed] [Google Scholar]
- 42. Ammendola S, Loreto MD, d’Abusco AS. (2017) Modulatory effects of a nutraceutical supplement on SaOS-2 cells reveal its phlebotonic activity. Journal of American College of Nutrition 36(4): 268–272. [DOI] [PubMed] [Google Scholar]
- 43. Ghali O, Chauveau C, Lencel P, et al. (2010) RUNX2 regulates the effects of TNFα on proliferation and apoptosis in SaOS-2 cells. Bone 46: 901–910. [DOI] [PubMed] [Google Scholar]
- 44. Frost A, Jonsson KB, Nilsson O, et al. (1997) Inflammatory cytokines regulate proliferation of cultured human osteoblasts. Acta Orthopaedica Scandinavica 68(2): 91–96. [DOI] [PubMed] [Google Scholar]
- 45. Daniele S, Natali L, Giacomelli C, et al. (2017) Osteogenesis is improved by low tumor necrosis factor alpha concentration through the modulation of Gs-coupled receptor signals. Molecular Cell Biology 37(8): e00442-16. [DOI] [PMC free article] [PubMed] [Google Scholar]


