

Summary
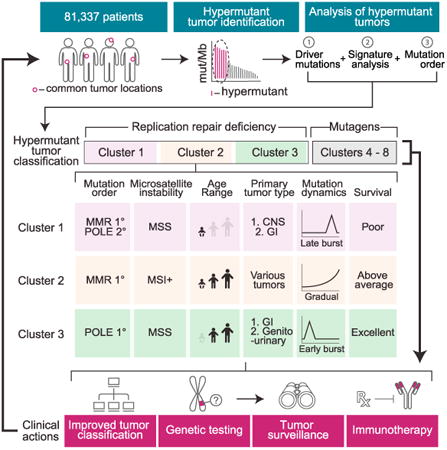
We present an extensive assessment of mutation burden through sequencing analysis of >81,000 tumors from pediatric and adult patients, including tumors with hypermutation caused by chemotherapy, carcinogens, or germline alterations. Hypermutation was detected in tumor types not previously associated with high mutation burden. Replication repair deficiency was a major contributing factor. We uncovered new driver mutations in the replication-repair-associated DNA polymerases and a distinct impact of microsatellite instability and replication repair deficiency on the scale of mutation load. Unbiased clustering, based on mutational context, revealed clinically relevant subgroups regardless of the tumors' tissue of origin, highlighting similarities in evolutionary dynamics leading to hypermutation. Mutagens, such as UV light, were implicated in unexpected cancers, including sarcomas and lung tumors. The order of mutational signatures identified previous treatment and germline replication repair deficiency, which improved management of patients and families. These data will inform tumor classification, genetic testing, and clinical trial design.
Graphical abstract
A large-scale analysis of hypermutation in human cancers provides insights into tumor evolution dynamics and identifies clinically actionable mutation signatures.
Introduction
Mutations in cancer genes can be inherited, spontaneously arise in premalignant cells, or be acquired over time during tumor evolution (Stratton et al., 2009). It is often difficult to determine, from the sequencing of the diagnostic specimen alone, which mutations arose first or whether their order is important in driving tumorigenesis and/or enabling therapeutic resistance. The ultimate aggregate mutation count, termed mutation burden, is influenced by the tumor type, but is also affected by mutagenic processes shared across cancer types. All together, these factors contribute to only modest variations in burden; most tumors have a relatively low number of somatic mutations. Yet there is emerging evidence that outliers with much higher mutation burdens (hypermutation) do exist for many cancer types. Systematic retrospective sequencing efforts, such as those by The Cancer Genome Atlas (TCGA) and International Cancer Genome Consortium (ICGC), have confirmed frequent hypermutation in melanoma (Akbani et al., 2015), lung (Govindan et al., 2012), and bladder cancer (Weinstein et al., 2014) and uncovered rare cases of hypermutation in other cancers. These studies have used different thresholds as there is no agreed on definition of “hypermutation.” Larger unbiased cohorts are needed to define cut-offs for hypermutation, not only to understand its frequency across cancer but also to uncover common mutagenic processes associated with hypermutation, whose temporal order is important but usually unknown.
A deeper understanding of the forces and dynamics of hyper-mutagenesis would be clinically useful. First, there is an urgent need to define driver mutations in cancer genomes. This is especially difficult in hypermutant cancers due to the sheer abundance of passenger variants that can obscure true drivers. Second, understanding early drivers of hypermutation may be useful for predicting the cancer's evolutionary trajectory and accumulation of additional mutations. Finally, hypermutation is correlated with response to immune checkpoint inhibitors, which can lead to durable remissions in some patients (Bouffet et al., 2016; Johanns et al., 2016; Le et al., 2015; Rizvi et al., 2015; Santin et al., 2016; Van Allen et al., 2015).
Hypermutation can be caused by environmental factors (extrinsic exposures). UV light is the primary cause of the high numbers of mutations in malignant melanoma (Pfeifer et al., 2005; Sage, 1993). Similarly, the >60 carcinogens in tobacco smoke are the primary cause of hypermutation in tumors in the lung and larynx, as well as other tumors, due to direct mutagen exposure (Pleasance et al., 2010). Recently, several intrinsic sources of hypermutation have been described. Dysregulation of apolipoprotein B mRNA editing enzyme, catalytic polypeptide-like (APOBEC) family members, has been shown to result in increased levels of C to T transitions in a wide range of cancers (Roberts et al., 2013). Defective DNA replication repair by mutations that compromise proofreading, performed by the major replicative enzymes Polε and Polδ1, or DNA mismatch repair, are associated with hypermutation in colorectal, endometrial, and other cancers (Kandoth et al., 2013; Muzny et al., 2012). DNA replication repair mutations are also found in cancer predisposition syndromes, such as constitutional or biallelic mismatch repair deficiency (CMMRD), Lynch syndrome, and polymerase proofreading-associated polyposis (PPAP). Although data gathered by the International Biallelic Mismatch Repair Deficiency consortium revealed that all malignant CMMRD cancers are hypermutant (Bouffet et al., 2016), it is not known if the same is true in Lynch syndrome or PPAP. Importantly, replication repair defects can lead to acquired resistance to common genotoxic therapies, such as alkylating agents (van Thuijl et al., 2015). It would be of utmost importance to utilize tumor sequencing to define the order of mutagen exposure or intrinsic processes leading to hypermutation and predict therapy resistance.
Mutagenic processes leave imprints on the genome in the form of mutations in a specific nucleotide context, forming a unique signature. This is especially true for hypermutant cancers whose vast numbers of non-random mutations form a signature that is deeply engraved on the genome. The first taxonomic classification of signatures unveiled >20 signatures in 30 cancer types (Alexandrov et al., 2013). These have since been refined and expanded (Morganella et al., 2016; Nik-Zainal et al., 2016). However, the driving forces of rarer hypermutation-associated signatures, seen in fewer tumors, are mostly unknown.
To address these issues, we examined 78,452 adult and 2,885 childhood cancers for hypermutation. Targeted regions of the genome were deeply sequenced using a validated cancer gene panel (Frampton et al., 2013). We analyzed the range and frequency of hypermutation between and within cancer types, measured the contribution of intrinsic and extrinsic mutators and used mutation signatures to accurately predict past mutagen exposure. We then performed exome and/or genome sequencing of patients with CMMRD (Shlien et al., 2015) or treatment-induced cancers—whose mutations were acquired in an established order—to model mutation dynamics in the tumors. These data have important implications for our understanding of how germline and acquired mutagenic forces govern tumorigenesis, which have already improved the clinical management of patients with hypermutant cancers and their families.
Results
Hypermutation Is Enriched for Replication Repair Defects in Childhood Cancers
We first wanted to define a minimal threshold for hypermutation, to create a definition that could ultimately be used in a clinical setting. We sequenced a cohort of 35 tumor samples with low, medium, and high number of substitutions by exome, genome, and two separate targeted panel sequencing consisting of 315 and 884 genes covering 1.1 and 3.25 Mb, respectively (Table S1). We achieved excellent concordance in burden between modalities (R2 = 0.94; Figures S1A and S1B). After carefully considering sequencing depth, the mutations' allele fractions, and the total footprint of each method, we found that every hypermutated cancer (>10 Mut/Mb) was called by all sequencing methods.
Having validated panel-based hypermutation testing, we examined the mutation burden in 2,885 pediatric tumors. Mutation frequency ranged from 0–864 Mut/Mb (Figure 1A), with a mean and median of 6.78 Mut/Mb and 2.50 Mut/Mb, respectively. Using segmented linear regression analysis, we calculated 9.91 and 9.0 Mut/Mb as appropriate thresholds for hypermutation in childhood and adult cancers (Figures S1C and S1D; STAR Methods). For consistency, we use 10 Mut/Mb to define hypermutation in both cohorts. We also note that this coincides with the median mutation burden of patients previously reported to respond to checkpoint inhibition (Bouffet et al., 2016; Diaz and Le, 2015; Johanns et al., 2016; Le et al., 2015; Rizvi et al., 2015; Santin et al., 2016; Snyder et al., 2014; Van Allen et al., 2015).
Figure 1. The Landscape of Hypermutation across 81,337 Pediatric and Adult Cancers.

(A) Mutation burden for 2,885 pediatric cancers. ≥ 10 mut/Mb = hypermutant; ≥ 100 mut/Mb = ultra-hypermutant.
(B) Hypermutation pediatric cohort by tumor type. The pie chart depicts the proportion of tumors with mutations in replication repair genes (MSH2, MLH1, MSH6, PMS2 POLE, and POLD1).
(C) Mutation burden range for 78,452 adult tumors with breakdown by tumor type.
(D) Tumor types that show enrichment for MSI-MSI-H tumors cluster in the 10–100 Mut/Mb range, while tumors with mismatch repair and polymerase proofreading in the same types are ultrahypermutant.
(E) Proportion of ultra-hypermutant, hypermutant, and lowly mutated tumors, and their correlation with MSI-H and MMR/POL mutations. GI, gastrointestinal; AML, acute myeloid leukemia; NBL, neuroblastoma; RMS, rhabdomyosarcoma; STS, soft tissue sarcoma; OS, osteosarcoma; EWS, Ewing sarcoma; WLMS, Wilm's tumor; RCC, renal cell carcinoma; NP&PNS, nasopharynx and paranasal sinuses undifferentiated carcinoma; and MM&MDS, mutiple myeloma and myelodysplastic syndrome.
See also Figures S1 and S2 and Table S1.
While childhood cancer genomes are typically thought of as “quiet,” we found 160 cases with >10 Mut/Mb (5.5%). Hypermutation was observed in childhood cancer types not typically associated with elevated numbers of mutations, including sarcomas, germ cell tumors, nephroblastomas, and neuroblastomas. Importantly, across the whole cohort, hypermutant cancers were enriched for defects in mismatch repair pathway genes POLE and POLD1, responsible for synthesis of the leading and lagging strand (p ≤ 2.2 × 10⁻¹⁶) (Figure 1B). Ultra-hypermutated (>100 Mut/Mb) pediatric tumors were universally replication repair deficient and included only the three tumor types observed in CMMRD: malignant gliomas, colorectal cancers, and leukemias/lymphomas.
Replication Repair Deficiency Drives a Mutator Phenotype in Many Childhood and Adult Cancers
Functioning DNA replication repair is required by actively dividing cells. And replication errors are responsible for two-thirds of mutations in cancer (Tomasetti et al., 2017). Yet, thus far, replication-repair-deficient hypermutation has been mainly observed in gliomas, gastrointestinal tract cancers, and endometrial cancers.
We expanded our analysis of hypermutation to 78,452 adult cancers sequenced on the same panel. Hypermutation and ultra-hypermutation were observed in 17% and 0.6%, respectively, across a wide variety of tissues (Figures 1C and 1D). A close examination of these cancers revealed enrichment of replication repair mutations and microsatellite instability in 81 tumor types (Figure S2A). These include previously underreported hypermutant prostate, cervical, and neuroendocrine tumors (87, 84, and 278 cancers).
A striking inverse association was observed between micro-satellite instability (MSI), a marker of mismatch repair deficiency, and mutation burden. High levels of microsatellite instability (MSI-H) was mostly restricted to tumors in the 10–100 Mut/Mb range, whereas tumors with >100 Mut/Mb were microsatellite stable and enriched for replicative polymerase mutations (Figures 1E and S2B). Thus, while the loss of mismatch repair ability alone is mutagenic, its combination with the loss of polymerase proofreading (Shlien et al., 2015), and the resultant total replication repair deficiency, leads to an ultra-hypermutated state with microsatellite stability. These data suggest that tumors with complete replication repair deficiency have elevated mutation burdens, acquired with different temporal dynamics than MSI tumors.
Detection and Validation of Cancer Drivers Using an “In Vivo Human Mutagenesis Screen”
While clinical sequencing is becoming routine in multiple institutions, accurate classification of variants has remained a challenge (both for germline and for somatic). In most cases, there is no functional assay available to determine if variants are true pathogenic drivers, and thus most are typically classified as “variants of unknown significance.” Here, we used hypermutation to catalog driver mutations in the replication repair genes. Determining the pathogenicity of mutations in POLE and POLD1, as it is with many large genes, is a challenge, especially since they can be mutated without functional impact. Indeed, we observed 2,150 and 1,123 distinct variants in POLE and POLD1, including many encoding changes at novel positions (Table S2; STAR Methods). As expected, among childhood cancers, most POLE and POLD1 mutations were not associated with hypermutation (Figure S2C).
We reasoned that we could determine which variants are in fact true drivers by leveraging the large size of this cohort. A mutation was classified as a clear driver if it was found in a hypermutated tumor and not in those with a low burden (STAR Methods). Using this approach, which can be thought of as an “in vivo human mutagenesis screen,” we rediscovered every known POLE and POLD1 driver (known to cause hypermutation in human tumors with functional validation) (Albertson et al., 2009; Daee et al., 2010; Kane and Shcherbakova, 2014). We found 11 new driver mutations that were all consistently associated with hypermutation (7 new drivers in POLE and 4 in POLD1; Table S3). This is especially important in POLD1, the lagging strand polymerase, for which driver mutations are less well characterized. R689W was the most frequent driver in POLD1, which has been shown to be a mutator in yeast (Daee et al., 2010). To our knowledge this is the first series of primary tumors that validates this in humans. Just as importantly, we determined that many mutations are mere passengers, even in tumors with multiple polymerase mutations (Figure 2A). POLE R446Q, which was observed in a large group of non-hypermutated cancers, is one such false positive. Confirming our classification as non-pathogenic, we observed that the allelic fraction of the mutation was ∼0.5, suggesting a germline heterozygous SNP (Figure S3A). Furthermore, we also found this variant in the germline of non-affected individuals (>1/2,000 ExAC) (Lek et al., 2016).
Figure 2. Characterization of Known and Novel POLE and POLD1 Drivers.

(A) Examples of tumors with three or more POLE/POLD1 mutations. Other tumors found in the entire dataset harboring the same mutations shown below (gray bars represent individual tumors and their burden is shown on the y axis). No bars indicate no other tumors identified with this mutation. One clear driver emerges in each tumor.
(B) Landscape of drivers (top) and passengers (bottom) in POLE and POLD1. Green circles, previously known drivers; yellow circles, novel drivers, first described here.
(C) Codons in POLE with driver mutations, indicating whether they are sensitive to amino acid changes. Invariable codons are those at which only one amino acid change was detected. Insensitive codons are those in which the mutation burden was high, regardless of amino acid change. Sensitive codons are those in which certain amino acid changes would abrogate the mutator effect. Green, yellow, and red bars represent strong, moderate, and weak mutation burden phenotypes, respectively.
(D) All tumors harboring POLE and POLD1 mutations by tumor type. Green, POLE driver; yellow, POLD1 driver; and gray, passenger mutation.
See also Figure S3 and Tables S2 and S3.
This proved to be a powerful approach for exploring the effects of different missense substitutions in the polymerases on genome-wide mutation burden, both for mutations at the exact same residue and for those located in different protein domains. Remarkably, tumors with exonuclease mutations at highly conserved motifs of POLD1 (ExoI,II,III) were not consistently hypermutant. These variants may be so detrimental to the cell that it requires additional suppressor mutations to reduce the burden (Herr et al., 2011). In both POLD1 and POLE, driver mutations were uncovered outside the exonuclease domain (Figure 2B), suggesting that other domains may be responsible for proofreading. We then used an unbiased approach and looked at all driver POLE mutations to compare the impact of differing missense substitutions at the same residue. For example, we found that POLE V411 is associated with an extremely high mutation burden but only when mutated to leucine (we labeled these residues as “invariable” as only a single possible amino acid change was found; Figure 2C). Residues S461, Y458, and E978 in POLE seem to be insensitive to change, with all amino acid substitutions associated with hypermutation. In contrast, at other residues, the mutation load varied depending on the specific amino acid change. Leucine 424 is one such “sensitive” residue; it is associated with a strong mutator phenotype when replaced with a proline or isoleucine, but is associated with lower mutation burden when mutated to a valine or phenylalanine (p = 0.03). To validate this finding, we measured the excision rate constants for wild-type POLE, and the L424V and L424I mutations using a rapid chemical quench-flow apparatus (Zahurancik et al., 2014; STAR Methods). L424I had a 5.7-fold stronger excision effect than L424V, confirming the dramatic difference in mutation burden in the primary tumors (Figure S3B). In contrast, every D275 mutation mutates an essential active site residue, which coordinates a metal ion required for catalysis, and yet we see a 10-fold difference in mutation burden (between D275G, D275A, and D275V). The difference between sensitive and insensitive amino acids can be related to the structure of the exonuclease and physical/biochemical interactions with the mismatches in the DNA.
Using this screen to triage functional variants, we mapped the landscape of driver somatic mutation in POLE and POLD1. These observations are key in the precise definition of real drivers in POLE and POLD1 cancers and can solve issues raised by recent sequencing efforts, which uncovered POLE and POLD1 germline variants of unknown significance in children with cancer (Zhang et al., 2016).
Finally, although most POLE and POLD1 driver mutations were restricted to specific tumor types with no previously apparent signature (Figure 2D), driver mutations were also observed in melanoma and lung cancer, both of which are malignancies with well-described extrinsic causes of hypermutation and distinct signatures. These data suggest that hypermutation can arise from a variety of sources in a single tumor histotype.
Novel Sub-clustering of Hypermutant Cancer Based on Substitution Signatures
To study the context and footprints of hypermutation across all cancers, we studied 217,086 mutations in 1,521 hypermutant tumors representing to our knowledge the largest collection of hypermutated cancers to be considered together (Table S4; STAR Methods). We classified every mutation, whether coding or not, by its nucleotide context (i.e., bases immediately preceding and following it, forming a trinucleotide). Then, using the proportion of the 96 possible trinucleotides, we performed unsupervised clustering of all 1,521 tumors. Taking the whole map into view, several known clusters emerged, including replication repair dominated tumors (left in Figure 3A), skin cancers with a distinctive UV-associated signature and two tobacco smoking clusters (right in Figure 3A).
Figure 3. Unsupervised Clustering by Trinucleotide Context Reveals Mutational Etiology of Hypermutant Tumors.

(A) Top: Hierarchical clustering of 1,521 tumors by trinucleotide context reveals 8 major clusters. Middle: Disease type, MSI status. Bottom: Heatmap colored by proportion of mutations from each class of mutational signatures.
(B) Top: Range of tumors types found in clusters C1, C2, and C3, size of circle indicates number of tumors. Middle: Boxplots displaying mutation burden. Bottom: Proportion of tumors in each cluster that are MSI-high, POLE mutant, and arising in children, respectively.
(C) Average proportion of mutations attributed by 4 mutational signature classes, tobacco smoke (signature 4), alkylating agents (signature 11), UV Light (signature 7), and APOBEC (signatures 2 and 13). Color of circles indicates the cluster that tumors belong to; size indicates the number of tumors in this cluster and tumor type; and the y axis indicates the average proportion of mutations attributed to each signature.
See also Figure S4 and Table S4.
The non-replication-repair-deficient cancers comprised four distinct clusters (labeled C4 to C8 on the right of Figure 3A). Viewing the overall landscape of these four clusters, they were roughly divided by already known mutagenic signatures (Alexandrov et al., 2013): tobacco smoke (C4 and C8), alkylating agents (C5), UV light (C6), and the APOBEC cytidine deamination signature (C7). These four mutagens “anchor” their clusters, which contain the expected cancer types (e.g., C6 has a strong core of UV-associated skin cancers). However, our results revealed that the major mutagens act more broadly than previously thought and that the canonical mutagen-tumor-type relationships do not always hold or are not exclusive. Thus, using an unsupervised approach on a broad range of cancers, we saw surprising similarity in signatures between different cancer types, pointing to broadly shared driving forces. These unexpected results can impact the management of patients with hypermutant cancer.
Lung cancer is one such example (Figure 3C). Of the most abundantly mutated lung cancers examined here (STAR Methods), only 40% harbor the signature for tobacco smoke. We find that 35% of hypermutated lung tumors have a high proportion of the UV signature (>40% contribution) and 5% have evidence for alkylating agent-associated mutations (n = 100). Furthermore, the UV-light-associated signature was almost exclusively observed in the squamous cell carcinoma subtype (Figures S4A–S4C). This observation was previously reported for three hypermutant lung squamous cell carcinomas (Campbell et al., 2016). Either these are all misdiagnosed skin cancers with metastasis to the lung, as has previously been suggested, or perhaps, when hypermutated they form a distinct group based on a nucleotide context that reflects their cell of origin.
Sarcomas – tumors not previously associated with hypermutation—also clustered in an unexpected way. Hypermutated sarcomas were primarily in cluster C6—a large proportion of cases (70%) had high levels of UV-associated mutations (Figure 3C). We validated this finding using available TCGA sarcoma data (exomes; Figure S4D), confirming that most hypermutated sarcomas bear the imprint of sun exposure. Cluster C6 is enriched for soft tissue angiosarcomas, which usually present on the face and scalp (Dossett et al., 2015), and malignant peripheral nerve sheath tumor, which can also arise subcutaneously. Consistent with this, the pathology records of TCGA sarcomas cancers with high UV-associated mutations were mostly superficial tumors. Thus, through this analysis, we have shown that UV light is associated with mutagenesis of mesenchymal cells, not just skin epithelia and that these sarcomas may result from sun exposure.
Alkylating agents, such as temozolomide, are known mutagens that leave a specific imprint on the genome. One of our clusters, C5, is dominated by brain cancers with overwhelming contribution of alkylating-associated mutations (average 72%). Unexpectedly, we observed similar signatures in skin cancers (14% of the top-most mutated skin cancers in this cohort), lung cancers, pancreatic cancers and leiomyosarcomas (Figure 3C). Hypermutation should therefore be considered in any relapsed cancers treated with alkylators, regardless of its cell of origin and cancers with such signatures are inherently resistant to alkylators and should be treated with different chemotherapeutic regimens.
Strikingly, within the replication repair associated tumors, one sees at least three sharply delineated sub-clusters (C1, C2 and C3 in Figure 3B). The largest group, C2 (n = 523), is characterized by high microsatellite instability in a wide range of cancers (43 tumor types with >2 examples each). The middle-sized cluster, C3, which includes colorectal, uterine, and seven other tumor types, is made up of cancers that are almost completely microsatellite stable and POLE mutated (see Figure 1). The last DNA replication repair cluster, C1, includes many microsatellite stable brain cancers with mutated POLE. C1 is unique since it harbors a higher mutation burden (380.8 versus 277.5 Mut/Mb for C3 (p = 0.017) and 80.4 Mut/Mb for C2 (p = 8.9E-5) and includes many children. Taken together, these results expand the spectrum of cancers associated with DNA replication repair and define three new subgroups—based on trinucleotide mutation context alone—with dramatic differences in microsatellite stability, polymerase deficiency, and age.
Novel Sub-clustering Identifies Tumors with Significant Differences in Evolutionary Dynamics and Survival
We then explored differences in evolutionary dynamics of each cluster to understand how mutational burden changed over time and if this was associated with survival. We observed three prominent models of mutation accumulation in hypermutant cancer (Figure 4A).
Figure 4. Clustering Identifies Tumors with Differences in Evolutionary Dynamics and Survival.

(A) Histograms with number of single-nucleotide variants (SNVs) by variant allele fraction (VAF) in each of the 8 major clusters (Figure 3). Colors indicate the functional impact of a SNV.
(B) VAF versus median cumulative mutation burden plotted for each of the 3 replication repair clusters. C1 tumors exhibit an early burst of mutations (∼0.4 VAF) with a second burst of mutations later in tumor evolution (∼0.2 VAF). C3 tumors display a single burst of mutations ∼0.2 VAF, and C2 tumors exhibit a more gradual accumulation of mutations throughout their evolution.
(C) Kaplan-Meier plot of overall survival for tumors with mutational signatures consistent with clusters 1, 2, or 3. Cluster 3, n = 27. Cluster 2, n = 168. Cluster 1, n = 22. p < 0.0001.
In the first model, one sees a slow and steady accumulation of mutations. In these cancers, which include clusters associated with smoking, UV light, or MMR, hypermutation is reached over an extended period. The second model of mutation accumulation was found only in POLE-driven cancers (C3). Cluster 3 tumors featured a mid-burst of mutations, presumably after the polymerase mutation was acquired, followed by a stable rise in mutation burden genome-wide (Figures 4A and 4B). Of note, in the third model of evolution, one sees a late and explosive burst of mutations. This unique pattern is a result of either secondary polymerase mutations on the background of an early mutation burst due to germline MMR-deficiency (C1) or treatment-induced replication repair deficiency (C5).
The replication repair-associated clusters (C1, C2, and C3), whose modes of evolution were different from one another (Figure 4B), were also associated with dramatic differences in patient survival (Figure 4C). Of note, these included multiple tumor types, suggesting that the survival differences are independent of the cancer's histotype and are instead determined by its mutagen exposure.
Mutational Signatures Mark the History of Cancer Development
These data suggested that the signatures of hypermutation vary depending on the order of mutagen exposure. For example, the trinucleotide pattern of C1 resembles those of gliomas in CMMRD (Shlien et al., 2015) and would suggest that these patients do in fact also harbor germline MMR mutations. If true, the overall trinucleotide composition of C1 represents an early constitutional MMR defect, followed by acquired secondary POLE, whereas tumors in C3 have acquired POLE followed by MMR. To test this directly, we sequenced a cohort for which the temporal order of mutation was known (Figure 5) from the international bMMRD consortium (Table S5). This included (1) cancers with germline MMR mutations plus either POLE, POLD1 mutations, or neither, as secondary event; (2) cancers arising in carriers of germline POLE mutations; and (3) gliomas whose hypermutation was due to temozolomide treatment. We matched the nucleotide context of variants found in these childhood cancers, whose mutation order are known, to the clusters (Figure 3), which were derived from an unannotated cohort of mostly adult cancers. We did this using the average 96-trinucle-otide mutational profile of each group.
Figure 5. Mutational Context in Hypermutant Tumors Determined by Timing and Etiology of Mutation.

(A) Left: Average proportion of mutations by trinucleotide context in exomes with known germline status/treatment history. Right: Same, but from panel sequencing. Germline status and treatment history unknown. N indicates the number of tumor samples.
(B) Example mutational signatures in exomes from tumors with known germline status/treatment history.
(C–F) Examples of subclonal mutational signatures determined from allelic read depth on panel sequencing data. (C) Subclonal mutational signatures in an adult colorectal carcinoma with somatic POLE mutation. (D) Subclonal mutational signatures in a pediatric glioblastoma. (E) Mutational signatures present in subclonal clusters of mutations in a lung adenocarcinoma. (F) Mutational signatures present in 3 subclonal clusters of mutations in skin melanoma.
See also Table S5.
Indeed, germline MMRD with secondary polymerase mutations matched cluster C1 whereas the cancers from patients with germline MMRD, such as Lynch syndrome or CMMRD without secondary polymerase deficiency matched cluster C2 (Figures 5A and B). C3 matched tumors from patients with germline POLE mutations.
The difference between C2 and C3 suggests that MMR deficiency emerges early in the former and late in the latter. This provides an explanation for the unexpected microsatellite stable phenotype observed in the POLE ultra-hypermutant, mismatch-repair-deficient tumors seen here (Figures 1D and 3B), and in other reports (Muzny et al., 2012; Kandoth et al., 2013). In microsatellite stable tumors (C3), ultra-hypermutation is driven by an early polymerase proofreading defect, whereas mismatch repair, leading to microsatellite instability, appears later.
Next, we wanted to determine how the context of mutations changes over the course of each tumor's evolution. Using the established signature labels (Alexandrov et al., 2013), we ascribed potential causes to several signatures whose etiology is not well established. In cases with MMR and secondary POLD1, we observed an enrichment of signature 20. This was especially true for POLD1 L606M, a hotspot mutation in motif A of the polymerase domain. The mutation signature of POLD1 has not been previously described. Furthermore, signatures 14 and 15 were observed in all CMMRD (early) ultra-hypermutant cancers, with much higher contribution than all other signatures.
We confirmed that “signature 10” is associated with POLE exonuclease mutation. As expected, signature 10 was high in those tumors in which POLE mutated early, from cluster C3 (e.g., germline POLE), and low in the late POLE tumors, seen in C1.
It was clear that many hypermutant tumors present with a mix of signatures due to differing mutational histories. To separate out early and late signatures, we performed subclonal analysis (STAR Methods). First, signature 10, which is associated with POLE mutations, was high in those tumors in which POLE mutated early, cluster C3 (e.g., germline POLE, Figure 5B, second line, and Figure 5C) and low in the late POLE tumors, cluster C1 (Figure 5B, first line, and Figure 5D). Similarly, high-depth sequencing enabled us to detect subclones in multiple other cancers. For example, we observed late-arising polymerase deficiency in a lung cancer, on the background of smoking-associated mutations (Figure 5E), and the late emergence of the treatment-associated alkylating agent signature in a skin cancer that is otherwise dominated by the UV light signature (Figure 5F).
Tumor Mutational Signatures Impact the Management of Inherited Replication Repair Deficiency Patients
Finally, we tested whether somatic mutation burden combined with signatures—determined by tumor-only panel sequencing—could reveal a germline cancer predisposition syndrome. We performed signature analysis on all ultra-hypermutant pediatric cancers, incorporating clinical genetic information where available. As expected, all pediatric ultra-hypermutant cancers harbored mutations in MMR and/or DNA polymerases. Strikingly, a strong replication repair signature was observed in all tumors from patients with confirmed genetic diagnosis of germline MMR or POLE mutations (Figure S5A). The only pediatric glioma without this signature had the alkylator signature (suggesting that the hypermutation was treatment induced, as seen in adults). Three tumors exhibited a small but significant alkylator signature. These were later found to be recurrent gliomas from CMMRD children whose treatment included temozolomide. In all cases, the initial biopsy did not reveal the alkylator signature, which confirms the ability of mutational signatures to determine the natural history of cancer. These observations were also observed in hypermutant tumors with a lower burden (Figure S5B).
Having verified the clinical utility of tumor-only sequencing—combined with mutation burden and this novel classification sys-tem—we contacted physicians whose patients' tumors were ultra-hypermutant (by the panel, Figure 6A). Our clinical workflow used the tumor's mutational burden (Figure 1), the correct classification of drivers (Figure 2), together with the identification of early signatures that could be traced to the germline (Figure 4). Using this combined signal, we determined which patients were at risk for a germline replication repair deficiency. Of 15 individuals for whom our analysis suggested an early replication repair defect, all were found to harbor germline mutation in one of the corresponding genes (100%) (Figure 6B). Importantly, these patients and family members were put on a surveillance protocol for early tumor detection (Tabori et al., 2017), and for 9 in 15 patients, treatment was changed to immune checkpoint inhibitors, which we have previously shown can result in a clinically significant response (Bouffet et al., 2016).
Figure 6. Confirmation of Cancer Predisposition Syndrome and Clinical Interventions following Tumor-Only Panel Sequencing.
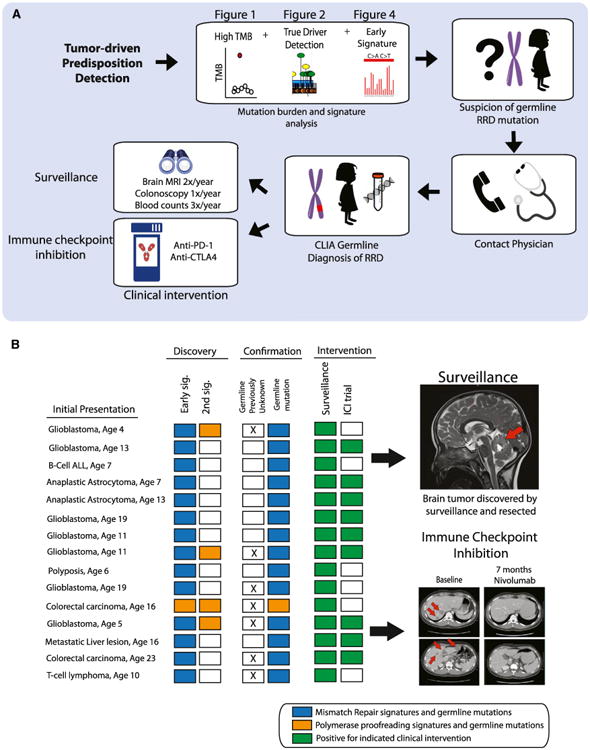
(A) Procedure for diagnosing cancer predisposition syndrome via tumor-only panel sequencing. Sequencing results with high-tumor-mutation burden, a driver mutation in a replication repair gene, and signatures of replication repair deficiency are specific for CMMRD. Clinical interventions include surveillance and immune checkpoint inhibition therapy for active tumors.
(B) Left: 15 patients for which only panel sequencing was performed prior to confirmation of predisposition syndrome diagnosis. Blue squares, signatures of MMR and the subsequent identification of a germline mutation in an MMR gene. Orange, same for POLE. Right: Example of a brain tumor found via surveillance. Bottom right: Colorectal cancer responding to anti-PD1 therapy after confirmation of germline MMR mutation.
See also Figure S5.
Discussion
Through these analyses a comprehensive landscape of hypermutation across cancer emerged, revealing novel drivers and subgroups whose etiology and timing will be of immediate clinical relevance to patients and their families. By following the mutational imprints left in the cancer genome, one can uncover early (germline) and late (treatment-related) drivers and processes.
We found hypermutation in ∼1 in 20 childhood and 1 in 6 adult cancers. Of these, we found enrichment for replication repair deficiency and continuous long-term exposure to genotoxic agents, which can pinpoint tumors for immune checkpoint inhibition. However, for recurrent tumors, the treatment itself may be the primary cause of hypermutation. Exposure to chemotherapies such as alkylators or thiopurines can lead to replication repair (Nguyen et al., 2014; Swann et al., 1996). These recurrent hypermutant cancers will be resistant to chemotherapy and other agents, due to an accelerated evolution rate and subsequently an increased ability to inactivate genes that are required for cytotoxicity (Swann et al., 1996). Therefore, defining mutational load, thresholds, and signatures could be used to avoid unnecessary treatment, and the use of targeted or immune-based treatments (Topalian et al., 2016).
Given the new-found prevalence of replication repair deficiency related hypermutation across tumor types, correctly identifying drivers has become extremely important. Our method for separating the drivers from the many passengers—the in vivo human mutagenesis screen—is a robust way of measuring functional consequence of putative mutators (more so than conservation analysis or impact predictors). This more than doubled the number of POLE and POLD1 driver mutations. Just as importantly, it identified residues for which only certain amino acid changes were pathogenic. In addition, other sites were always spared from mutation, likely due to their importance to the cell. Mutations in POLE and POLD1 have only recently been described (Esteban-Jurado et al., 2017; Shinbrot et al., 2014), thus our method will be useful for the proper clinical classification. Further research and clinical follow-up are required to fully understand why some mutations in the exonuclease domain have weak mutagenic effects, yet occasionally mutations in the polymerase domain can be associated with hypermutation and putative loss of proofreading ability. Importantly, a similar approach may lead to novel insights and clinical applications in other DNA repair genes, especially for those with a unique signature (Scarpa et al., 2017).
Considering the size of the genome, many of the somatic mutations in hypermutant cancers will likely have no functional consequence. Despite the high amount of noise, the “information content” and ability to infer tumor evolution from the passengers in a hypermutant tumor may be superior to that of a non-hypermutated cancer. As seen here, these passengers (i.e., the “noise”), considered together, bear the imprint of specific signatures that can differentiate clinically relevant subgroups (Figure 3).
These signatures also helped to untangle remaining questions about the biological processes at work in hypermutant cancers. For example, why are POLE replication repair ultra-hypermutant cancers microsatellite stable? These data suggest that such tumors (i.e., C1 and C3) maintain microsatellite stability because their mismatch repair proficiency is lost late (C3), or it is lost when there is insufficient time to accumulate high numbers of insertions or deletions, which are a feature of mismatch-repair-driven cancers of adulthood (C2). Moreover, the signatures uncovered new tumor types whose primary mutagen was UV light. These cancers, such as squamous cell carcinomas of the lung may have originated from metastastic skin cancers, or from other epithelioid stem cells that harbor the signature. Importantly, different mechanisms of carcinogenesis may produce similar patterns.
We can now study the differing routes tumors took to reach hypermutation. These have clear survival implications and can help to tailor therapy, both with respect to which drugs to take but also which to avoid. Patients whose cancers display an early burst of hypermutation, such as those that are POLE-driven, have improved survival. Perhaps this is because their tumors reached a threshold of mutational burden early and are then less efficient and more responsive to therapy (Figure 4). In contrast, late-arising signatures of hypermutation often mark aggressive cancers or late-acquired resistance to chemotherapies (Figure 4). We appreciate that in rare cases where the relative abundance of signatures are equal, there may be ambiguity in determination of chronological order.
Finally, in replication repair deficiency, one can use these signatures to trace the drivers to the germline. The cancer genome becomes a powerful new diagnostic aid for underlying germline susceptibility. For instance, if a young patient is found to have a hypermutant tumor with a signature similar to C1 (Figure 3), their family should be offered genetic counseling and testing for CMMRD, an underdiagnosed syndrome without clear warning signs (Amayiri et al., 2016; Durno et al., 2015). This is important to ensure surveillance and treatment options are appropriately customized.
In summary, the analysis of tumor samples from 81,337 children and adults revealed novel subgroups. These form a new taxonomic tree of hypermutant cancers defined by the type and order of their exposure to mutagens. Within the branches of this tree, tumors are organized by their shared evolutionary history, which are marked by select true driver mutations and new signatures. In some patients, these can be traced back to the germline. Knowledge of a hypermutant tumor's past yields information that can be acted on in the present day, as an aid in diagnosis, a predictor of prognosis, or as an instrument for determining rational therapeutic approaches.
Detailed methods are provided in the online version of this paper and include the following:
Contact for Reagent and Resource Sharing
Further information and requests for resources and reagents should be directed to and will be fulfilled by the Lead Contact, Adam Shlien (adam.shlien@sickkids.ca).
Experimental Model and Subject Details
Patient and sample collection for FoundationOne Panel Sequencing
Tumor samples for FoundationOne Panel Sequencing were collected as previously described (Frampton et al., 2013). The sex ratios for each tumor-type was similar to previous reports, with an overall female:male ratio of 55:45 among all FoundationOne patients whose tumor samples are described in this study.
Patient and sample collection for whole genome sequencing, exome sequencing and KiCS panel sequencing
A cohort of germline replication-repair deficient patients with known clinical history was collected as described previously (Shlien et al., 2015). In brief, patients were registered as a part of the International Biallelic Mismatch Repair Consortium, which includes multiple centers worldwide. For further information on The International Replication Repair Deficiency Consortium, see http://www.sickkids.ca/MMRD/index.html. Following Institutional Research Ethics Board approval, all data were centralized in the Division of Haematology/Oncology at The Hospital for Sick Children (SickKids). Consent forms were obtained from the parents or guardians, or from the patients, where applicable. Family history, demographic and clinical data were obtained from the responsible physician and/or genetic counselor at the corresponding centers. Tumor and blood samples were collected from the SickKids tumor bank. Detailed information on the SickKids Cancer Sequencing Program, KiCS, is available at https://www.kicsprogram.com. The diagnosis of a replication repair deficiency-related cancer predisposition syndrome was made when a germline biallelic mutation in any of the four MMR genes (MLH1, MSH2, MSH6, PMS2) or a driver mutation in POLE, was confirmed by sequencing in a clinically approved laboratory. The sequencing of temozolomide-treated tumors was previously described (van Thuijl et al., 2015).
Method Details
FoundationOne panel sequencing
FoundationOne Panel sequencing was performed for 81,337 tumors as previously described (Frampton et al., 2013). In brief, exonic hybridization capture of 315 cancer-related genes was applied to a minimum of 50 ng of DNA extracted from formalin-fixed paraffin-embedded clinical cancer specimens. Pathologic diagnosis of each case was confirmed by review of hematoxylin and eosin (H&E) stained slides and samples were excluded if found to contain < 20% tumor cells. Libraries were sequenced to high uniform median coverage (> 500×) and assessed for base substitutions, copy number alterations, and gene fusions/rearrangements. For the purposes of the findings described in this study pediatric was defined as < 25 years of age.
Exome sequencing
High-throughput sequencing, read mapping and identification of mutations was performed at the Center for Applied Genomics at the Hospital for Sick Children, as previously described (Shlien et al., 2015). Briefly, tumor and matched blood derived DNA were run using Agilent's exome enrichment kit (Sure Select V4/V5; with > 50% of baits above 25× coverage), on an Illumina HiSeq2500. Base calls and intensities from the Illumina HiSeq 2500 were processed into FASTQ files using CASAVA and/or HAS. The paired-end FASTQ files were aligned to UCSC's hg19 GRCh37 with BWA. Aligned reads were realigned for known insertion/deletion events using SRMA and/or GATK. Base quality scores were recalibrated using the Genome Analysis Toolkit26 (v1.1-28). Somatic substitutions were identified using MuTect (v1.1.4). Mutations were then filtered against common single-nucleotide polymorphisms (SNPs) found in dbSNP (v132), the 1000 Genomes Project (Feb 2012), a 69-sample Complete Genomics dataset, and the Exome Sequencing Project (v6500) and the ExAc database.
Whole genome sequencing
Whole genome sequencing was performed at The Centre for Applied Genomics on an Illumina HiSeq 2500 or Illumina HiseqX at mean coverage > = 30. Read alignment and variant calling/filtering were performed as described above for exome sequencing.
KiCS panel sequencing
The SickKids Cancer Sequencing (KiCS) gene panel utilizes the Agilent Sure Select capture kit technology, targeting 15,000 exons across 880 genes. Enriched libraries were prepared from both tumor DNA and matched normal (blood or skin) and sequenced on Illumina HiSeq2500 sequencers running in rapid mode producing paired end 100 base reads. Reads were aligned with BWA-MEM according to GATK best practices with coverage metrics meeting greater than 700× mean coverage, with > = 98.5% of bases above 50×, > = 95% of bases above 200× coverage, and > = 75% of bases above 500× coverage. Substitution mutations were called using MuTect, with variants called above 50× coverage in tumor and normal. We achieved > 95% sensitivity and specificity for variants above 5% allele frequency.
Clinical genetic information collection for ultra-hypermutant pediatric cancers
Patients with FoundationOne panel results and who were concurrently enrolled in the International Biallelic Mismatch Repair Deficiency Consortium underwent germline sequencing services in accordance with the Clinical Laboratory Improvement Amendments (CLIA) program standards, following a rigorous consent process and genetic counselling consultation. Clinical diagnoses of a replication repair deficiency associated syndrome were made based on the presence of inherited predicted pathogenic mutations in MMR and polymerase genes. Physicians involved in patient care were notified of the diagnosis.
POLE exonuclease excision rate assay
Excision rate constants were measured as described (Zahurancik et al., 2014). Briefly, a pre-incubated solution of Pol e (100 nM) and 5′-32P-labeled DNA substrate (20 nM) was rapidly mixed with Mg2+ (8 mM) in reaction buffer at 37°C. After various incubation times, the reaction was quenched with the addition of EDTA. The excision rate constants for Polε wild-type and L424V were measured using a rapid chemical quench-flow apparatus. Product concentration was plotted versus time and fit to a single-exponential equation, [product] = Aexp(-kexot), to yield the excision rate constant, kexo.
Quantification and Statistical Analysis
Determination of hypermutation threshold
To determine a threshold of hypermutation in human cancer, a segmented linear regression analysis or “broken-stick analysis” was performed on the mutation burdens from the pediatric (n = 2,885) and adult (n = 78,452) FoundationOne panel cohorts. Briefly, using the R package Segmented, an iterative process was used to determine segment breakpoints at which a statistically significant change in the slope of adjacent regression lines occurred (Muggeo, 2003). For the pediatric cohort, the first such breakpoint at which a statistically significant change occurred, accompanied by a visually observed uptick in the slope of the regression line, was at 9.91 mut/Mb. For the adult cohort, a corresponding change occurred at 9 mut/Mb. This threshold was rounded up to 10 mut/Mb to account for statistical uncertainty and for the purposes of simplicity.
Microsatellite instability analysis
To determine MSI status, 114 intronic homopolymer repeat loci with adequate coverage on the FoundationOne panel are analyzed for length variability and compiled into an overall MSI score via principal components analysis (PCA). Among the 1,897 microsatellites, the 114 that maximized variability between samples were chosen. Each chosen locus was intronic and had hg19 reference repeat length of 10-20bp. This range of repeat lengths was selected such that the microsatellites are long enough to produce a high rate of DNA polymerase slippage, while short enough such that they are well within the 49bp read length of NGS to facilitate alignment to the human reference genome. A detailed description can be found at Chalmers et al., (2017).
Detection of POLE and POLD1 driver mutations
To identify polymerase mutations associated with hypermutation we built a model based on the following criteria: 1) Tumors harboring the variant must be hypermutant at a conservative cut-off of 50 mutations/mb. This number was selected since most POLE mutant tumors typically exceed 100 mut/mb (Shinbrot et al., 2014); 2) Variants found in hypermutant tumors must not co-occur with an existing known driver mutations in the same tumor; 3) Variants that were found both in hypermutant and lowly mutated tumors (< 10 mut/mb) were excluded. The burden of these samples is shown in Figure S1E; and 4) Variants must occur in a minimum of 2 hypermutant tumors. Variant allele fraction and tumor purity were also considered, as previously described (Frampton et al., 2013).
Unsupervised clustering and signature analysis
A cohort of hypermutant samples was selected for hierarchal clustering and signature analysis by the following criteria.
Exclusion for all:
< 50 exonic mutations detected in the FoundationOne panel.
Inclusion for adults (> 25 years):
Any colon or uterine with MSI-H
Top 100 most-mutated lung cancers
Top 100 most-mutated skin cancers
For all other tumors, > 50 Mut/Mb and/or > 2 standard deviations above mean for that tumor type (provided there were > 50 tumors of that type)
Inclusion for children:
Any tumor with > 50 exonic mutations.
This yielded a total of 1,521 tumors (1,491 adult and 30 pediatric) for clustering analysis.
The proportion of mutations corresponding to each of 96 trinucleotide contexts was determined for each of the 1,521 samples selected above using the pyrimidine-converted single base substitution and the corresponding tri-nucleotide sequence context (i.e., reference base at mutation position and its 5′ and 3′ neighbors). Unsupervised hierarchical clustering of the hypermutant cohort by trinucleotide context was performed using the diana clustering method.
The R package DeConstructSigs was used to determine the proportion of COSMIC signatures as defined by Alexandrov et al. (2013) (http://cancer.sanger.ac.uk/cancergenome/assets/signatures_probabilities.txt) (Rosenthal et al., 2016).
Validation of Signature 7 in sarcomas using the TCGA database
Somatic substitution calls (MuTect2) were obtained from 103 TCGA adult sarcoma exome samples, with a minimum of 50 substitutions. These samples were analyzed using deconstructSigs as described above. Five tumors were found to be hypermutant (> 10 Mut/Mb) and have significant contributions from Signature 7 (> 0.5). Examination of the pathology reports of these tumors revealed all 5 to be located superficially (subcutaneous and/or extending into the dermis).
Subclonal analysis
Tumor subclones (early and late) were determined using the R package SciClone (Miller et al., 2014) Variant allele fraction and percentage of alternate reads were used to determine the order of mutational events. Mutations with variant allele fraction greater than 0.45 were excluded from analysis to filter out germline mutations and somatic mutations in regions of copy number gain. For the determination of early and late mutations, clusters were limited to 6. Subclonal mutational signatures were then determined using deconstructSigs as described above (Rosenthal et al., 2016).
Data and Software Availability
Whole genome and/or whole exome sequencing data for tumors from patients with germline replication repair deficiency have been deposited in the European Genome Phenome Archive under study accession number EGAS00001001112.
Supplementary Material
Figure S1. Determination of Hypermutation by Panel Sequencing, Related to Figure 1
(A) Linear correlation between tumor mutation burden derived from whole exome sequencing (WES) and tumor mutation burden derived from 1.1-3.25 Mb of targeted panel sequencing (R-squared = 0.94). (B) Tumor mutation burden on a test dataset of 14 tumors that underwent targeted panel sequencing, whole exome sequencing, and whole genome sequencing.
(C and D) Determination of a hypermutation threshold in human cancer through segmented linear regression analysis. Dotted lines indicate segment boundaries determined by segmented linear regression analysis using an iterative method. Red lines indicate linear regression lines of individual segments. The boundary points at which there was observed to be a significantly large gain in the slope of the regression line (shown in blue), were selected as the thresholds of hypermutation (9.91 and 9 for pediatric and adult cohort respectively), which were rounded to 10 for the remainder of the analyses described in this study. (C) Pediatric cohort of 2,885 tumors ranked by mutation burden (mut/Mb). (D) Adult cohort of 78,452 tumors ranked by mutations burden (mut/Mb).
(E) Mutation status of MMR and POL mutations in pediatric tumors with mutation burden < 10. Unselected mutations in replication repair genes are randomly distributed and do not cluster around the hypermutation threshold further supporting that these specific alterations are passengers and not driving hypermutation.
Figure S2. Association of MSI-H and Replication Repair Mutations with Mutation Burden, Related to Figure 1
(A) 81 unique tumor histologies with at least 1 MSI-H tumor.
(B) Percent MSI-H tumors versus mutation burden. Barplot shows the percentage of MSI-H tumors out of all tumors at the respective mutation burden bin. MSI-H tumors concentrated in the 10-100 mutation burden range.
(C) Pediatric cancers with a combined mismatch repair deficiency and polymerase driver mutation display an ultrahypermutant phenotype. Cohort of 2885 pediatric tumors harboring either MMR and polymerase mutations concurrently, only mismatch repair mutations, only polymerase mutations, or neither. The presence of a mismatch repair mutation is significantly associated with hypermutation, while a polymerase mutation alone is not.
Figure S3. Determining True Hypermutation Driver Mutations in POLE, Related to Figure 2
(A) Variant allele fraction (VAF) of POLE R446Q mutation. Boxplot shows the VAF of POLE R446Q mutation in 64 tumors. The majority of mutations clustered at 0.5, signifying that it is a germline SNP and not a hypermutation driver.
(B) L424I and L424V POLE mutations vary in their degree of reduced exonuclease function. Excision rate constants of 3′-5′ exonuclease activity catalyzed by Polε and the indicated mutants at 37°C.
Figure S4. Signature Analysis of Hypermutant Lung Cancer and TCGA Sarcoma Reveals Predominance of Signature 7 (UV Light) in Hypermutant Lung Squamous Cell Carcinoma and Sarcoma, Related to Figure 3
(A) Proportion of Signature 7 versus Signature 4 (Smoking) in 100 hypermutant lung cancer samples run on cancer panel. Circle sizes indicate tumor mutation burden in mutations/Mb, and colors represent lung cancer subtype.
(B) Proportion of Signature 4 in lung cancers by subtype.
(C) Proportion of Signature 7 in lung cancers by subtype.
(D) Number of somatic SNVs in 103 TCGA sarcoma exomes (minimum 50 somatic SNVs). Magenta indicates proportion of mutations explained by Signature 7 (UV light). Grey indicates proportion of mutations explained by all other signatures.
Figure S5. High Mutation Burden and Specific Signatures Reveal Predisposition and Treatment History in Pediatric Cancers, Related to Figure 6
(A) Signature analysis for all ultrahypermutant (> 100 mut/Mb) pediatric tumors. All signatures associated with replication repair deficiency were combined (black). Signatures associated with alkylating agents are shown in turquoise. 19 patients with ultrahypermutant tumors were confirmed for germline cancer predisposition involving replication repair genes. Numbers above each bar represent the mutation burden for that tumor.
(B) Signature analysis for hypermutant pediatric tumors (10-100 mut/Mb) – hypermutant pediatric tumors of the three tumor types typically associated with CMMRD (brain, GI, leukemia/lymphoma) were enriched for RRD signatures. Two brain tumor patients were retrospectively confirmed as CMMRD (50 mut/Mb) and Lynch (34 mut/Mb) respectively.
Key Resources Table.
| REAGENT or RESOURCE | SOURCE | IDENTIFIER |
|---|---|---|
| Chemicals, Peptides, and Recombinant Proteins | ||
| Catalytic PolE-N140 mutant (L424V) | This Paper | N/A |
| Catalytic PolE-N140 mutant (L424I) | This Paper | N/A |
| Deposited Data | ||
| TCGA database | NCI Genomics Data Commons | https://portal.gdc.cancer.gov/ |
| ExAC database | Broad Institute | http://exac.broadinstitute.org/ |
| dbSNP database (v132) | NCBI | https://www.ncbi.nlm.nih.gov/projects/SNP/ |
| 1000 Genomes database | The International Genome Sample Resource | http://www.internationalgenome.org/data |
| Whole genome/exome sequencing data | https://www.ebi.ac.uk/ega/ | EGAS00001000579; EGAS00001001112 |
| Oligonucleotides | ||
| Pre-steady state kinetic excision assay primer: 5′-CGCAGCCGTCCAACCAACTCA-3′ | This Paper | N/A |
| Pre-steady state kinetic excision assays template: 3′-GCGTCGGCAGGTTGGTTGAGTAGCAGCTAG GTTACGGCAGG-5′ | This Paper | N/A |
| Software and Algorithms | ||
| R 3.3.3 | The R Foundation | https://www.r-project.org/ |
| deconstructSigs | Rosenthal et al., 2016 | https://github.com/raerose01/deconstructSigs |
| ggplot2 | The R Foundation | https://cran.r-project.org/web/packages/ggplot2/index.html |
| BWA | Li, 2013 | https://github.com/lh3/bwa |
| Genome Analysis Toolkit26 (v1.1-28). | Broad Institute | https://github.com/broadinstitute/gatk |
| MuTect | Broad Institute | https://github.com/broadinstitute/mutect |
| SciClone | The McDonnell Genome Institute | https://github.com/genome/sciclone |
| Reshape2 | The R Foundation | https://cran.r-project.org/web/packages/reshape2/index.html |
| Plyr | The R Foundation | https://cran.r-project.org/web/packages/plyr/index.html |
Highlights.
Mutation burden analysis reveals new drivers of hypermutation in POLE and POLD1
Timing of replication repair deficiency determines mutation signature composition
Germline replication repair deficiency identified from tumor-only sequencing
Mutation burden and signatures have value for screening, surveillance, and therapy
Acknowledgments
The SickKids Cancer Sequencing (KiCS) program is supported by the Garron Family Cancer Centre with funds from the SickKids Foundation. This research is supported by LivWise, Meagan's Walk (MW-2014-10), the CIHR Joint Canada-Israel Health Research Program (MOP – 137899), a Stand Up to Cancer (SU2C) – Bristol-Myers Squibb Catalyst Research (SU2C-AACR-CT-07-17), and a SU2C – St. Baldrick's Pediatric Dream Team Translational Research Grant (SU2C-AACR-DT1113). SU2C is a program of the Entertainment Industry Foundation administered by the AACR. B.B.C. is supported by the Government of Ontario, the Frank Fletcher Memorial Fund, and SickKids Research Training Competition. N.L. is supported by the University of Toronto MD/PhD program, the McLaughlin Centre, and a CIHR MD/PhD Studentship. D.F. and J.A.E. are employees and stockholders of Foundation Medicine. G.M. is an employee of Janssen Pharmaceutical Companies of Johnson & Johnson.
Footnotes
Supplemental Information: Supplemental Information includes five figures and five tables and can be found with this article online at https://doi.org/10.1016/j.cell.2017.09.048.
Author Contributions: Conceptualization: B.B.C., N.L., U.T., and A.S.; Methodology: B.B.C., N.L., D.F., J.A.E., F.F., M.Z., R.d.B., S.D., K.P.H., Z.F.P., W.J.Z., Z.S., U.T., and A.S.; Resources and Data Curation: B.B.C., D.F., J.A.E., M.E., T.L., K.W., C.P.K., D.C.B., T.W.L., G.P.D., T.M.J., M.R.G., I.V.S., V.L., D. Samuel, A.B., M.Y., D. Stearns, P.R., K.A.C., P.B.S., M.O., E.O., G.M., G.A.T., M.S., B.G., D.S.Z., S.L., V.M.I., S.C., H.T., R.E., R.F., R.D., P.D., A.H., M.A.G., J.C., V.R., M.S.I., M.A., C.D., M.D.T., G.R., J.M.M., E.B., C.H., J.F.C., M.S.M., and Z.F.P.; Writing – Original Draft: B.B.C., N.L., D.M., U.T., and A.S.; Writing – Review and Editing: B.B.C., N.L., J.M.M., M.S.M., D.M., U.T., and A.S.; Visualization: B.B.C. and N.L. Supervision: J.M.M., M.S.M., D.M., U.T., and A.S.; Funding Acquisition: U.T. and A.S.
References
- Akbani R, Akdemir KC, Aksoy BA, Albert M, Ally A, Amin SB, Arachchi H, Arora A, Auman JT, Ayala B, et al. Cancer Genome Atlas Network. Genomic classification classification of cutaneous melanoma. Cell. 2015;161:1681–1696. doi: 10.1016/j.cell.2015.05.044. [DOI] [PMC free article] [PubMed] [Google Scholar]
- Albertson TM, Ogawa M, Bugni JM, Hays LE, Chen Y, Wang Y, Treuting PM, Heddle JA, Goldsby RE, Preston BD. DNA polymerase epsilon and delta proofreading suppress discrete mutator and cancer phenotypes in mice. Proc Natl Acad Sci USA. 2009;106:17101–17104. doi: 10.1073/pnas.0907147106. [DOI] [PMC free article] [PubMed] [Google Scholar]
- Alexandrov LB, Nik-Zainal S, Wedge DC, Aparicio SA, Behjati S, Biankin AV, Bignell GR, Bolli N, Borg A, Børresen-Dale AL, et al. Australian Pancreatic Cancer Genome Initiative; ICGC Breast Cancer Consortium; ICGC MMML-Seq Consortium; ICGC PedBrain. Signatures of mutational processes in human cancer. Nature. 2013;500:415–421. doi: 10.1038/nature12477. [DOI] [PMC free article] [PubMed] [Google Scholar]
- Amayiri N, Tabori U, Campbell B, Bakry D, Aronson M, Durno C, Rakopoulos P, Malkin D, Qaddoumi I, Musharbash A, et al. BMMRD Consortium. High frequency of mismatch repair deficiency among pediatric high grade gliomas in Jordan. Int J Cancer. 2016;138:380–385. doi: 10.1002/ijc.29724. [DOI] [PubMed] [Google Scholar]
- Bouffet E, Larouche V, Campbell BB, Merico D, de Borja R, Aronson M, Durno C, Krueger J, Cabric V, Ramaswamy V, et al. Immune checkpoint inhibition for hypermutant glioblastoma multiforme resulting from germline biallelic mismatch repair deficiency. J Clin Oncol. 2016;34:2206–2211. doi: 10.1200/JCO.2016.66.6552. [DOI] [PubMed] [Google Scholar]
- Campbell JD, Alexandrov A, Kim J, Wala J, Berger AH, Pedamallu CS, Shukla SA, Guo G, Brooks AN, Murray BA, et al. Cancer Genome Atlas Research Network. Distinct patterns of somatic genome alterations in lung adenocarcinomas and squamous cell carcinomas. Nat Genet. 2016;48:607–616. doi: 10.1038/ng.3564. [DOI] [PMC free article] [PubMed] [Google Scholar]
- Chalmers ZR, Connelly CF, Fabrizio D, Gay L, Ali SM, Ennis R, Schrock A, Campbell B, Shlien A, Chmielecki J, et al. Analysis of 100,000 human cancer genomes reveals the landscape of tumor mutational burden. Genome Med. 2017;9:34. doi: 10.1186/s13073-017-0424-2. [DOI] [PMC free article] [PubMed] [Google Scholar]
- Daee DL, Mertz TM, Shcherbakova PV. A cancer-associated DNA polymerase delta variant modeled in yeast causes a catastrophic increase in genomic instability. Proc Natl Acad Sci USA. 2010;107:157–162. doi: 10.1073/pnas.0907526106. [DOI] [PMC free article] [PubMed] [Google Scholar]
- Diaz LA, Jr, Le DT. PD-1 blockade in tumors with mismatch-repair deficiency. N Engl J Med. 2015;373:1979. doi: 10.1056/NEJMc1510353. [DOI] [PubMed] [Google Scholar]
- Dossett LA, Harrington M, Cruse CW, Gonzalez RJ. Cutaneous angiosarcoma. Curr Probl Cancer. 2015;39:258–263. doi: 10.1016/j.currproblcancer.2015.07.007. [DOI] [PubMed] [Google Scholar]
- Durno CA, Sherman PM, Aronson M, Malkin D, Hawkins C, Bakry D, Bouffet E, Gallinger S, Pollett A, Campbell B, Tabori U International BMMRD Consortium. Phenotypic and genotypic characterisation of biallelic mismatch repair deficiency (BMMR-D) syndrome. Eur J Cancer. 2015;51:977–983. doi: 10.1016/j.ejca.2015.02.008. [DOI] [PubMed] [Google Scholar]
- Esteban-Jurado C, Giménez-Zaragoza D, Muñoz J, Franch-Expósito S, Álvarez-Barona M, Ocaña T, Cuatrecasas M, Carballal S, López-Cerón M, Marti-Solano M, et al. POLE and POLD1 screening in 155 patients with multiple polyps and early-onset colorectal cancer. Oncotarget. 2017;8:26732–26743. doi: 10.18632/oncotarget.15810. [DOI] [PMC free article] [PubMed] [Google Scholar]
- Frampton GM, Fichtenholtz A, Otto GA, Wang K, Downing SR, He J, Schnall-Levin M, White J, Sanford EM, An P, et al. Development and validation of a clinical cancer genomic profiling test based on massively parallel DNA sequencing. Nat Biotechnol. 2013;31:1023–1031. doi: 10.1038/nbt.2696. [DOI] [PMC free article] [PubMed] [Google Scholar]
- Govindan R, Ding L, Griffith M, Subramanian J, Dees ND, Kanchi KL, Maher CA, Fulton R, Fulton L, Wallis J, et al. Genomic landscape of non-small cell lung cancer in smokers and never-smokers. Cell. 2012;150:1121–1134. doi: 10.1016/j.cell.2012.08.024. [DOI] [PMC free article] [PubMed] [Google Scholar]
- Herr AJ, Ogawa M, Lawrence NA, Williams LN, Eggington JM, Singh M, Smith RA, Preston BD. Mutator suppression and escape from replication error-induced extinction in yeast. PLoS Genet. 2011;7:e1002282. doi: 10.1371/journal.pgen.1002282. [DOI] [PMC free article] [PubMed] [Google Scholar]
- Johanns TM, Miller CA, Dorward IG, Tsien C, Chang E, Perry A, Uppaluri R, Ferguson C, Schmidt RE, Dahiya S, et al. Immunogenomics of hypermutated glioblastoma: a patient with germline POLE deficiency treated with checkpoint blockade immunotherapy. Cancer Discov. 2016;6:1230–1236. doi: 10.1158/2159-8290.CD-16-0575. [DOI] [PMC free article] [PubMed] [Google Scholar]
- Kandoth C, Schultz N, Cherniack AD, Akbani R, Liu Y, Shen H, Robertson AG, Pashtan I, Shen R, Benz CC, et al. Cancer Genome Atlas Research Network. Integrated genomic characterization of endometrial carcinoma. Nature. 2013;497:67–73. doi: 10.1038/nature12113. [DOI] [PMC free article] [PubMed] [Google Scholar]
- Kane DP, Shcherbakova PV. A common cancer-associated DNA polymerase ε mutation causes an exceptionally strong mutator phenotype, indicating fidelity defects distinct from loss of proofreading. Cancer Res. 2014;74:1895–1901. doi: 10.1158/0008-5472.CAN-13-2892. [DOI] [PMC free article] [PubMed] [Google Scholar]
- Le DT, Uram JN, Wang H, Bartlett BR, Kemberling H, Eyring AD, Skora AD, Luber BS, Azad NS, Laheru D, et al. PD-1 blockade in tumors with mismatch-repair deficiency. N Engl J Med. 2015;372:2509–2520. doi: 10.1056/NEJMoa1500596. [DOI] [PMC free article] [PubMed] [Google Scholar]
- Lek M, Karczewski KJ, Minikel EV, Samocha KE, Banks E, Fennell T, O'Donnell-Luria AH, Ware JS, Hill AJ, Cummings BB, et al. Exome Aggregation Consortium. Analysis of protein-coding genetic variation in 60,706 humans. Nature. 2016;536:285–291. doi: 10.1038/nature19057. [DOI] [PMC free article] [PubMed] [Google Scholar]
- Li H. Aligning sequence reads, clone sequences and assembly contigs with BWA-MEM. arXiv, arXiv:1303.3997. 2013 https://arxiv.org/abs/1303.3997.
- Miller CA, White BS, Dees ND, Griffith M, Welch JS, Griffith OL, Vij R, Tomasson MH, Graubert TA, Walter MJ, et al. SciClone: inferring clonal architecture and tracking the spatial and temporal patterns of tumor evolution. PLoS Comput Biol. 2014;10:e1003665. doi: 10.1371/journal.pcbi.1003665. [DOI] [PMC free article] [PubMed] [Google Scholar]
- Morganella S, Alexandrov LB, Glodzik D, Zou X, Davies H, Staaf J, Sieuwerts AM, Brinkman AB, Martin S, Ramakrishna M, et al. The topography of mutational processes in breast cancer genomes. Nat Commun. 2016;7:11383. doi: 10.1038/ncomms11383. [DOI] [PMC free article] [PubMed] [Google Scholar]
- Muggeo VMR. Estimating regression models with unknown breakpoints. Stat Med. 2003;22:3055–3071. doi: 10.1002/sim.1545. [DOI] [PubMed] [Google Scholar]
- Muzny DM, Bainbridge MN, Chang K, Dinh HH, Drummond JA, Fowler G, Kovar CL, Lewis LR, Morgan MB, Newsham IF, et al. Cancer Genome Atlas Network. Comprehensive molecular characterization of human colon and rectal cancer. Nature. 2012;487:330–337. doi: 10.1038/nature11252. [DOI] [PMC free article] [PubMed] [Google Scholar]
- Nguyen SA, Stechishin OD, Luchman HA, Lun XQ, Senger DL, Robbins SM, Cairncross JG, Weiss S. Novel MSH6 mutations in treatment-naïve glioblastoma and anaplastic oligodendroglioma contribute to temozolomide resistance independently of MGMT promoter methylation. Clin Cancer Res. 2014;20:4894–4903. doi: 10.1158/1078-0432.CCR-13-1856. [DOI] [PubMed] [Google Scholar]
- Nik-Zainal S, Davies H, Staaf J, Ramakrishna M, Glodzik D, Zou X, Martincorena I, Alexandrov LB, Martin S, Wedge DC, et al. Landscape of somatic mutations in 560 breast cancer whole-genome sequences. Nature. 2016;534:47–54. doi: 10.1038/nature17676. [DOI] [PMC free article] [PubMed] [Google Scholar]
- Pfeifer GP, You YH, Besaratinia A. Mutations induced by ultraviolet light. Mutat Res. 2005;571:19–31. doi: 10.1016/j.mrfmmm.2004.06.057. [DOI] [PubMed] [Google Scholar]
- Pleasance ED, Stephens PJ, O'Meara S, McBride DJ, Meynert A, Jones D, Lin ML, Beare D, Lau KW, Greenman C, et al. A small-cell lung cancer genome with complex signatures of tobacco exposure. Nature. 2010;463:184–190. doi: 10.1038/nature08629. [DOI] [PMC free article] [PubMed] [Google Scholar]
- Rizvi NA, Hellmann MD, Snyder A, Kvistborg P, Makarov V, Havel JJ, Lee W, Yuan J, Wong P, Ho TS, et al. Cancer immunology Mutational landscape determines sensitivity to PD-1 blockade in non-small cell lung cancer. Science. 2015;348:124–128. doi: 10.1126/science.aaa1348. [DOI] [PMC free article] [PubMed] [Google Scholar]
- Roberts SA, Lawrence MS, Klimczak LJ, Grimm SA, Fargo D, Stojanov P, Kiezun A, Kryukov GV, Carter SL, Saksena G, et al. An APOBEC cytidine deaminase mutagenesis pattern is widespread in human cancers. Nat Genet. 2013;45:970–976. doi: 10.1038/ng.2702. [DOI] [PMC free article] [PubMed] [Google Scholar]
- Rosenthal R, McGranahan N, Herrero J, Taylor BS, Swanton C. DeconstructSigs: delineating mutational processes in single tumors distinguishes DNA repair deficiencies and patterns of carcinoma evolution. Genome Biol. 2016;17:31. doi: 10.1186/s13059-016-0893-4. [DOI] [PMC free article] [PubMed] [Google Scholar]
- Sage E. Distribution and repair of photolesions in DNA: genetic consequences and the role of sequence context. Photochem Photobiol. 1993;57:163–174. doi: 10.1111/j.1751-1097.1993.tb02273.x. [DOI] [PubMed] [Google Scholar]
- Santin AD, Bellone S, Buza N, Choi J, Schwartz PE, Schlessinger J, Lifton RP. Regression of chemotherapy-resistant polymerase ε (POLE) ultra-mutated and MSH6 hyper-mutated endometrial tumors with nivolumab. Clin Cancer Res. 2016;22:5682–5687. doi: 10.1158/1078-0432.CCR-16-1031. [DOI] [PMC free article] [PubMed] [Google Scholar]
- Scarpa A, Chang DK, Nones K, Corbo V, Patch AM, Bailey P, Lawlor RT, Johns AL, Miller DK, Mafficini A, et al. Australian Pancreatic Cancer Genome Initiative. Whole-genome landscape of pancreatic neuroendocrine tumours. Nature. 2017;543:65–71. doi: 10.1038/nature21063. [DOI] [PubMed] [Google Scholar]
- Shinbrot E, Henninger EE, Weinhold N, Covington KR, Göksenin AY, Schultz N, Chao H, Doddapaneni H, Muzny DM, Gibbs RA, et al. Exonuclease mutations in DNA polymerase epsilon reveal replication strand specific mutation patterns and human origins of replication. Genome Res. 2014;24:1740–1750. doi: 10.1101/gr.174789.114. [DOI] [PMC free article] [PubMed] [Google Scholar]
- Shlien A, Campbell BB, de Borja R, Alexandrov LB, Merico D, Wedge D, Van Loo P, Tarpey PS, Coupland P, Behjati S, et al. Biallelic Mismatch Repair Deficiency Consortium. Combined hereditary and somatic mutations of replication error repair genes result in rapid onset of ultra-hypermutated cancers. Nat Genet. 2015;47:257–262. doi: 10.1038/ng.3202. [DOI] [PubMed] [Google Scholar]
- Snyder A, Makarov V, Merghoub T, Yuan J, Zaretsky JM, Desrichard A, Walsh LA, Postow MA, Wong P, Ho TS, et al. Genetic basis for clinical response to CTLA-4 blockade in melanoma. N Engl J Med. 2014;371:2189–2199. doi: 10.1056/NEJMoa1406498. [DOI] [PMC free article] [PubMed] [Google Scholar]
- Stratton MR, Campbell PJ, Futreal PA. The cancer genome. Nature. 2009;458:719–724. doi: 10.1038/nature07943. [DOI] [PMC free article] [PubMed] [Google Scholar]
- Swann PF, Waters TR, Moulton DC, Xu YZ, Zheng Q, Edwards M, Mace R. Role of postreplicative DNA mismatch repair in the cytotoxic action of thioguanine. Science. 1996;273:1109–1111. doi: 10.1126/science.273.5278.1109. [DOI] [PubMed] [Google Scholar]
- Tabori U, Hansford JR, Achatz MI, Kratz CP, Plon SE, Frebourg T, Brugières L. Clinical management and tumor surveillance recommendations of inherited mismatch repair deficiency in childhood. Clin Cancer Res. 2017;23:e32–e37. doi: 10.1158/1078-0432.CCR-17-0574. [DOI] [PubMed] [Google Scholar]
- Tomasetti C, Li L, Vogelstein B. Stem cell divisions, somatic mutations, cancer etiology, and cancer prevention. Science. 2017;355:1330–1334. doi: 10.1126/science.aaf9011. [DOI] [PMC free article] [PubMed] [Google Scholar]
- Topalian SL, Taube JM, Anders RA, Pardoll DM. Mechanism-driven biomarkers to guide immune checkpoint blockade in cancer therapy. Nat Rev Cancer. 2016;16:275–287. doi: 10.1038/nrc.2016.36. [DOI] [PMC free article] [PubMed] [Google Scholar]
- Van Allen EM, Miao D, Schilling B, Shukla SA, Blank C, Zimmer L, Sucker A, Hillen U, Foppen MHG, Goldinger SM, et al. Genomic correlates of response to CTLA-4 blockade in metastatic melanoma. Science. 2015;350:207–211. doi: 10.1126/science.aad0095. [DOI] [PMC free article] [PubMed] [Google Scholar]
- van Thuijl HF, Mazor T, Johnson BE, Fouse SD, Aihara K, Hong C, Malmström A, Hallbeck M, Heimans JJ, Kloezeman JJ, et al. Evolution of DNA repair defects during malignant progression of low-grade gliomas after temozolomide treatment. Acta Neuropathol. 2015;129:597–607. doi: 10.1007/s00401-015-1403-6. [DOI] [PMC free article] [PubMed] [Google Scholar]
- Weinstein JN, Akbani R, Broom BM, Wang W, Verhaak RG, McConkey D, Lerner S, Morgan M, Creighton CJ, Smith C, et al. Cancer Genome Atlas Research Network. Comprehensive molecular characterization of urothelial bladder carcinoma. Nature. 2014;507:315–322. doi: 10.1038/nature12965. [DOI] [PMC free article] [PubMed] [Google Scholar]
- Zahurancik WJ, Klein SJ, Suo Z. Significant contribution of the 3′→5′ exonuclease activity to the high fidelity of nucleotide incorporation catalyzed by human DNA polymerase E. Nucleic Acids Res. 2014;42:13853–13860. doi: 10.1093/nar/gku1184. [DOI] [PMC free article] [PubMed] [Google Scholar]
- Zhang J, Nichols KE, Downing JR. Germline mutations in predisposition genes in pediatric cancer. N Engl J Med. 2016;374:1391. doi: 10.1056/NEJMc1600338. [DOI] [PubMed] [Google Scholar]
Associated Data
This section collects any data citations, data availability statements, or supplementary materials included in this article.
Supplementary Materials
Figure S1. Determination of Hypermutation by Panel Sequencing, Related to Figure 1
(A) Linear correlation between tumor mutation burden derived from whole exome sequencing (WES) and tumor mutation burden derived from 1.1-3.25 Mb of targeted panel sequencing (R-squared = 0.94). (B) Tumor mutation burden on a test dataset of 14 tumors that underwent targeted panel sequencing, whole exome sequencing, and whole genome sequencing.
(C and D) Determination of a hypermutation threshold in human cancer through segmented linear regression analysis. Dotted lines indicate segment boundaries determined by segmented linear regression analysis using an iterative method. Red lines indicate linear regression lines of individual segments. The boundary points at which there was observed to be a significantly large gain in the slope of the regression line (shown in blue), were selected as the thresholds of hypermutation (9.91 and 9 for pediatric and adult cohort respectively), which were rounded to 10 for the remainder of the analyses described in this study. (C) Pediatric cohort of 2,885 tumors ranked by mutation burden (mut/Mb). (D) Adult cohort of 78,452 tumors ranked by mutations burden (mut/Mb).
(E) Mutation status of MMR and POL mutations in pediatric tumors with mutation burden < 10. Unselected mutations in replication repair genes are randomly distributed and do not cluster around the hypermutation threshold further supporting that these specific alterations are passengers and not driving hypermutation.
Figure S2. Association of MSI-H and Replication Repair Mutations with Mutation Burden, Related to Figure 1
(A) 81 unique tumor histologies with at least 1 MSI-H tumor.
(B) Percent MSI-H tumors versus mutation burden. Barplot shows the percentage of MSI-H tumors out of all tumors at the respective mutation burden bin. MSI-H tumors concentrated in the 10-100 mutation burden range.
(C) Pediatric cancers with a combined mismatch repair deficiency and polymerase driver mutation display an ultrahypermutant phenotype. Cohort of 2885 pediatric tumors harboring either MMR and polymerase mutations concurrently, only mismatch repair mutations, only polymerase mutations, or neither. The presence of a mismatch repair mutation is significantly associated with hypermutation, while a polymerase mutation alone is not.
Figure S3. Determining True Hypermutation Driver Mutations in POLE, Related to Figure 2
(A) Variant allele fraction (VAF) of POLE R446Q mutation. Boxplot shows the VAF of POLE R446Q mutation in 64 tumors. The majority of mutations clustered at 0.5, signifying that it is a germline SNP and not a hypermutation driver.
(B) L424I and L424V POLE mutations vary in their degree of reduced exonuclease function. Excision rate constants of 3′-5′ exonuclease activity catalyzed by Polε and the indicated mutants at 37°C.
Figure S4. Signature Analysis of Hypermutant Lung Cancer and TCGA Sarcoma Reveals Predominance of Signature 7 (UV Light) in Hypermutant Lung Squamous Cell Carcinoma and Sarcoma, Related to Figure 3
(A) Proportion of Signature 7 versus Signature 4 (Smoking) in 100 hypermutant lung cancer samples run on cancer panel. Circle sizes indicate tumor mutation burden in mutations/Mb, and colors represent lung cancer subtype.
(B) Proportion of Signature 4 in lung cancers by subtype.
(C) Proportion of Signature 7 in lung cancers by subtype.
(D) Number of somatic SNVs in 103 TCGA sarcoma exomes (minimum 50 somatic SNVs). Magenta indicates proportion of mutations explained by Signature 7 (UV light). Grey indicates proportion of mutations explained by all other signatures.
Figure S5. High Mutation Burden and Specific Signatures Reveal Predisposition and Treatment History in Pediatric Cancers, Related to Figure 6
(A) Signature analysis for all ultrahypermutant (> 100 mut/Mb) pediatric tumors. All signatures associated with replication repair deficiency were combined (black). Signatures associated with alkylating agents are shown in turquoise. 19 patients with ultrahypermutant tumors were confirmed for germline cancer predisposition involving replication repair genes. Numbers above each bar represent the mutation burden for that tumor.
(B) Signature analysis for hypermutant pediatric tumors (10-100 mut/Mb) – hypermutant pediatric tumors of the three tumor types typically associated with CMMRD (brain, GI, leukemia/lymphoma) were enriched for RRD signatures. Two brain tumor patients were retrospectively confirmed as CMMRD (50 mut/Mb) and Lynch (34 mut/Mb) respectively.