Abstract
The proton-coupled electron transfer (PCET) reaction catalyzed by soybean lipoxygenase has served as a prototype for understanding hydrogen tunneling in enzymes. Herein this PCET reaction is studied with mixed quantum mechanical/molecular mechanical (QM/MM) free energy simulations. The free energy surfaces are computed as functions of the proton donor-acceptor (C—O) distance and the proton coordinate, and the potential of mean force is computed as a function of the C—O distance, inherently including anharmonicity. The simulation results are used to calculate the kinetic isotope effects for the wild-type enzyme (WT) and the L546A/L754A double mutant (DM), which have been measured experimentally to be ~80 and ~700, respectively. The PCET reaction is found to be exoergic for WT and slightly endoergic for the DM, and the equilibrium C—O distance for the reactant is found to be ~0.2 Å greater for the DM than for WT. The larger equilibrium distance for the DM, which is due mainly to less optimal substrate binding in the expanded binding cavity, is primarily responsible for its higher kinetic isotope effect. The calculated potentials of mean force are anharmonic and relatively soft at shorter C—O distances, allowing efficient thermal sampling of the shorter distances required for effective hydrogen tunneling. The primarily local electrostatic field at the transferring hydrogen is ~100 MV/cm in the direction to facilitate proton transfer and increases dramatically as the C—O distance decreases. These simulations suggest that the overall protein environment is important for conformational sampling of active substrate configurations aligned for proton transfer, but the PCET reaction is influenced primarily by local electrostatic effects that facilitate conformational sampling of shorter proton donor-acceptor distances required for effective hydrogen tunneling.
Graphical abstract
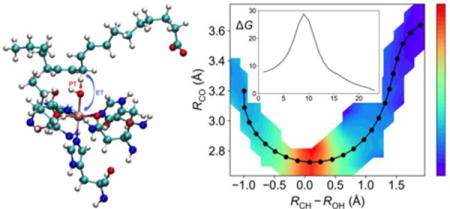
1. Introduction
Lipoxygenases are physiologically important enzymes that catalyze the dioxygenation of polyunsaturated fatty acids in mammals, invertebrates, plants, fungi, and bacteria.1-7 The products of this reaction play vital roles in various metabolic processes for these organisms.8 Soybean lipoxygenase-1 (SLO) catalyzes the dioxygenation of linoleic acid and has been studied extensively with a variety of experimental methods.9-10 The rate-limiting step in the catalytic cycle above 32° is the proton-coupled electron transfer (PCET) reaction,9 in which the proton transfers from the C11 carbon of the linoleic acid substrate to the hydroxyl group that is coordinated to the iron of the cofactor, while the electron transfers from the π-backbone of the linoleic acid to the iron (Figure 1).10-13 The PCET reaction in the wild-type (WT) SLO enzyme has an unusually high kinetic isotope effect (KIE) of ~80 at room temperature.10 Moreover, recently the L546A/L754A double mutant (DM) of SLO was found to have a catalytic rate constant that is decreased by ~104-fold relative to the WT value, along with a much higher KIE of 500−700 that exhibits a somewhat weaker temperature dependence.14-15
Figure 1.
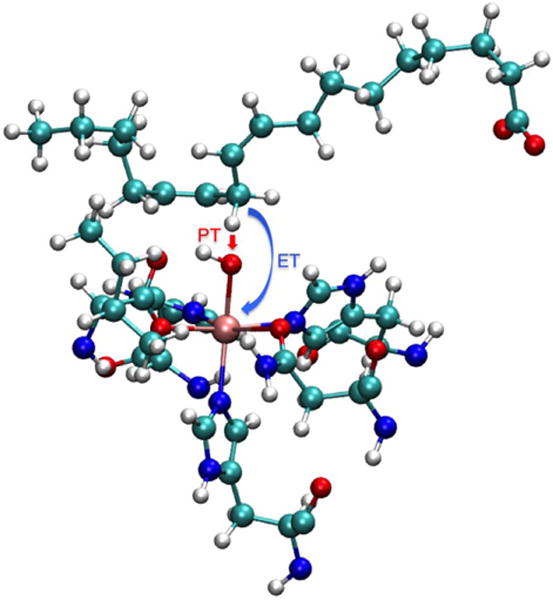
The PCET reaction between the linoleic acid and the iron cofactor in SLO: the proton transfers from C11 of linoleic acid to the iron-coordinated hydroxyl group, and the electron transfers from the π-backbone of the linoleic acid to the ferric iron, reducing it to the ferrous state.
Due to its unusually high KIE, as well as the availability of extensive experimental data on mutants, SLO has served as a prototype for PCET reactions in enzymatic systems. A wide range of theoretical approaches has been used to model this PCET process.11-30 Our group has performed systematic studies of the PCET reaction catalyzed by SLO and its mutants using our general nonadiabatic PCET theory.13-15, 21, 25, 27-28, 31 Our initial work was based on a multistate continuum theory,13 but subsequent studies treated the enzyme and solvent explicitly using classical molecular dynamics (MD) simulations to compute the probability flux correlation functions.21 These studies highlighted the importance of the proton donor-acceptor distance32 (i.e., the C—O distance) and its corresponding vibrational frequency in determining the magnitude and temperature dependence of the KIE. For the studies of mutants,14-15, 25, 31 the equilibrium C—O distance and frequency were parameterized to reproduce experimental data due to the challenges associated with determining these properties from classical MD simulations. Moreover, for simplicity the proton donor-acceptor vibrational motion was often assumed to be harmonic, although clearly anharmonic effects become important at short distances. In a recent study utilizing similar nonadiabatic rate constant expressions,30 WT and DM SLO were modeled by representing the potential energy surface dictating the proton donor-acceptor motion as the sum of a gas phase quantum mechanically inspired potential, an empirical harmonic potential representing the non-electrostatic influence of the environment, and an electrostatic field chosen to compress the donor-acceptor mode.30 This work highlighted the importance of anharmonic effects at the proton transfer interface but still utilized empirical functional forms to model both this interface and the environmental effects.
To elucidate the fundamental physical principles underlying this enzymatic process, herein we calculate the three-dimensional free energy surfaces associated with the PCET reaction for WT and DM SLO using a mixed quantum mechanical/molecular mechanical (QM/MM) approach that treats the active site with density functional theory (DFT) and includes the effects of the entire solvated enzyme. The reaction free energies and free energy barriers for the PCET reaction on the electronic ground state are obtained from these simulations. In addition, the free energy profiles as a function of the proton donor-acceptor distance are determined. These results are used in the nonadiabatic rate constant expression without any assumptions of a specific form for the potential energy surface associated with the proton donor-acceptor mode, thereby naturally incorporating anharmonic effects. The resulting KIEs, as well as their temperature dependencies, are compared to experimental data for the WT and DM SLO systems. The role of electrostatics in facilitating the proton transfer from C11 to the hydroxyl group is also illustrated by these QM/MM simulations. This study provides fundamental insights into the significant roles of local quantum mechanical effects and electrostatics in enzyme catalysis and specifically their impact on gating motions relevant to proton transfer, hydride transfer, and PCET.
2. Methods
The PDB entries 3PZW33 and 4WHA14 were used to prepare the initial structures of the WT and DM systems, respectively. The Jackal package was utilized to add missing heavy atoms and refine the structures.34 Autodock Vina35 and AutodockTools36 were employed to dock the linoleic acid, assuming the carboxylate-in orientation.37 The enzyme was solvated in explicit water with 0.15 M NaCl added to approximate reasonable experimental conditions. The TIP3P water model38 was used to simulate the explicit water molecules, and the van der Waals parameters for Na+ and Cl− ions were obtained from the hydration free energy (HFE) parameter set for TIP3P from Ref 39. For the equilibration procedure, the AMBER ff14SB force field40 with extensions for the linoleic acid substrate and iron cofactor was used to describe the system using the AMBER software package.41-42 The details of the system preparation and equilibration procedure are provided in the Supporting Information (SI).
We used a QM/MM potential energy surface for the free energy simulations. As shown in Figure 2, the sidechains of His499, His504, His690, and Asn694, together with the carbonyl group of Ser838, as well as the iron atom, hydroxyl group, linoleic acid, and Ile839 were included in the QM region. The QM region has a total charge of zero and spin multiplicity of six, corresponding to the high spin Fe(III) ion in the reactant state and the high-spin Fe(II) ion, as well as the linoleic acid radical, in the product state. The B3LYP density functional43 with the 6-31G** basis set was used to treat the QM region, while the AMBER ff14SB force field40 was used to describe the MM region. Hydrogen link atoms were used to cap the cut bonds at the QM/MM interface. The CHARMM software package,44-45 with an interface to Q-Chem46 for the QM calculations, was used to perform the QM/MM free energy simulations.
Figure 2.
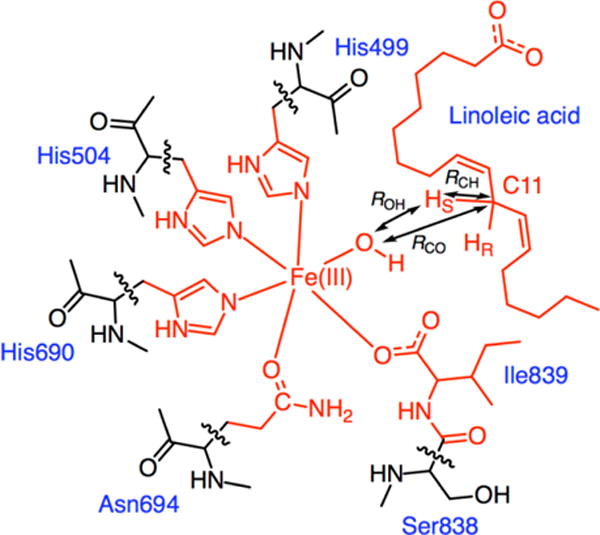
Depiction of the QM region used in the QM/MM simulations. The QM region consists of a total of 122 atoms, including the 117 atoms depicted in red and five hydrogen link atoms at the marked cut bonds. The reaction coordinates used in the finite temperature string method to describe the PCET reaction are represented as double-headed arrows.
The finite temperature string method47-49 with umbrella sampling was used to calculate the multi-dimensional free energy surfaces corresponding to PCET in WT and DM SLO. Three reaction coordinates, RCH, ROH, and RCO, were chosen to represent the PCET process, as depicted with double-headed arrows in Figure 2. The string associated with PCET is represented by a series of images that are each defined by specific values of these three reaction coordinates. An initial string was generated by quadratic interpolation between the optimized reactant, transition state, and product structures. After equilibration of each image with restraints imposed on the reaction coordinates, the average values of the reaction coordinates were determined for each image. A new string was generated based on these average reaction coordinates, followed by data collection with the corresponding new restraints imposed on the reaction coordinates. After this first iteration, the average values of the reaction coordinates were determined for each image, and another string was generated from these values. This procedure was continued for subsequent iterations until the string and free energy profile along the string converged, as described in the SI and depicted in Figures S1 and S2 for the WT and DM systems, respectively. All of these simulations were performed at 300 K. Additional technical details are provided in the Supporting Information.
The final string represents the minimum free energy path (MFEP) for the PCET reaction. The WHAM50 approach was used to unbias the data from all of the iterations to compute the three-dimensional free energy surface, which was projected onto a two-dimensional surface depending on RCO and RCH−ROH. The resulting free energy along the final string represents the free energy profile associated with the PCET process. A similar unbiasing procedure was used to generate the free energy along the proton donor-acceptor distance, also denoted the potential of mean force (PMF).
3. Results and discussion
3.1. QM/MM minimum free energy paths
We calculated the two-dimensional free energy surfaces, as well as the free energies along the MFEPs, for WT and DM SLO using the QM/MM free energy simulation approach described above (Figure 3). The free energies along these MFEPs with statistical error bars are shown in Figure S3. Our results indicate that the reaction free energy for WT SLO is −5.8 kcal/mol. This value agrees well with the value of −5.4 kcal/mol determined previously13 from the experimental redox potential of WT SLO in the absence of substrate,51 assuming that the reduction is proton-coupled, and the experimental bond dissociation energy of the pentadienyl CH bond of linoleic acid.52 Interestingly, our results indicate that the reaction free energy of the DM is 3.9 kcal/mol, suggesting that mutation of only two residues in the binding pocket increases the reaction free energy by ~10 kcal/mol. To investigate whether this result is reproducible, we performed an independent QM/MM free energy simulation starting from a different structure obtained by mutating the WT SLO crystal structure PDB 3PZW. As shown in Figure S4, the results from this independent simulation indicate the same trend in the reaction free energy. This difference in reaction free energy for the DM compared to WT SLO could arise from environmental effects of the protein that were not considered in the experimental estimate of the reaction free energy for WT SLO.
Figure 3.
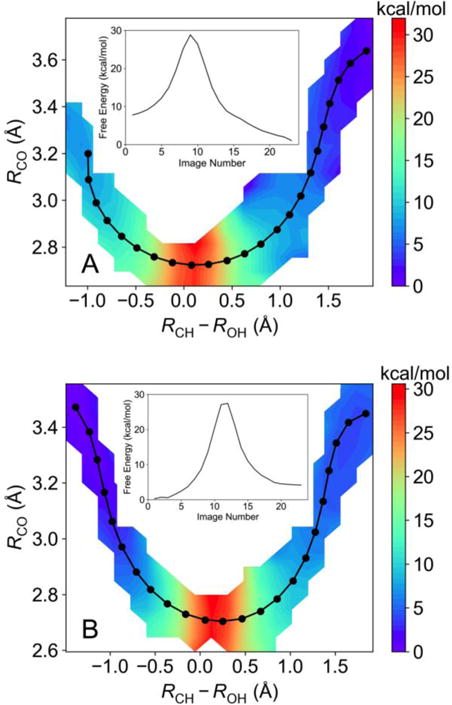
The 2D free energy surface as a function of the RCO and RCH−ROH coordinates, as well as the converged string corresponding to the MFEP (in black) and the free energy along this MFEP (insert) for (A) WT SLO and (B) DM SLO. These surfaces were calculated using the QM/MM finite temperature string method with umbrella sampling at 300 K.
The QM/MM free energy simulations indicate that the free energy barriers for PCET on the electronic ground state are 21 kcal/mol and 27 kcal/mol for WT and DM SLO, respectively. Utilizing the standard adiabatic transition state theory rate constant with a prefactor of kBT/h, assuming that the transmission coefficient is unity, leads to a rate constant of 3.1×10⁻³ s−1 at 300 K for WT SLO, which is much smaller than the experimentally determined catalytic rate constant kcat of 297 s−1.11 The analogous adiabatic transition state theory rate constant for the DM is 1.3×10⁻⁷ s−1, which is much smaller than the experimentally determined kcat of 0.0225 s−1.15 These discrepancies obtained with an adiabatic treatment are consistent with our previous diagnostic calculations indicating that the PCET reaction in SLO is nonadiabatic.27 A similarly high free energy barrier (18.6 kcal/mol) was obtained for the PCET reaction in the 15-LOX-2 system using a different but related QM/MM method.53
3.2. Free energy along CO distance
The probability distribution function associated with the proton donor-acceptor distance plays an important role in determining the rate constants and KIEs of PCET reactions. We obtained the free energy profiles along RCO for the reactant state by generating the 2D free energy surface as a function of RCO and RCH and evaluating the slice along RCO for which RCH = 1.09 Å (Figure 4). These PMFs indicate that the equilibrium RCO value is Req ~ 3.3 Å for WT SLO and ~3.5 Å for the DM. The former value is similar to the sum of the van der Waals radii of the donor and acceptor atoms (i.e., the van der Waals radii were determined54 to be 1.77 and 1.50 Å for C and O, respectively). It is also consistent with recent work that estimated the equilibrium RCO value to be Req ~ 3.1±0.2 Å in the active conformer of WT SLO based on classical MD simulations with experimentally determined ENDOR restraints on the metal-C10 and metal-C11 distances.37 The equilibrium distance Req is considerably larger for the DM, which is consistent with the observation that the rate constant is smaller and the KIE is higher for the DM than for WT SLO. Note that these equilibrium distances are somewhat larger than those obtained in most previous modeling studies of the PCET reaction in SLO,14, 21, 30-31 although the trend between WT and the DM is the same as in previous studies (see Table S1).
Figure 4.
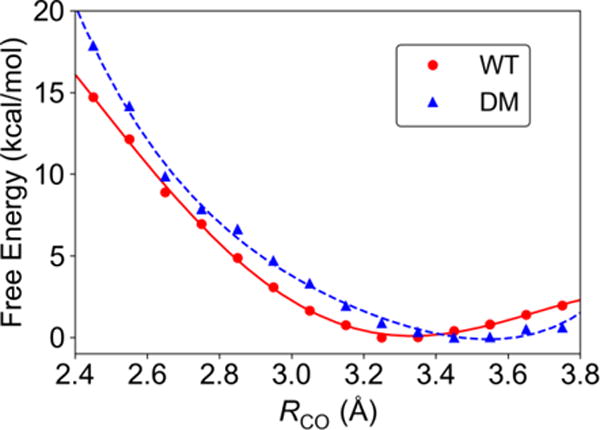
The free energy along RCO for the reactant state, corresponding to a slice of the 2D free energy surface for which RCH = 1.09 Å, for WT (red circles) and DM (blue triangles) SLO. The red solid and blue dashed curves are fits to a fourth-order polynomial.
Previous modeling studies often assumed that the PMF along RCO is harmonic, whereas the curves in Figure 4 indicate a significant degree of anharmonicity. In particular, the PMF obtained from the QM/MM free energy simulations is significantly softer at shorter distances compared to the harmonic potentials used in previous modeling (Table S1). For example, a decrease in RCO from ~3.3 Å to ~2.7 Å is associated with only ~8 kcal/mol increase in free energy for WT SLO. As mentioned above, the sum of the van der Waals radii for C and O is ~3.27 Å, which has occasionally been interpreted to imply a highly repulsive potential at shorter distances. As depicted in Figure S5, however, the van der Waals interaction between a C and O atom using the parameters from the AMBER force field indicates an energy penalty of only 3 kcal/mol for a decrease in RCO from ~3.3 Å to ~2.7 Å, which is even softer than the PMFs for WT and DM SLO. The electrostatic interaction between the positively charged carbon and negatively charged oxygen would decrease this energy even further as the distance decreases. However, separating interactions into electrostatic and van der Waals terms is not rigorous, and QM calculations are required to fully understand these interactions.
To clarify the interactions at the proton transfer interface, we performed energy scans of a gas phase cluster model for the SLO-substrate complex shown in Figure 5. The transition state geometry for this model system was optimized previously at the B3LYP/6-31G** level of theory.27 The rigid energy scans depicted in Figure 5 were obtained by starting at this transition state geometry and increasing and decreasing RCO, while retaining the rigid geometries of the substrate and iron complex components. The energies were obtained with both a fully QM method at the B3LYP/6-31G** level of theory and the MM force field described above. For comparison, the PMF for the WT SLO obtained with QM/MM free energy simulations is also depicted. Note that this curve corresponds to free energy rather than energy, so the comparison assumes that the entropy is not changing significantly along this distance, which is a reasonable assumption for this type of analysis.
Figure 5.
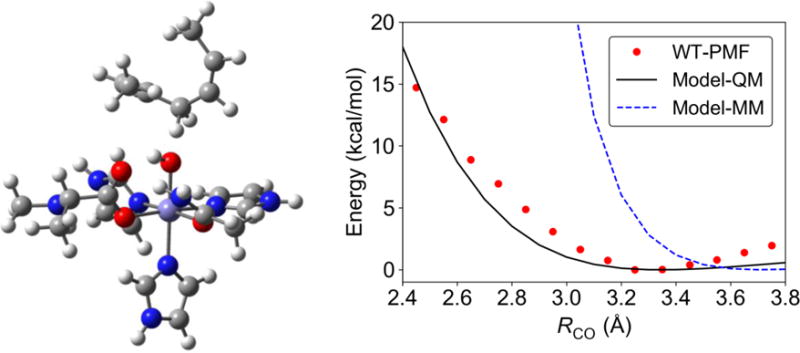
Gas phase model (left) used to probe the energy along RCO with QM and MM methods (right). The energies were computed with a rigid body scan, starting with the transition state geometry for this complex and retaining the geometries of the individual substrate and Fe complex components as RCO is changed. The QM energy was obtained at the B3LYP/6-31G** level of theory, and the MM energy was obtained with the AMBER force field with extensions (see SI). For comparison, the PMF, which corresponds to free energy, for the WT SLO obtained with QM/MM free energy simulations is also depicted in this figure. Additional rigid scans for the gas phase model obtained with different QM levels of theory at each value of RCO, as well as scans with smaller gas phase models, are provided in the SI (Figures S6 and S7). These QM calculations were performed using Gaussian 09, Revision D.01.55
Figure 5 illustrates that the QM energy for the gas phase model is qualitatively similar to the QM/MM PMF. This similarity suggests that the energy changes as RCO decreases are influenced mainly by local effects within the active site rather than long-range interactions with the enzyme. In contrast, the MM force field is much more repulsive at shorter distances, implying that a MM force field is insufficient to describe this PCET interface. Decomposition of the terms in the force field reveals that these repulsive interactions are due mainly to the van der Waals interaction between the hydrogen and the oxygen at the CH—O interface (Figure S8). As discussed above and shown in Figures S5 and S8, the van der Waals interaction between the carbon and oxygen is not as repulsive at these distances. We also performed the QM energy calculations at different levels of theory (i.e., B3LYP/6-311++G**, M06/6-31G**, M06-2X/6-31G**, B3P86/6-31G**) and observed qualitatively similar energy profiles (Figure S6). These results indicate that the qualitative trends are not sensitive to the specific level of QM theory used in the QM/MM free energy simulations. In addition, we performed QM energy scans for smaller gas phase models with C3H8 or CH4 instead of C7H12 as the substrate. Our results illustrate that these smaller models, which do not contain double bonds, lead to more repulsive potentials at shorter distances (Figure S7) and therefore are not representative of the SLO system.
Previously Champion and coworkers30 proposed that both a strong electrostatic field and non-electrostatic interactions with the protein environment are crucial for describing the changes in the potential energy along the C—O distance. They used a gas phase QM model consisting of methane as the proton donor and [OH]δ− as the proton acceptor, treating the charge δ as a parameter to generate the “bare” potential. To reproduce the experimental data, they added a protein compressive force consisting of a harmonic conformational potential, where the force constant and equilibrium distance may be treated as parameters, and a strong electrostatic field along the C—O axis, where the magnitude of the field may be treated as another parameter. Alternatively, the protein compressive force could be treated as a single parameter that represents the sum of these two effects. We emphasize that our results rely solely on the QM/MM free energy simulations and do not require any parameters related to the PCET interface. Most importantly, our results indicate that the interactions dictating the potential energy along the C—O distance are predominantly local and do not require any long-range protein compressive force due to a strong electric field or non-electrostatic conformational forces. Instead, the QM/MM free energy simulations indicate that the free energy along RCO is relatively soft at short C—O distances because of short-range QM interactions. The gas phase QM model used by Champion and coworkers (i.e., methane and [OH]δ−) was too small to fully describe the interface between the substrate, which has a π backbone, and the iron cofactor (Figure S7). When a sufficiently large gas phase model (i.e., the model shown in Figure 5) is utilized, the potential energy along RCO is relatively soft and does not need to be “dressed” by a protein compressive force.
To investigate the structural differences between the substrate-bound active sites of WT and DM SLO, we compared representative structures of WT and DM for the reactant state (Figure 6). This comparison illustrates that the double mutation (L546A and L754A) creates a larger cavity for binding the substrate than found in WT SLO, allowing the π backbone of the linoleic acid to adopt a different conformation. Thus, the substrate is not bound as tightly for the DM, allowing it to sample greater conformational space within the binding pocket and resulting in less optimal orientation of the CH—O interface. These differences in the substrate binding configurations for WT and DM SLO may be the physical basis for the larger equilibrium RCO distance for the DM and the different free energy profiles depicted in Figure 4. Previous work suggested a rigidification of the active site for the DM SLO,15 whereas these current simulations suggest an expanded binding pocket that does not bind the substrate in an optimal orientation. As discussed above in the context of the PMFs (Figure 4), however, the less optimal substrate binding leads to a lower probability of sampling the shorter C—O distances for the DM SLO, which can be interpreted as a type of rigidification.
Figure 6.
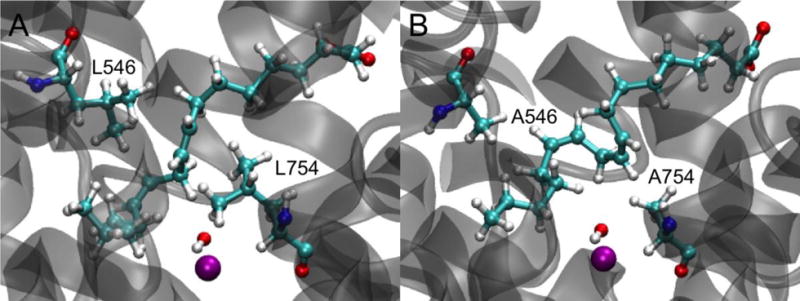
Representative reactant state structures of the binding pocket and linoleic acid in (A) WT and (B) DM SLO. The Fe3+ ion is shown as a purple sphere, while linoleic acid, residue 546 (upper left), residue 754 (lower right), and the iron-bound hydroxyl group are shown with ball and stick representations. Each structure was obtained from the last snapshot of the first image in the last cycle of the WT or DM SLO string simulations.
Note that these simulations assume that the substrate is bound in the direction with the negatively charged carboxylate group pointed toward Arg707. This orientation has not been confirmed experimentally because of the lack of a crystal structure for SLO-1 with bound substrate. However, previous docking simulations and classical MD simulations using the ENDOR restraints suggest that this orientation is preferred.37 Although the quantitative aspects of the QM/MM simulations presented herein depend on this choice of orientation and on the initial docking of the substrate to the WT and DM SLO, the qualitative results are not expected to be sensitive to these aspects.
3.3. Role of electrostatics
Although our calculations suggest that a protein compressive force is not required to qualitatively model the proton donor-acceptor motion (i.e., the free energy along RCO), our calculations still highlight the importance of electrostatics in this PCET reaction. In particular, the shapes of the free energy profiles depicted in Figure 4 are determined predominantly from the fundamental Coulombic interactions between nuclei and electrons in the QM region. However, separating the electrostatic and non-electrostatic interactions, such as van der Waals interactions, within a QM calculation is not a well-defined or meaningful procedure.56
Although we cannot separate out the electrostatic contributions to the free energy along RCO, we are able to calculate the conformationally averaged electrostatic field on the H atom projected along a vector parallel to the C—O axis (Figure 7A). This electrostatic field was calculated using CHELPG partial atomic charges57 for the QM region and the standard AMBER ff14SB force field partial atomic charges for the MM region. Moreover, these fields were computed in a manner that included only electrostatic interactions consistent with the AMBER force field and were averaged over 18 ps sampling. For both WT and DM SLO, we found that this electrostatic field is ~100 MV/cm and is oriented in the direction to facilitate the transfer of a positively charged proton from the carbon to the oxygen. Moreover, this electrostatic field is due mainly to the active site atoms (Figure 7B) and increases dramatically as RCO decreases. In addition to facilitating proton transfer, these local electrostatic interactions within the active site are at least partially responsible for the relatively soft free energy profile along RCO observed in Figure 4, as supported by the comparisons depicted in Figure 5 and Figure S8.
Figure 7.
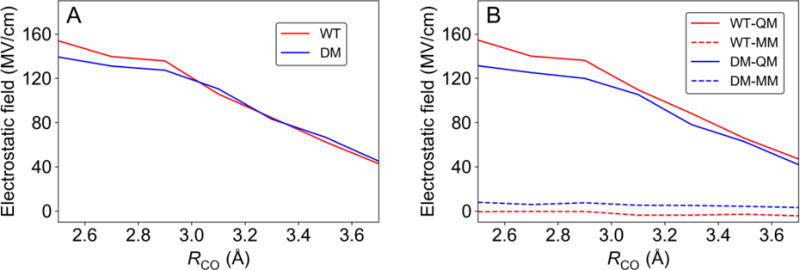
(A) The electrostatic field at the H atom projected along a vector parallel to the C—O axis (i.e., from C to O) and (B) contributions from the QM and MM regions. These figures were generated for RCH = 1.09 Å.
3.4. Theoretical modeling of the kinetic properties
We calculated the rate constants for both H and D transfer in WT and the DM SLO using the following nonadiabatic PCET rate constant expressions:31, 58-60
| (1) |
| (2) |
Eq. (1) is the thermally averaged PCET rate constant, where W(R) is the PMF along RCO, as depicted in Figure 4, k(R) is the rate constant evaluated at a fixed distance RCO, and C is a constant with units of inverse length. In Eq. (2), the summations are over reactant and product electron-proton vibronic states, is the Boltzmann population of reactant state μ, λ is the total reorganization energy, is the reaction free energy for vibronic states μ and ν, is the overlap integral between the hydrogen vibrational wavefunctions for states μ and ν at R, and is the electronic coupling. The hydrogen vibrational wavefunctions were obtained by solving the one-dimensional Schrödinger equation for a hydrogen (or deuterium) moving in the reactant and product diabatic potentials shown in Figure S9, as obtained previously with constrained DFT for the model system depicted in Figure 5.27 The vibrational wavefunctions and energy levels were computed for each diabatic proton potential with the Fourier grid Hamiltonian method.61 The separation between the minima of these diabatic proton potentials was altered to calculate the overlap integrals for different values of RCO.
The reaction free energies were calculated as , where and correspond to the proton vibrational state energy levels in the reactant and product diabatic potentials, respectively, and was chosen to be the reaction free energy obtained from the QM/MM free energy simulations. Specifically, as indicated by Figure 3, = −5.8 kcal/mol for WT SLO and = 3.9 kcal/mol for the DM SLO. The reorganization energy λ was chosen to be 13.4 kcal/mol for both the WT and DM systems on the basis of previous studies,31 although the KIEs do not depend significantly on this parameter. The rate constant was found to be converged when three electron-proton vibronic states were included for both the reactant and product. The integral over R in Eq. (1) was performed numerically using the PMFs obtained from the QM/MM free energy simulations of the WT and DM SLO (i.e., the free energy profiles depicted in Figure 4) with a scaling factor discussed below.
As discussed previously,15 the experimentally measured rate constant can be expressed as
| (3) |
where is associated with the stochastic sampling of different conformational states and is an equilibrium constant between the sets of inactive and active conformations (i.e., the fraction of active conformations among all possible conformations). The equilibrium constant is much less than unity, indicating that the population of active conformations is much smaller than that of inactive conformations. Moreover, as shown by ENDOR experiments,37 is significantly smaller for the DM than for WT SLO, providing an explanation for the significantly lower rate constant for the DM compared to WT SLO.15 Inclusion of << 1 is necessary to obtain agreement between the calculated and experimentally measured absolute rate constants.31 For the present study, however, the prefactor is expected to be the same for hydrogen and deuterium transfer and therefore does not impact the calculated KIEs.
The main difference between the KIEs calculated herein and previously calculated values is that the proton donor-acceptor vibrational motion is simulated based on the PMF obtained from QM/MM free energy simulations. As a result, the potential energy associated with the proton donor-acceptor vibrational mode is not assumed to be harmonic, and the equilibrium C—O distance and frequency associated with a harmonic oscillator are not fit to experimental data. In addition, the reaction free energy is also obtained from the QM/MM free energy simulations, rather than assumed to be the previously experimentally determined value for WT SLO for both systems. We found that the KIEs and their temperature dependencies are extremely sensitive to the shape of the PMF along RCO at shorter distances (i.e., at distances less than 3.2 Å), although they were found to be virtually independent of the PMF at larger distances, as indicated by the observation that the numerical integration in Eq. 1 is converged to five significant figures with an upper limit of 3.2 Å. When the raw PMFs from Figure 4 are used directly in the rate constant calculations, the qualitative trend between the WT and DM KIEs, where the KIE is larger for the DM, is reproduced, but the quantitative agreement with experiment is lacking (Figure S10). On the other hand, the experimental data can be reproduced using a multiplicative factor for the PMFs that is 0.95 and 1.15 for WT and DM SLO, respectively.
Figure 8 depicts the resulting calculated KIEs in comparison to the experimental data. Note that the experimental error bars in the KIE for the DM are quite large because the reaction is so slow. Thus, the qualitative level of agreement is reasonable. The temperature dependence of the KIE for WT SLO, which is over-estimated in the calculations, is very sensitive to the shape of the PMF. As shown previously,13-14, 21, 25, 31 this nonadiabatic PCET theory can describe the experimentally observed magnitude and temperature dependence of the KIEs more accurately if appropriate parameters are utilized. Moreover, minor modification of the PMF at shorter distances within the error of the QM/MM simulations due to the limitations discussed below would lead to weaker temperature dependence of the KIE. The purpose of the present paper, however, is to utilize the QM/MM free energy simulations as input to the rate constant expressions to provide deeper insights. For example, we found that the reaction free energy is exoergic for WT SLO but slightly endoergic for the DM. Moreover, we found that the equilibrium C—O distances are larger than in previous modeling studies because the PMF is anharmonic and much softer for shorter distances than assumed previously, thereby enabling effective sampling of shorter distances even when the equilibrium distance is larger. Specifically, the dominant C—O distances (i.e., the maximum of the integrand in Eq. 1) are 2.69 Å and 2.76 Å for WT and DM SLO, respectively, even though the equilibrium distances are 3.3 Å and 3.5 Å, respectively.
Figure 8.
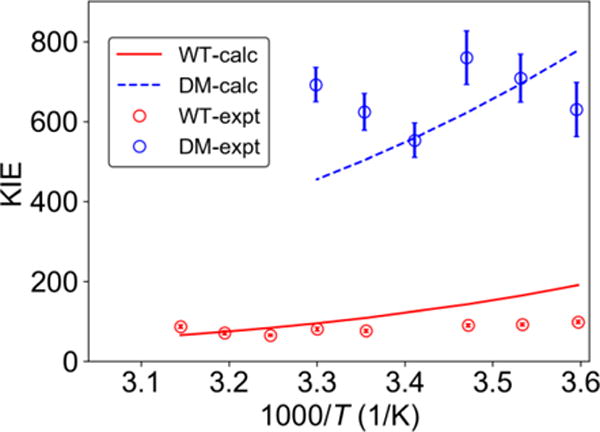
Experimentally measured (data points with error bars) and theoretically calculated (solid and dashed curves) KIEs for WT and DM SLO. The calculated curves were obtained by scaling the PMFs for WT and DM by 0.95 and 1.15, respectively. The experimental data were obtained from Ref. 11 for WT and Ref. 15 for DM SLO.
As discussed above, the differences in the PMFs for WT and DM SLO are due mainly to differences in substrate binding within the active site (Figure 6). In particular, the double mutation leads to an expanded binding cavity, which results in a larger equilibrium C—O distance and therefore a larger KIE for the DM SLO. This trend is accurately reproduced by the QM/MM free energy simulations. Due to sampling limitations, however, we are unable to simulate all possible binding configurations for both WT and DM SLO. In particular, the substrate could adopt many different backbone conformations and could even sample different orientations (i.e., the substrate-out as well as the substrate-in orientation). In addition to sampling limitations, the simulations rely on several other approximations, including the one-dimensional quantum mechanical treatment of the transferring proton, the assumption that the shapes of the diabatic proton potentials are independent of RCO, and errors associated with DFT and the molecular mechanical force field. As a result of these approximations, the computed PMFs, which reflect the relative probabilities of sampling different C—O distances, are not quantitatively accurate, although they are qualitatively meaningful.
Figure 9 depicts the importance of conformational sampling (i.e., stochastic, thermal motions) in this enzyme reaction. The “reaction coordinate” associated with nonadiabatic PCET contains an environmental component and is analogous to the collective solvent coordinate used in Marcus theory. The “ensemble conformations” are not rigorously separable from the “reaction coordinate” but qualitatively correspond to thermal fluctuations converting inactive to active enzyme-substrate conformations versus thermal fluctuations leading to PCET along the reaction coordinate. Moreover, movement along the PCET reaction coordinate requires further conformational motion to sample the smaller C—O distances required for effective hydrogen tunneling. In addition, the potential energy surface associated with the active configurations (yellow basin in Figure 9) contains many local minima corresponding to different bound substrate conformations, connected by thermally accessible barriers, and the projected free energy surface is obtained by thermal averaging over these conformations.
Figure 9.
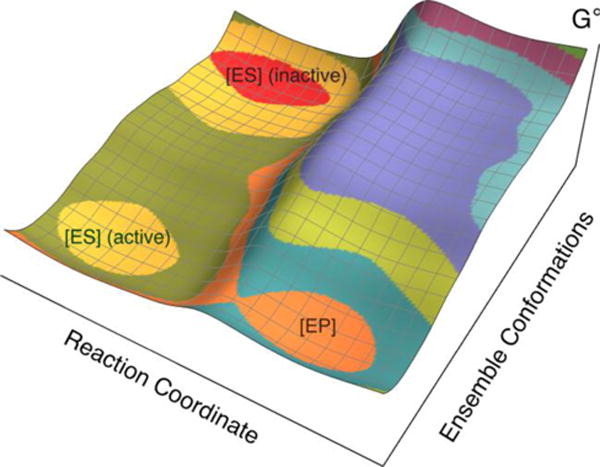
Schematic depiction of the free energy landscape for soybean lipoxygenase. The axis labeled “Ensemble Conformations” corresponds to conformational sampling of the overall enzymatic system converting inactive enzyme-substrate configurations (red basin) to active enzyme-substrate configurations (yellow basin) that are aligned for proton transfer from C11 of linoleic acid to the oxygen of the iron-coordinated hydroxide. The free energy of the basin associated with active configurations (yellow) is higher than that associated with inactive configurations (red), indicating an equilibrium constant that is significantly less than unity for the conversion from inactive to active configurations. The axis labeled “Reaction Coordinate” corresponds to the PCET reaction, which is thought to occur by a nonadiabatic PCET mechanism from an active configuration (yellow basin) to the product (orange basin). Figure modelled after figure in Ref. 15.
When the system originates in the region of conformational space corresponding to inactive configurations (red basin), it needs to sample conformational space in order to reach the region corresponding to active configurations (yellow basin). Based on ENDOR experiments, the DM has a smaller fraction of active configurations (i.e., a smaller equilibrium constant Keq between the inactive and active configurations). Moreover, based on the QM/MM free energy simulations conducted herein, the DM SLO samples active configurations with less optimal binding of the substrate, leading to a longer average C—O distance within the ensemble of active enzyme-substrate configurations (i.e., within the yellow basin). For both WT and DM SLO, the free energy profile along the C—O distance is anharmonic and relatively soft at shorter distances, enabling effective sampling of shorter C—O distances, because of local electrostatic interactions within the active site.
4. Conclusions
This paper presents QM/MM free energy simulations of the PCET reaction catalyzed by both WT and DM SLO. Due to the absence of crystal structures with bound linoleic acid substrate, the specific binding mode of the substrate is unknown. Our initial structures were based on docking of the substrate to WT or DM SLO in the reactant state, followed by QM/MM molecular dynamics sampling. These simulations indicate that the slightly expanded binding cavity for DM, which was also observed crystallographically,14 allows greater conformational sampling, leading to less tightly bound substrate with diminished orientational specificity. Moreover, the reaction free energy was found to be exoergic for WT SLO (ΔG° = −5.8 kcal/mol) and endoergic for the DM SLO (ΔG° = 3.9 kcal/mol), further suggesting differences in substrate binding.
The PMF along RCO, which is the free energy projected along this coordinate, provides further insight into the PCET mechanism and the role of electrostatics. For both the WT and DM systems, the PMF is softer than expected for shorter distances based on the sum of the van der Waals radii for carbon and oxygen, which is ~3.3 Å. Specifically, decreasing RCO from 3.3 Å to 2.7 Å entails a free energy penalty of only ~8 kcal/mol, implying that the shorter distance of 2.7 Å is sampled effectively at room temperature during catalysis. The relatively soft PMFs at shorter distances are found to be a local effect of the active site based on similarities to interaction energies from fully QM calculations on gas phase cluster models. The electrostatic and non-electrostatic interactions cannot be rigorously separated within the free energy calculations, but the interactions dictating the PMFs at shorter distances clearly arise from a balance among Coulombic interactions between nuclei and electrons in the region of the active site near the proton transfer interface. To further analyze the role of electrostatics in this PCET reaction, the conformationally averaged electrostatic field on the transferring H atom projected along a vector parallel to the C—O axis was computed for both WT and DM SLO. For both systems, this electrostatic field was found to be ~100 MV/cm oriented in the direction to facilitate the proton transfer reaction and was determined to arise mainly from the active site. The dramatic increase in this electrostatic field as RCO decreases suggests that the relatively soft free energy profiles along RCO for shorter distances are due at least in part to local electrostatic interactions.
The main difference between the PMFs for WT and DM SLO is that the equilibrium C—O distance in the reactant state is larger for DM, where Req = 3.3 Å for WT and Req = 3.5 Å for DM. Note that these distances are larger than those used in most previous modeling studies, mainly because these previous studies assumed more repulsive interactions at shorter distances within a harmonic treatment of the C—O mode, in contrast to the anharmonic behavior exhibited by the PMFs obtained from QM/MM simulations. The difference in the equilibrium distances for WT and DM is most likely due to the differences in substrate binding arising from the expanded binding cavity in the DM. Moreover, the larger equilibrium distance for the DM is primarily responsible for the experimentally observed colossal KIE of ~700 for the DM compared to the KIE of 80 for WT SLO. The magnitudes and temperature dependencies of the KIEs are found to be extremely sensitive to the shape of the PMF at shorter distances, which is challenging to determine quantitatively given limitations of sampling the many different possible substrate conformations and other approximations inherent to QM/MM simulations.
Our results indicate that the shorter C—O distances are sampled at room temperature via conventional thermal conformational sampling dictated predominantly by local electrostatic interactions near the proton transfer interface. The protein plays an important role in binding the substrate and maintaining a suitable orientation of the substrate relative to the iron cofactor. Moreover, conformational sampling of the entire system is essential for the conversion of inactive configurations to active configurations, where the substrate is aligned for the proton transfer reaction. Within the subspace of active configurations, further conformational sampling is necessary to sample the shorter C—O distances required for effective hydrogen tunneling. The higher KIE observed experimentally for the DM SLO is due to a larger average equilibrium C—O distance within the subspace of active configurations, and this larger average equilibrium distance is due mainly to less optimal substrate binding in the expanded binding cavity. This increased equilibrium C—O distance leads to a lower probability of sampling the shorter C—O distances for the DM compared to WT SLO. These observations are in contrast to previous studies30 suggesting that the protein environment must exert a compressive force on the carbon-oxygen distance to enable the sampling of shorter distances and that this compressive force is different for WT and DM SLO. Instead, our simulations imply that the main differences between WT and DM SLO are due to differences in substrate binding, and the overall protein environment plays a less specific role by providing the appropriate structural framework for conformational sampling. After the substrate is bound in an active configuration, the PCET reaction is dictated primarily by local effects within the active site.
Supplementary Material
Acknowledgments
We acknowledge the financial support from the National Institutes of Health Grant GM056207. We also acknowledge computing support from Extreme Science and Engineering Discovery Environment (XSEDE). We are also grateful for helpful discussions with Judith Klinman and Shenshen Hu.
Funding Sources
National Institutes of Health Grant GM056207
Footnotes
Supporting Information
The Supporting Information is available free of charge on the ACS Publications website.
Simulation details, data analysis details, force field parameters, convergence criteria, docking structures of the substrate, supplementary figures and tables (PDF)
Notes
The authors declare no competing financial interest.
References
- 1.Yamamoto S. Biochim Biophys Acta, Lipids Lipid Metab. 1992;1128:117–131. doi: 10.1016/0005-2760(92)90297-9. [DOI] [PubMed] [Google Scholar]
- 2.De Petrocellis L, Di Marzo V. Prostaglandins Leukot Essent Fatty Acids. 1994;51:215–229. doi: 10.1016/0952-3278(94)90183-x. [DOI] [PubMed] [Google Scholar]
- 3.Gerwick WH. Biochim Biophys Acta, Lipids Lipid Metab. 1994;1211:243–255. doi: 10.1016/0005-2760(94)90147-3. [DOI] [PubMed] [Google Scholar]
- 4.Shibata D, Axelrod B. J Lipid Mediat Cell Signal. 1995;12:213–228. doi: 10.1016/0929-7855(95)00020-q. [DOI] [PubMed] [Google Scholar]
- 5.Porta H, Rocha-Sosa M. Microbiology. 2001;147:3199–3200. doi: 10.1099/00221287-147-12-3199. [DOI] [PubMed] [Google Scholar]
- 6.Porta H, Rocha-Sosa M. Plant Physiol. 2002;130:15–21. doi: 10.1104/pp.010787. [DOI] [PMC free article] [PubMed] [Google Scholar]
- 7.Oliw EH. Prostaglandins Other Lipid Mediat. 2002;68:313–323. doi: 10.1016/s0090-6980(02)00037-0. [DOI] [PubMed] [Google Scholar]
- 8.Brash AR. J Biol Chem. 1999;274:23679–23682. doi: 10.1074/jbc.274.34.23679. [DOI] [PubMed] [Google Scholar]
- 9.Glickman MH, Klinman JP. Biochem. 1995;34:14077–14092. doi: 10.1021/bi00043a013. [DOI] [PubMed] [Google Scholar]
- 10.Rickert KW, Klinman JP. Biochem. 1999;38:12218–12228. doi: 10.1021/bi990834y. [DOI] [PubMed] [Google Scholar]
- 11.Knapp MJ, Rickert K, Klinman JP. J Am Chem Soc. 2002;124:3865–3874. doi: 10.1021/ja012205t. [DOI] [PubMed] [Google Scholar]
- 12.Lehnert N, Solomon EI. J Biol Inorg Chem. 2003;8:294–305. doi: 10.1007/s00775-002-0415-6. [DOI] [PubMed] [Google Scholar]
- 13.Hatcher E, Soudackov AV, Hammes-Schiffer S. J Am Chem Soc. 2004;126:5763–5775. doi: 10.1021/ja039606o. [DOI] [PubMed] [Google Scholar]
- 14.Hu S, Sharma SC, Scouras AD, Soudackov AV, Carr CAM, Hammes-Schiffer S, Alber T, Klinman JP. J Am Chem Soc. 2014;136:8157–8160. doi: 10.1021/ja502726s. [DOI] [PMC free article] [PubMed] [Google Scholar]
- 15.Hu S, Soudackov AV, Hammes-Schiffer S, Klinman JP. ACS Catal. 2017;7:3569–3574. doi: 10.1021/acscatal.7b00688. [DOI] [PMC free article] [PubMed] [Google Scholar]
- 16.Olsson MH, Siegbahn PE, Warshel A. J Am Chem Soc. 2004;126:2820–2828. doi: 10.1021/ja037233l. [DOI] [PubMed] [Google Scholar]
- 17.Olsson MH, Siegbahn PE, Warshel A. J Biol Inorg Chem. 2004;9:96–99. doi: 10.1007/s00775-003-0503-2. [DOI] [PubMed] [Google Scholar]
- 18.Tejero I, Eriksson LA, González-Lafont À, Marquet J, Lluch JM. J Phys Chem B. 2004;108:13831–13838. [Google Scholar]
- 19.Meyer MP, Klinman JP. Chem Phys. 2005;319:283–296. doi: 10.1016/j.chemphys.2005.05.017. [DOI] [PMC free article] [PubMed] [Google Scholar]
- 20.Olsson MH, Mavri J, Warshel A. Philos Trans R Soc London, Ser B. 2006;361:1417–1432. doi: 10.1098/rstb.2006.1880. [DOI] [PMC free article] [PubMed] [Google Scholar]
- 21.Hatcher E, Soudackov AV, Hammes-Schiffer S. J Am Chem Soc. 2007;129:187–196. doi: 10.1021/ja0667211. [DOI] [PubMed] [Google Scholar]
- 22.Mavri J, Liu H, Olsson MH, Warshel A. J Phys Chem B. 2008;112:5950–5954. doi: 10.1021/jp0758420. [DOI] [PubMed] [Google Scholar]
- 23.Barroso M, Arnaut LG, Formosinho SJ. J Phys Org Chem. 2008;21:659–665. [Google Scholar]
- 24.Meyer MP, Tomchick DR, Klinman JP. Proc Natl Acad Sci US A. 2008;105:1146–1151. doi: 10.1073/pnas.0710643105. [DOI] [PMC free article] [PubMed] [Google Scholar]
- 25.Edwards SJ, Soudackov AV, Hammes-Schiffer S. J Phys Chem B. 2010;114:6653–6660. doi: 10.1021/jp100133p. [DOI] [PMC free article] [PubMed] [Google Scholar]
- 26.Truhlar DG. J Phys Org Chem. 2010;23:660–676. [Google Scholar]
- 27.Soudackov AV, Hammes-Schiffer S. J Phys Chem Lett. 2014;5:3274–3278. doi: 10.1021/jz501655v. [DOI] [PMC free article] [PubMed] [Google Scholar]
- 28.Harshan AK, Yu T, Soudackov AV, Hammes-Schiffer S. J Am Chem Soc. 2015;137:13545–13555. doi: 10.1021/jacs.5b07327. [DOI] [PMC free article] [PubMed] [Google Scholar]
- 29.Phatak P, Venderley J, Debrota J, Li J, Iyengar SS. J Phys Chem B. 2015;119:9532–9546. doi: 10.1021/acs.jpcb.5b02385. [DOI] [PubMed] [Google Scholar]
- 30.Salna B, Benabbas A, Russo D, Champion PM. J Phys Chem B. 2017;121:6869–6881. doi: 10.1021/acs.jpcb.7b05570. [DOI] [PubMed] [Google Scholar]
- 31.Soudakov AV, Hammes-Schiffer S. Faraday Discuss. 2016;195:171–189. doi: 10.1039/c6fd00122j. [DOI] [PMC free article] [PubMed] [Google Scholar]
- 32.Borgis D, Hynes JT. Chem Phys. 1993;170:315–346. [Google Scholar]
- 33.Chruszcz M, Wlodawer A, Minor W. Biophys J. 2008;95:1–9. doi: 10.1529/biophysj.108.131789. [DOI] [PMC free article] [PubMed] [Google Scholar]
- 34.Xiang Z, Honig B. J Mol Biol. 2001;311:421–430. doi: 10.1006/jmbi.2001.4865. [DOI] [PubMed] [Google Scholar]
- 35.Trott O, Olson AJ. J Comput Chem. 2010;31:455–461. doi: 10.1002/jcc.21334. [DOI] [PMC free article] [PubMed] [Google Scholar]
- 36.Morris GM, Huey R, Lindstrom W, Sanner MF, Belew RK, Goodsell DS, Olson AJ. J Comput Chem. 2009;30:2785–2791. doi: 10.1002/jcc.21256. [DOI] [PMC free article] [PubMed] [Google Scholar]
- 37.Horitani M, Offenbacher AR, Carr CAM, Yu T, Hoeke V, Cutsail GE, III, Hammes-Schiffer S, Klinman JP, Hoffman BM. J Am Chem Soc. 2017;139:1984–1997. doi: 10.1021/jacs.6b11856. [DOI] [PMC free article] [PubMed] [Google Scholar]
- 38.Jorgensen WL, Chandrasekhar J, Madura JD, Impey RW, Klein ML. J Chem Phys. 1983;79:926–935. [Google Scholar]
- 39.Li P, Song LF, Merz KM., Jr J Chem Theory Comput. 2015;11:1645–1657. doi: 10.1021/ct500918t. [DOI] [PubMed] [Google Scholar]
- 40.Maier JA, Martinez C, Kasavajhala K, Wickstrom L, Hauser KE, Simmerling C. J Chem Theory Comput. 2015;11:3696–3713. doi: 10.1021/acs.jctc.5b00255. [DOI] [PMC free article] [PubMed] [Google Scholar]
- 41.Case DA, Cheatham TE, Darden T, Gohlke H, Luo R, Merz KM, Jr, Onufriev A, Simmerling C, Wang B, Woods RJ. J Comput Chem. 2005;26:1668–1688. doi: 10.1002/jcc.20290. [DOI] [PMC free article] [PubMed] [Google Scholar]
- 42.Götz AW, Clark MA, Walker RC. J Comput Chem. 2014;35:95–108. doi: 10.1002/jcc.23444. [DOI] [PMC free article] [PubMed] [Google Scholar]
- 43.Becke AD. J Chem Phys. 1993;98:5648–5652. [Google Scholar]
- 44.Woodcock HL, Hodošček M, Gilbert AT, Gill PM, Schaefer HF, Brooks BR. J Comput Chem. 2007;28:1485–1502. doi: 10.1002/jcc.20587. [DOI] [PubMed] [Google Scholar]
- 45.Brooks BR, Brooks CL, MacKerell AD, Nilsson L, Petrella RJ, Roux B, Won Y, Archontis G, Bartels C, Boresch S. J Comput Chem. 2009;30:1545–1614. doi: 10.1002/jcc.21287. [DOI] [PMC free article] [PubMed] [Google Scholar]
- 46.Krylov AI, Gill PM. Wiley Interdiscip Rev Comput Mol Sci. 2013;3:317–326. [Google Scholar]
- 47.Pan AC, Sezer D, Roux B. J Phys Chem B. 2008;112:3432–3440. doi: 10.1021/jp0777059. [DOI] [PMC free article] [PubMed] [Google Scholar]
- 48.Rosta E, Nowotny M, Yang W, Hummer G. J Am Chem Soc. 2011;133:8934–8941. doi: 10.1021/ja200173a. [DOI] [PMC free article] [PubMed] [Google Scholar]
- 49.Ganguly A, Thaplyal P, Rosta E, Bevilacqua PC, Hammes-Schiffer S. J Am Chem Soc. 2014;136:1483–1496. doi: 10.1021/ja4104217. [DOI] [PMC free article] [PubMed] [Google Scholar]
- 50.Souaille M, Roux BT. Comput Phys Commun. 2001;135:40–57. [Google Scholar]
- 51.Nelson MJ. Biochem. 1988;27:4273–4278. [Google Scholar]
- 52.Clark KB, Culshaw PN, Griller D, Lossing F, Simoes JM, Walton JC. J Org Chem. 1991;56:5535–5539. [Google Scholar]
- 53.Suardiaz R, Jambrina PG, Masgrau L, Gonzalez-Lafont A, Rosta E, Lluch JM. J Chem Theory Comput. 2016;12:2079–2090. doi: 10.1021/acs.jctc.5b01236. [DOI] [PubMed] [Google Scholar]
- 54.Alvarez S. Dalton Trans. 2013;42:8617–8636. doi: 10.1039/c3dt50599e. [DOI] [PubMed] [Google Scholar]
- 55.Frisch MJ, Trucks GW, Schlegel HB, Scuseria GE, Robb MA, Cheeseman JR, Scalmani G, Barone V, Mennucci B, Petersson GA, Nakatsuji H, Caricato M, Li X, Hratchian HP, Izmaylov AF, Bloino J, Zheng G, Sonnenberg JL, Hada M, Ehara M, Toyota K, Fukuda R, Hasegawa J, Ishida M, Nakajima T, Honda Y, Kitao O, Nakai H, Vreven TJAM, Jr, Peralta JE, Ogliaro F, Bearpark M, Heyd JJ, Brothers E, Kudin KN, Staroverov VN, Keith T, Kobayashi R, Normand J, Raghavachari K, Rendell A, Burant JC, Iyengar SS, Tomasi J, Cossi M, Rega N, Millam JM, Klene M, Knox JE, Cross JB, Bakken V, Adamo C, Jaramillo J, Gomperts R, Stratmann RE, Yazyev O, Austin AJ, Cammi R, Pomelli C, Ochterski JW, Martin RL, Morokuma K, Zakrzewski VG, Voth GA, Salvador P, Dannenberg JJ, Dapprich S, Daniels AD, Farkas O, Foresman JB, Ortiz JV, Cioslowski J, Fox DJ. Gaussian 09, Revision D 01. Gaussian Inc; Wallingford, CT: 2013. [Google Scholar]
- 56.Smith PE, van Gunsteren WF. J Phys Chem. 1994;98:13735–13740. [Google Scholar]
- 57.Breneman CM, Wiberg KB. J Comput Chem. 1990;11:361–373. [Google Scholar]
- 58.Soudackov A, Hammes-Schiffer S. J Chem Phys. 2000;113:2385–2396. [Google Scholar]
- 59.Soudackov A, Hatcher E, Hammes-Schiffer S. J Chem Phys. 2005;122:014505. doi: 10.1063/1.1814635. [DOI] [PubMed] [Google Scholar]
- 60.Kuznetsov A, Ulstrup J. Can J Chem. 1999;77:1085–1096. [Google Scholar]
- 61.Webb SP, Hammes-Schiffer S. J Chem Phys. 2000;113:5214–5227. [Google Scholar]
Associated Data
This section collects any data citations, data availability statements, or supplementary materials included in this article.


