

Abstract
Background
Well-tolerated, highly-effective direct antiviral agents (DAAs) for hepatitis C virus (HCV) were recently introduced. Their utilization has been limited by high cost and low access to care.
Aim
We aimed to describe the impact of DAAs on HCV treatment and cure rates.
Methods
We identified all HCV antiviral treatment regimens initiated from 1/1/1999 to 12/31/2015 (n=105,369) in the Veterans Affairs (VA) national healthcare system of the United States and determined if they resulted in sustained virologic response (SVR).
Results
HCV antiviral treatment rates were low (1,981-6,679 treatments/year) in the interferon era (1999-2010). The introduction of simeprevir and sofosbuvir in 2013 and ledipasvir/sofosbuvir and paritaprevir/ombitasvir/ritonavir/dasabuvir in 2014 were followed by dramatic increases in annual treatment rates to 9,180 in 2014 and 31,028 in 2015. The number of patients achieving SVR was 1,313 in 2010, the last year of the interferon era and increased 5.6-fold to 7,377 in 2014 and 21-fold to 28,084 in 2015. The proportion of treated patients who achieved SVR increased from 19.2% in 1999 and 36.0% in 2010 to 90.5% in 2015. Within 2015, monthly treatment rates ranged from 727 in July to 6,868 in September correlating with the availability of funds for DAAs.
Conclusion
DAAs resulted in a 21-fold increase in the number of patients achieving HCV cure. Treatment rates in 2015 were limited primarily by the availability of funds. Further increases in funding and cost reductions of DAAs occurring in 2016 suggest that the VA could cure the majority of HCV-infected Veterans in VA care within the next few years.
Keywords: Hepatitis C, antivirals, eradication
Introduction
Interferon-based antiviral regimens used to treat hepatitis C virus (HCV) infection until 2011 had low response rates, long duration, multiple side effects and several contraindications to treatment. These factors limited the number of HCV-infected patients who received treatment and even more so the number who achieved eradication of HCV, known as “sustained virologic response” (SVR). Only an estimated 5-6% of all HCV-infected persons in the United States attained SVR in the era of standard interferon and 33% at the end of the PEG-interferon era.1
A number of direct-acting antiviral agents (DAAs) for HCV have been introduced since 2011, starting with boceprevir and telaprevir, which were used in combination with interferon and ribavirin. Highly effective, interferon-free regimens became available with the introduction of simeprevir and sofosbuvir in November and December 2013 and ledipasvir/sofosbuvir (LDV/SOF) and paritaprevir/ritonavir/ombitasvir/dasabuvir (PrOD) in October and December 2014. Clinical trials of LDV/SOF and PrOD reported SVR rates exceeding 95% with well-tolerated regimens as short as 8-12 weeks in genotype 1-infected patient.2–9
The availability of DAAs raised hopes of dramatically improving HCV treatment and cure rates within the United States.10 However, treatment rates were limited by the high costs of the antiviral agents, variable coverage by medical insurance companies, limited access to HCV treatment providers and inadequate clinical capacity to treat large numbers of HCV-infected patients. Furthermore, until recently almost all payers incorporated eligibility or prioritization criteria, restricting access to or prioritizing those HCV-infected patients with more advanced liver fibrosis or extrahepatic manifestations of HCV.
The VA healthcare system is the largest provider of care for chronic HCV infection in the United States.11 In 2013, there were 174,302 patients with diagnosed HCV infection in VA care and an additional estimated 45,000 patients with undiagnosed HCV.12 We sought to determine the impact of the new DAAs on HCV treatment and cure rates in the United States Veterans Affairs (VA) healthcare system by comparing these annual rates before and after the introduction of DAAs.
On July 31, 2015, the US Congress appropriated an additional $500 million in “unrestricted” funding for HCV DAAs to be used only in August and September 2015.13 Therefore, we additionally examined monthly treatment rates during this time to assess the VA’s capacity to treat large numbers of HCV-infected patients if funding for DAAs or prioritization criteria were not limiting factors. We believe that our findings based on the VA healthcare system might be relevant and informative for other comprehensive healthcare systems.
Methods
Data Source
The Veterans Health Administration is the largest integrated healthcare system in the United States. It includes 154 medical centers and 875 ambulatory care and community-based outpatient clinics throughout the country. In 2013, 5,720,614 Veterans received VA healthcare.14 We extracted electronic medical records on all patients who received antiviral treatment from 1999-2015 using the VA Corporate Data Warehouse (CDW). The CDW is a national, continually-updated repository of data from the VA’s computerized patient records,15 including pharmacy prescriptions, patient demographics and clinical data for both inpatient and outpatient visits.
Study Population and Baseline Characteristics
We identified all HCV antiviral regimens (n=105,369 regimens among 78,947 patients) initiated in the VA during a 17-year period from 1/1/1999 to 12/31/2015. For each HCV treatment regimen, we collected baseline data including age, sex, HCV genotype, pre-treatment HCV viral load, laboratory tests and prior receipt of antiviral treatment. We also determined the presence of cirrhosis, decompensated cirrhosis, hepatocellular carcinoma, depression, PTSD, anxiety/panic disorder, bipolar disease and schizophrenia based on ICD-9 codes, previously validated in VA medical records,16–26 recorded at least twice prior to treatment initiation in any inpatient or outpatient encounter (Supplemental Table 1). For all patients, data extended backwards to 10/1/1998 to allow determination of previous antiviral treatments and past medical history and forward until 4/15/2016 to allow completion of treatments and ascertainment of SVR.
Ascertainment of Sustained Virologic Response (SVR)
We defined SVR as a serum HCV RNA viral load below the lower limit of quantification at least 12 weeks after the end of HCV treatment.27 When a viral load test was not available ≥12 weeks after the end of treatment, we calculated SVR based on a viral load performed between 4-12 weeks after the end of treatment (which accounted for an additional 5,492 SVR determinations), since recent studies have shown 98% concordance (PPV 98%; NPV 100%) between viral loads done 4 weeks and 12 weeks after the end of treatment.27
Statistical Analysis
We calculated treatment and SVR rates and their 95% CI by calendar year and clinical characteristics. Data were extracted on 4/16/2016, so patients who completed treatment after January 2016 had not accrued the requisite 12 weeks of time after the end of their treatment to determine SVR. Therefore, missing SVR values for these and earlier regimens with missing SVR data (9.6% of all regimens) were imputed using logistic regression models that included baseline predictors of SVR (HCV genotype, antiviral regimen, cirrhosis, decompensated cirrhosis, hepatocellular carcinoma, treatment naïve/experienced, age, race and gender) and treatment duration. These models were fitted separately by time period [1999-2001 (regular interferon era), 2002-2010 (pegylated interferon era), 2011-2013 (boceprevir and telaprevir era), 2014 (sofosbuvir era), 2015 (LDV/SOF + PrOD era)] given their dramatic differences in regimens and SVR rates. The number of imputations was varied from 50 to 200 resulting in estimates that were identical up to four significant digits. The model was determined to be stable and an m=50 imputations was used. Data were assumed to be missing at random. This assumption was found to be reasonable using the observed data.
Interrupted time series (ITS) analysis of trends was used to determine whether trends in treatment or cure rates that occurred after the introduction of different antiviral agents or after major funding increases were significantly different than the trend that would be expected if these changes were not introduced. The intervention impact effect was assumed to be both a level and slope change. Due to the count nature of the data, a Poisson regression model was selected. Over-dispersion was addressed by allowing variance to be proportional to the mean. Seasonality and auto-correlation were adjusted for using Fourier terms consisting of pairs of sine and cosine functions.
Analyses were performed using STATA/MP version 14 (StataCorp, College Station, TX).
Role of Funding Source
The study was funded by the VA’s Office of Research and Development, which had no role in the study’s design, conduct or reporting.
Results
Baseline Characteristics of Antiviral Treatment Recipients and Their Trends
Among 78,947 patients who initiated 105,369 regimens from 1999-2015, the average age was 56.2 ±7.7 years, 96.8% were male, 61.7% were white, 29.3% were black, 79.2%/12.0%/8.0%/0.8% had HCV genotypes 1/2/3/4 respectively, 21.5% had cirrhosis, 6.6% had decompensated cirrhosis and 1.7% had HCC prior to treatment initiation (Table 1). Noteworthy trends over time from 1999 to 2015, included a steady increase in age (51.1 to 61.2 years) and the proportion of black patients (24.4% to 36.7%). There was also an increase in the proportion of patients with cirrhosis, decompensated cirrhosis and HCC, which peaked in 2014 before declining in 2015.
Table 1.
Pre-treatment characteristics for HCV treatment regimens initiated between 1/1/1999 and 12/31/2015 by calendar year
| All years (n= 105,369) |
1999 (n= 2,016) |
2000 (n= 1,981) |
2001 (n= 2,726) |
2002 (n= 6,679) |
2003 (n= 6,665) |
2004 (n= 5,892) |
2005 (n= 5,736) |
2006 (n= 5,312) |
2007 (n= 4,877) |
2008 (n= 4,549) |
2009 (n= 4,329) |
2010 (n= 3,646) |
2011 (n= 3,244) |
2012 (n= 4,900) |
2013 (n= 2,609) |
2014 (n= 9,180) |
2015 (n= 31,028) |
|
|---|---|---|---|---|---|---|---|---|---|---|---|---|---|---|---|---|---|---|
|
Age, yrs (mean, sd) |
56.2 (7.7) |
51.1 (9.7) |
51.7 (9.5) |
51.5 (8.2) |
51.1 (6.9) |
51.0 (5.8) |
51.5 (5.9) |
52.3 (5.6) |
52.9 (5.8) |
53.6 (6.0) |
54.1 (6.0) |
54.5 (6.4) |
54.9 (6.6) |
56.1 (6.5) |
57.3 (6.5) |
57.6 (6.7) |
60.3 (6.2) |
61.2 (6.5) |
| Male (%) | 96.8 | 96.9 | 97.1 | 97.6 | 96.8 | 96.7 | 96.7 | 96.8 | 96.7 | 96.8 | 96.7 | 96.8 | 96.5 | 96.1 | 96.3 | 96.1 | 96.6 | 96.9 |
| Race/Ethnicity† (%) | ||||||||||||||||||
| White, non-Hispanic | 61.7 | 64.6 | 63.6 | 67.8 | 66.2 | 66.1 | 66.7 | 65.1 | 63.1 | 64.1 | 63.6 | 63.8 | 63.0 | 68.4 | 61.8 | 63.7 | 62.7 | 55.4 |
| Black, non-Hispanic | 29.3 | 24.4 | 24.4 | 21.6 | 24.3 | 24.8 | 23.8 | 24.6 | 26.6 | 26.8 | 27.4 | 26.8 | 27.3 | 23.4 | 28.8 | 27.9 | 27.9 | 36.7 |
| Hispanic | 7.0 | 9.0 | 9.3 | 9.0 | 7.4 | 7.1 | 7.5 | 7.9 | 8.2 | 7.0 | 6.9 | 7.6 | 7.4 | 6.6 | 7.3 | 6.0 | 7.2 | 6.2 |
| Asian, Pacific Islander, American Indian | 2.0 | 2.0 | 2.6 | 1.6 | 2.1 | 2.0 | 2.0 | 2.3 | 2.1 | 2.1 | 2.1 | 1.7 | 2.3 | 1.6 | 2.1 | 2.3 | 2.1 | 1.8 |
| HCV Genotype† (%) | ||||||||||||||||||
| Genotype 1 | 79.2 | 83.3 | 78.9 | 78.9 | 80.5 | 75.9 | 73.6 | 73.1 | 73.1 | 72.8 | 72.4 | 71.2 | 70.2 | 68.6 | 83.6 | 81.5 | 75.3 | 87.7 |
| Genotype 2 | 12.0 | 8.9 | 10.9 | 11.5 | 11.1 | 13.5 | 15.2 | 16.2 | 15.7 | 15.6 | 16.3 | 16.8 | 16.9 | 18.5 | 9.7 | 10.6 | 15.8 | 6.7 |
| Genotype 3 | 8.0 | 7.4 | 9.5 | 8.9 | 7.5 | 9.9 | 10.5 | 9.9 | 10.4 | 10.4 | 10.6 | 11.2 | 11.9 | 12.0 | 6.3 | 7.4 | 8.3 | 4.8 |
| Genotype 4 | 0.8 | 0.5 | 0.8 | 0.7 | 0.9 | 0.7 | 0.8 | 0.7 | 0.8 | 1.1 | 0.7 | 0.9 | 1.1 | 0.9 | 0.4 | 0.5 | 0.7 | 0.8 |
| Cirrhosis (%) | 21.4 | 0.4 | 6.1 | 12.0 | 12.3 | 12.3 | 14.2 | 13.9 | 16.0 | 16.9 | 15.3 | 15.3 | 17.0 | 20.7 | 25.6 | 25.2 | 46.5 | 26.7 |
| Decompensated Cirrhosis (%) | 6.6 | 0.0 | 1.9 | 4.0 | 3.3 | 4.2 | 4.7 | 4.8 | 5.1 | 5.7 | 5.0 | 4.8 | 4.7 | 5.8 | 6.2 | 7.0 | 15.6 | 7.9 |
| Hepatocellular Carcinoma (%) | 1.7 | 0.0 | 0.5 | 0.2 | 0.3 | 0.2 | 0.6 | 0.5 | 0.7 | 0.6 | 0.7 | 0.7 | 1.2 | 1.6 | 1.4 | 1.9 | 4.7 | 3.0 |
| Treatment Experienced (%) | 25.5 | 16.7 | 22.4 | 26.2 | 23.5 | 21.3 | 20.5 | 23.2 | 24.1 | 26.2 | 24.0 | 21.6 | 19.1 | 30.1 | 35.3 | 28.3 | 37.4 | 24.7 |
| FIB-4* score > 3.25 (%) |
30.8 | 89.3 | 28.8 | 25.7 | 21.6 | 21.6 | 22.4 | 22.3 | 22.7 | 23.6 | 23.0 | 24.4 | 27.7 | 30.0 | 30.1 | 31.5 | 49.8 | 34.2 |
| FIB-4* score > 2.5 (%) |
41.3 | 90.1 | 36.3 | 33.5 | 29.9 | 29.9 | 31.5 | 31.0 | 31.4 | 33.7 | 33.9 | 35.1 | 38.7 | 41.0 | 42.1 | 43.2 | 61.4 | 46.8 |
FIB-4 score52 = [age × AST]/[platelets × ALT1/2]
Race/Ethnicity and HCV Genotype are shown as proportions among those with available data. A small number had missing data as shown in Supplemental Table 3.
Trends in Annual Treatment Rates, 1999-2015
Annual treatment rates more than doubled from 2,726 in 2001 to 6,679 in 2002, the year after the introduction of pegylated interferon (Figure 1 and Supplemental Table 2). During the pegylated interferon era (2001-2010), annual treatment rates peaked at 6,679 in 2002 followed by a steady decline until 2010. The introduction of boceprevir and telaprevir in 2011, which had to be used in combination with pegylated interferon and ribavirin, led to a modest increase in annual treatments to 4,900 in 2012. This was followed by a reduction in annual number of treatments to 2,609 in 2013, the lowest number since 2000. The introduction of sofosbuvir and simeprevir at the end of 2013, was followed by a dramatic increase in annual treatments to 9,180 in 2014 followed by a larger increase to 31,028 in 2015 after the introduction of LDV/SOF and PrOD.
Figure 1.
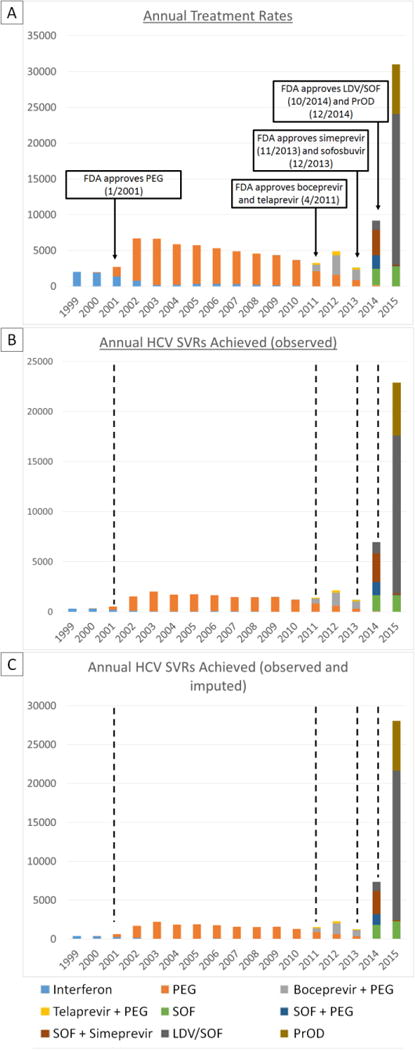
Annual HCV regimens initiated (A), achieving SVR (observed) (B) and achieving SVR (observed and imputed) (C) with eras of HCV treatment regimens marked with dashed lines. Low HCV treatment and SVR levels during the pegylated interferon era (2001-2011) were followed by modest improvements during the boceprevir and telaprevir era (2011-2013) and much larger increases during the simeprevir and sofosbuvir (2014) and LDV/SOF and PrOD eras (2015).
The regimens shown include those with and without concomitant ribavirin.
Simeprevir + PEG regimens are not shown due to insufficient number of regimens initiated
A very small number of “SOF” regimens also included additional daclatasvir, which was approved on 7/24/15 for HCV genotype 3 infection.
PEG = pegylated-interferon
SOF = sofosbuvir
LDV/SOF = ledipasvir/sofosbuvir
PrOD = paritaprevir/ritonavir/ombitasvir/dasabuvir
Trends in Annual Treatment Rates Among Traditionally “Difficult-to-Treat” Subgroups
Increases in annual treatment rates that occurred between the end of the pegylated interferon era in 2010 and 2015 were even more pronounced among patients with cirrhosis (13.4-fold increase), decompensated cirrhosis (14.3-fold increase), genotype 1 HCV (11.3-fold increase), hepatocellular carcinoma (20.6-fold increase) and age >60 yrs (28.5-fold increase) compared to an 8.5-fold increase among all patients (Figure 2 and Supplemental Table 3).
Figure 2.
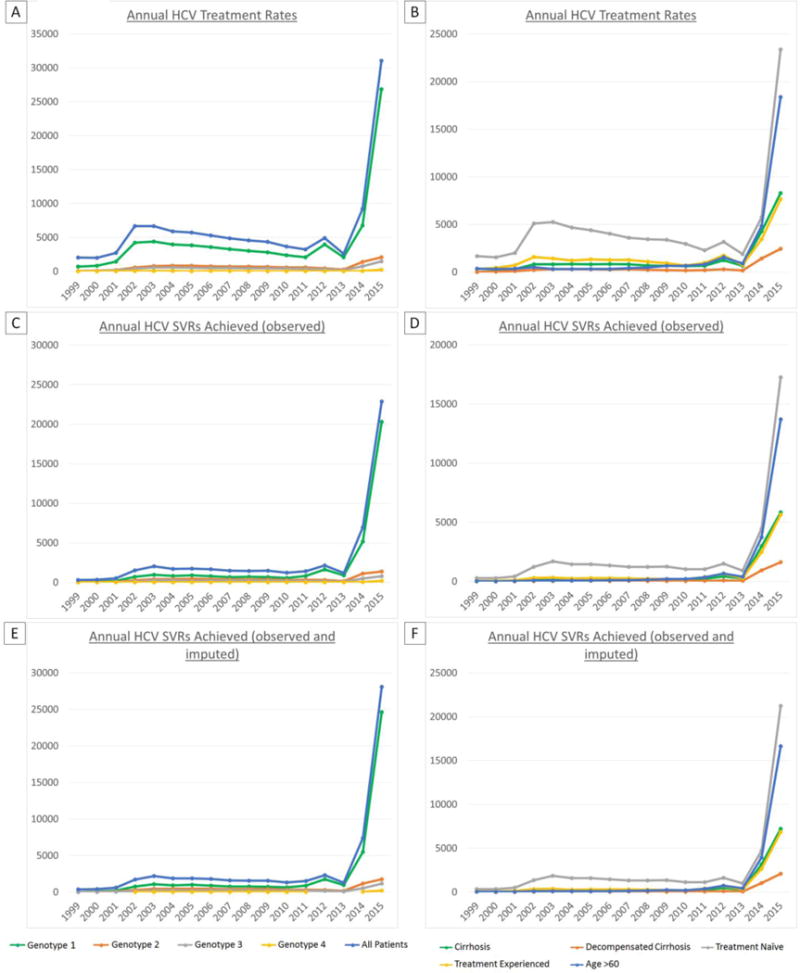
Annual HCV regimens initiated by clinical characteristics (A), regimens achieving SVR by clinical characteristics using observed SVR data (B) or observed and imputed SVR data (C). Treatment and cure rates increased substantially in all patient subgroups, including previously “difficult-to-treat” patients such as those with cirrhosis, but the most profound increase occurred in older patients (age >60 years).
Annual Trends in SVR Rates
SVR rates (observed or imputed) increased progressively from <25% in the regular interferon era (1999-2001) to 22-37% in the pegylated interferon era (2001-2010), 50% in the boceprevir and telaprevir era (2011-2013), 80.4% in the simeprevir and sofosbuvir era (2014) and 90.5% in the LDV/SOF and PrOD era (2015) (Figure 3a, Supplemental Table 4). These increases in SVR rates were even more pronounced in traditionally “difficult-to-treat” patients such as those with cirrhosis (11.0 to 87.0%), decompensated cirrhosis (14.6 to 85.2%), treatment-experienced patients (16.4 to 89.3%) and genotype 1-infected patients (1.3 to 91.7%). The gap in SVR rates between these difficult-to-treat populations and treatment naïve (91.3%) and non-cirrhotic patients (92.2%) was mostly bridged by 2015 (Figure 3b and Supplemental Tables 5 and 6).
Figure 3.
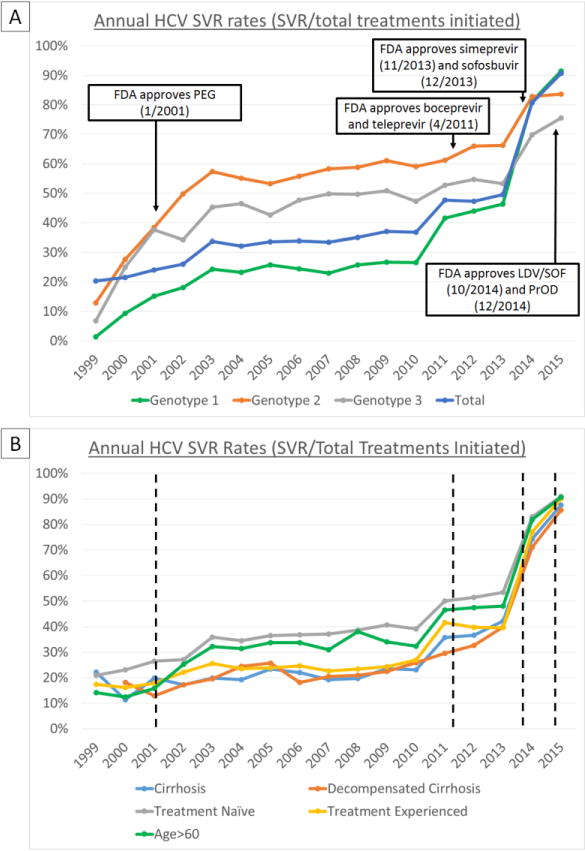
Annual SVR rates by HCV genotype (A) and clinical characteristics (B) with HCV treatment eras demarcated with dashed lines. With each successive introduction of new HCV treatment regimens, SVR rates increased from <25% in the PEG-interferon era (2001-2010) to approximately 50% in 2011-2013 (boceprevir & teleprevir era), 80% in 2014 (simeprevir & SOF era), and >90% in 2015 (LDV/SOF & PrOD era). “Difficult-to-treat” groups such as treatment-experienced patients, and those with cirrhosis or decompensated cirrhosis had lower SVR rates prior to 2014-2015. In 2014-2015, SVR rates for these groups were similar to those of lower risk groups, such as treatment naïve patients.
SVR rates for 2015 only reflect rates from the first half of the year (January-June), due to the large number of patients missing SVR data in the latter half of 2015 (insufficient time elapsed until data pull in April 2016)
PEG = pegylated-interferon,
SOF = sofosbuvir,
LDV/SOF = ledipasvir/sofosbuvir,
PrOD = paritaprevir/ritonavir/ombitasvir/dasabuvir
Annual Trends in Number of Patients Achieving SVR
Among all 105,369 regimens in 78,947 patients initiated from 1999-2015, 50,079 resulted in observed SVR and 57,445 in observed or imputed SVR. Annual SVRs (observed or imputed) increased from 387-394 in the regular IFN era (1999-2000) to 618-2,204 in the pegylated interferon era (2001-2010), to 1,273-2,296 in the boceprevir/telaprevir era (2011-2013), to 7,377 in the simeprevir/sofosbuvir era (2014), to 28,084 in the LDV/SOF and PrOD era (2015) (Figure 2, Supplemental Tables 7 and 8). The number of patients cured in 2015 (n=28,084) represented almost half of all patients cured in the entire 17-year period (n=57,445). Increases in annual SVRs from 2010 to 2015 were even greater among patients with cirrhosis (52.3-fold), decompensated cirrhosis (48.6-fold), genotype 1 HCV (39.1-fold), HCC (48.5-fold) and age >60 years (80.7-fold) compared to 21.4-fold among all patients (Figure 2 and Supplemental Tables 9 and 10).
Impact of Funding Availability on Antiviral Treatment Rates
In fiscal year (FY) 2015, which spanned October 2014 to September 2015, the VA allocated $696 million to offset the costs of HCV DAAs.28 We observed a 9-fold fluctuation in monthly treatment rates during FY 2015. This seemed to correlate mostly with the availability of funds for DAAs (Figure 4). Monthly rates increased rapidly from 1,135 treatments/month in October 2014, when LDV/SOF and PrOD became FDA approved, to 3,413 treatments/month in March 2015. This was followed by a precipitous decline from March 2015 to July 2015 (762 treatments/month) as high treatment rates and high costs of LDV/SOF and PrOD depleted funds in many facilities. On July 31, 2015, the US Congress passed the Surface Transportation and Veterans Health Choice Improvement Act, providing an additional $500 million in “unrestricted” funding for DAAs through the end of September 2015 (i.e. the end of FY 2015).13 This was followed by a dramatic increase in treatment rates from 762 in July to 4,416 in August and 6,959 in September 2015. With the beginning of a new budget for FY 2016 in October 2015 and the reintroduction of Clinical Priority Criteria (e.g. advanced fibrosis or extrahepatic manifestations of HCV) for treatment, monthly treatment rates subsequently dropped to 1,386/month.
Figure 4.
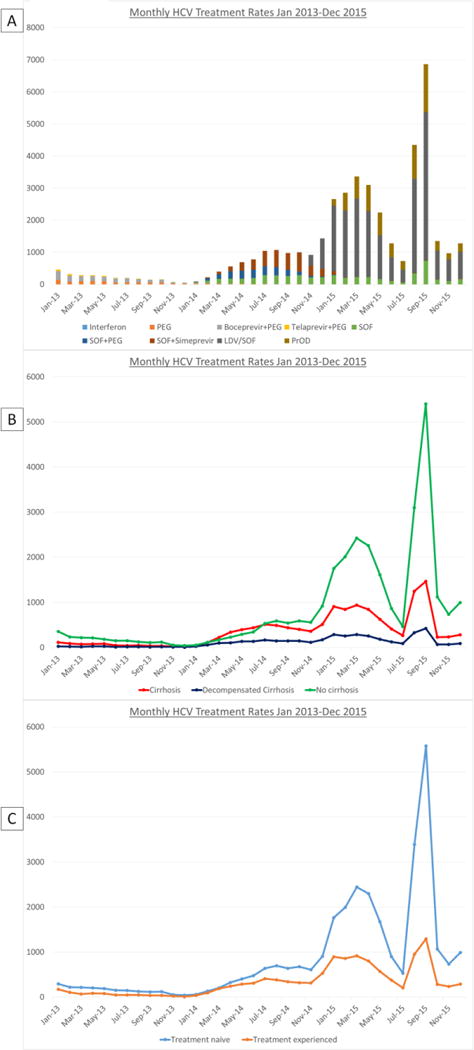
Monthly HCV regimens initiated from January 2013 to December 2015 by HCV regimen (A) and clinical characteristics (B and C). After increased funding became available in October 2014, monthly rates increased dramatically from October 2014 to March 2015. After funding began to become exhausted, treatment numbers declined, particularly among patients without cirrhosis. Congress passed legislation for HCV treatment in August and September 2015, followed by a dramatic increase in treatment initiations, particularly among patients without cirrhosis.
PEG = pegylated-interferon,
SOF = sofosbuvir,
LDV/SOF = ledipasvir/sofosbuvir,
PrOD = paritaprevir/ritonavir/ombitasvir/dasabuvir
Interrupted Time Series (ITS) Analysis of Trends in Treatment and Cure Rates
ITS analyses confirmed that the increases in treatment and cure rates that occurred after the introduction of pegylated interferon (2001), boceprevir and telaprevir (4/2011), simeprevir and sofosbuvir (11/2013 and 12/2013) and LDV/SOF and PrOD (10/2014 and 12/2014) and after the passing of the Surface Transportation and Veterans Health Choice Improvement Act by the US Congress (8/2015), shown in Figures 1, 2 and 4, were highly statistically significant (all p<0.05).
Discussion
Our results demonstrate a dramatic transformation in HCV care as more effective and tolerable interferon-free DAAs have emerged. Over the last two years of our study period (2014-15), the VA healthcare system has significantly scaled up its provision of HCV antiviral treatment. SVR rates in our cohort increased steadily from 19.2% in 1999 to 36.0% in 2010 before a remarkable increase to 90.5% in 2015, including 91.7% among genotype 1-infected patients, which is comparable to SVR rates reported in clinical trials of LDV/SOF (94-99%)2–4 and PrOD (95-100%).5–9 As a result, the number of patients achieving SVR increased 21-fold from 1,313 in 2010 to an estimated 28,084 in 2015. The number of patients cured in 2015 (n=28,084) represented almost half of all patients cured in the entire 17-year period (n=57,445). Our results suggest that with increased funding and reduced cost of DAAs, both of which already occurred in January 2016, the VA will have the ability to successfully treat the majority of the remaining 124,662 HCV-infected Veterans who were in VA care as of January 2016 within the next few years.29
Several factors likely contributed to the remarkable increase in HCV treatment and cure rates that occurred in 2014 and 2015. Most importantly, the introduction of interferon-free DAAs vastly increased the VA population eligible for and willing to undergo antiviral treatment. Second, given the high relative cost of DAAs, increases in VA funding were critical. Third, the VA embraced innovative care models including the use of teleconsultation for HCV treatment.30 Through the Specialty Care Access Network-Extension for Community Healthcare Outcomes (SCAN-ECHO) program, which allows physicians, nurses and pharmacists to get teaching and feedback through videoconferencing from HCV experts, median time from diagnosis to treatment has decreased from more than 2 years to 6 months.31 Finally, the VA used existing electronic databases to identify and coordinate care for HCV-infected Veterans, employed aggressive screening practices for HCV and encouraged local facilities to set ambitious treatment goals. These goals were facilitated by a national integrated hepatitis C program, which oversees and supports dedicated hepatitis C teams at every VA facility.32
Although a record number of highly effective antiviral regimens were prescribed in 2015 (n=31,028), this still represented only a small proportion of all HCV-infected patients in VA care. The number of patients who received HCV antiviral treatment could, in theory, be limited by the availability of funds for DAAs, the cost of DAAs, access to experienced treatment providers, identification and linkage to care of eligible HCV-infected patients and willingness of patients to undergo treatment. The 9-fold variation in monthly treatment rates in FY 2015 related to availability of DAA funding suggests that funding for HCV treatment was the most important determinant of treatment rates in 2015 (Figure 4).
While the increases in HCV treatment and cure rates in 2014 and 2015 were impressive, there are reasons to believe that these rates will increase even further in coming years in the VA. First, in January 2016, the US Congress approved $1.5 billion for HCV DAA costs in the VA in FY 2016, doubling the funding from FY 2015.33 Second, the VA was able to purchase LDV/SOF and PrOD in 2016 at approximately half the price paid in 2015.31, 34 Third, the FDA approval of additional antiviral agents including daclatasvir (approved 7/24/2015), elbasvir/grazoprevir (approved 01/28/16) and velpatasvir/sofusbuvir (approved 6/28/2016) will lead to increased treatment and cure rates, particularly for genotype 2 and 3-infected patients who have fewer treatment options and lower SVR rates than genotype 1-infected patients. Finally, the VA employed prioritization criteria until February 2016, encouraging facilities and providers to give priority to the treatment of patients with advanced fibrosis or cirrhosis, those likely to have rapid progression of fibrosis and those with extrahepatic manifestations of HCV.35 However, as of February 2016, the VA removed all HCV treatment prioritization criteria and encouraged treatment of all patients, while continuing to emphasize aggressive outreach to patients with advanced fibrosis or cirrhosis.36 This should further increase treatment rates and is in stark contrast to most healthcare systems, state Medicaid programs and insurance carriers in the US, which still restrict access to DAAs based on severity of liver disease. Following the VA’s lead, state Medicaid programs in New York, Washington, Delaware, Florida and Massachusetts announced the removed restrictions on the coverage of DAAs. Also the AASLD Guidance documents, which in 2015 stated that it was “most appropriate to treat those at greatest risk of disease complications before treating those with less advanced disease,” were changed in 2016 stating that “treatment is recommended for all patients with chronic HCV infection.”37
Questions have been raised about the feasibility of large-scale HCV treatment efforts given the high costs of new HCV medications.38 Some have concluded that while eliminating chronic HCV infection is possible, the required universal access to DAAs is not currently feasible.39 Yet many of the obstacles of large-scale HCV treatment are not shared by the VA. It is a large, federally funded healthcare system with the ability to negotiate lower medication prices, offer DAAs to patients for free or for a nominal co-pay, obtain influxes of funding in response to demand for DAAs and identify all HCV-diagnosed patients using its comprehensive national electronic medical records. Given these advantages and our data until 2015, the possibility of near universal cure of HCV appears realizable within the VA population. Considering that HCV infection is the most common cause of cirrhosis and liver cancer in the VA and the United States,21 the benefits of SVR are long-lasting40 and that HCV clearance reduces the risk of liver cancer by 76% and all-cause mortality by 50%, the potential public health benefits of large-scale HCV treatment are great.41–46 In addition, a recent cost-effectiveness analysis reported that DAAs must cost $47,000 per treatment course to achieve incremental cost-effectiveness ratio of $50,000 per QALY for patients with no fibrosis,47 suggesting that it would be cost effective or even cost saving48 for the VA to treat all HCV-infected Veterans.47 Another recent cost-effectiveness analysis reported that, using wholesale acquisition costs, all-oral DAA regimens such as LDV/SOF were associated with the lowest yearly costs per SVR and was the most cost-effective option in patients with genotype 1 infection.49
This study has a few potential limitations. SVR values were missing in 9.6% of all patients, many of whom initiated antiviral treatment in the latter half of 2015 and had not yet accumulated sufficient follow-up time to ascertain SVR (Supplemental Table 11). Missing SVR values were imputed using era-specific logistic regression models that included multiple baseline predictors of SVR as well as duration of treatment and antiviral regimen, which increases confidence that estimated SVR rates are accurate. The magnitude of increases in treatment and cure rates that we report in the VA may not be directly generalizable to the non-Veteran US population for many of the previously mentioned reasons including that some payers have introduced prior authorization rules limiting HCV treatment to those with advanced liver fibrosis.50, 51 Although we report dramatic increases in treatment rates temporally related to the introduction of DAAs and to the availability of funding for DAAs especially in 2015 (Figure 4), our study was not designed to formally evaluate other factors that may influence treatment rates such as staffing, infrastructure, administration, training, identification of patients and linkage to care. With the funding increases and DAA price reductions that occurred in 2016, such factors may very well become the limiting factors determining treatment rates in the near future.
In conclusion, the VA health care system has dramatically increased the number of HCV treatments initiated and resulting instances of SVR in 2015. The acceleration in treatment provision, particularly in August and September 2015, demonstrates the abilities of the VA’s existing HCV treatment infrastructure when sufficient funding for DAAs is available. These results raise the specter of near complete eradication of HCV within the VA system, which given the 124,662 VA patients with diagnosed HCV, would substantially reduce the burden of HCV within the entire country and prevent tens of thousands of deaths.
Supplementary Material
Acknowledgments
Declaration of Funding Sources
The study was funded by a Merit Review grant (I01CX001156), Clinical Science Research and Development, Office of Research and Development, Veterans Affairs (GNI).
Role of Funding Source
The funding source played no role in study design, collection, analysis or interpretation of data.
Footnotes
Declaration of Personal Interests
None
Disclaimer
The contents do not represent the views of the U.S. Department of Veterans Affairs or the United States Government.
Authors’ Contributions and Authorship Statement
All authors approved the final version of the manuscript
George Ioannou is the guarantor of this paper.
George Ioannou: Study concept and design, acquisition of data, statistical analysis and interpretation of data, drafting of the manuscript, critical revision of the manuscript, obtained funding.
Pamela Green: Study design, analysis of data.
Kristin Berry: Study design, analysis of data, critical revision of manuscript.
Andrew Moon: Study design, drafting of the manuscript, critical revision of the manuscript.
References
- 1.Holmberg SD, Spradling PR, Moorman AC, et al. Hepatitis C in the United States. N Engl J Med. 2013;368:1859–61. doi: 10.1056/NEJMp1302973. [DOI] [PMC free article] [PubMed] [Google Scholar]
- 2.Afdhal N, Zeuzem S, Kwo P, et al. Ledipasvir and sofosbuvir for untreated HCV genotype 1 infection. N Engl J Med. 2014;370:1889–98. doi: 10.1056/NEJMoa1402454. [DOI] [PubMed] [Google Scholar]
- 3.Afdhal N, Reddy KR, Nelson DR, et al. Ledipasvir and sofosbuvir for previously treated HCV genotype 1 infection. N Engl J Med. 2014;370:1483–93. doi: 10.1056/NEJMoa1316366. [DOI] [PubMed] [Google Scholar]
- 4.Kowdley KV, Gordon SC, Reddy KR, et al. Ledipasvir and sofosbuvir for 8 or 12 weeks for chronic HCV without cirrhosis. N Engl J Med. 2014;370:1879–88. doi: 10.1056/NEJMoa1402355. [DOI] [PubMed] [Google Scholar]
- 5.Feld JJ, Kowdley KV, Coakley E, et al. Treatment of HCV with ABT-450/r-ombitasvir and dasabuvir with ribavirin. N Engl J Med. 2014;370:1594–603. doi: 10.1056/NEJMoa1315722. [DOI] [PubMed] [Google Scholar]
- 6.Ferenci P, Bernstein D, Lalezari J, et al. ABT-450/r-ombitasvir and dasabuvir with or without ribavirin for HCV. N Engl J Med. 2014;370:1983–92. doi: 10.1056/NEJMoa1402338. [DOI] [PubMed] [Google Scholar]
- 7.Zeuzem S, Jacobson IM, Baykal T, et al. Retreatment of HCV with ABT-450/r-ombitasvir and dasabuvir with ribavirin. N Engl J Med. 2014;370:1604–14. doi: 10.1056/NEJMoa1401561. [DOI] [PubMed] [Google Scholar]
- 8.Andreone P, Colombo MG, Enejosa JV, et al. ABT-450, ritonavir, ombitasvir, and dasabuvir achieves 97% and 100% sustained virologic response with or without ribavirin in treatment-experienced patients with HCV genotype 1b infection. Gastroenterology. 2014;147:359–365 e1. doi: 10.1053/j.gastro.2014.04.045. [DOI] [PubMed] [Google Scholar]
- 9.Poordad F, Hezode C, Trinh R, et al. ABT-450/r-ombitasvir and dasabuvir with ribavirin for hepatitis C with cirrhosis. N Engl J Med. 2014;370:1973–82. doi: 10.1056/NEJMoa1402869. [DOI] [PubMed] [Google Scholar]
- 10.Hasin DS, Saha TD, Kerridge BT, et al. Prevalence of Marijuana Use Disorders in the United States Between 2001-2002 and 2012-2013. JAMA Psychiatry. 2015;72:1235–42. doi: 10.1001/jamapsychiatry.2015.1858. [DOI] [PMC free article] [PubMed] [Google Scholar]
- 11.Ioannou GN, Beste LA, Chang MF, et al. Effectiveness of Sofosbuvir, Ledipasvir/Sofosbuvir, or Paritaprevir/Ritonavir/Ombitasvir and Dasabuvir Regimens for Treatment of Patients With Hepatitis C in the Veterans Affairs National Healthcare System. Gastroenterology. 2016 doi: 10.1053/j.gastro.2016.05.049. [DOI] [PMC free article] [PubMed] [Google Scholar]
- 12.Beste LA, Ioannou GN. Prevalence and Treatment of Chronic Hepatitis C Virus Infection in the US Department of Veterans Affairs. Epidemiol Rev. 2015;37:131–43. doi: 10.1093/epirev/mxu002. [DOI] [PubMed] [Google Scholar]
- 13.H.R.3236 - Surface Transportation and Veterans Health Care Choice Improvement Act of 2015. 2015 [Google Scholar]
- 14.National Center for Veterans Analysis and Statistics. Number of Veteran Patients by Healthcare Priority Group: FY 2000 to FY 2013. Available at: http://www.va.gov/vetdata/Utilization.asp (accessed 9/9/2014)
- 15.http://vaww.vinci.med.va.gov/vincicentral/overview.aspx Last accessed 6/1/2012
- 16.Kramer JR, Davila JA, Miller ED, et al. The validity of viral hepatitis and chronic liver disease diagnoses in Veterans Affairs administrative databases. Aliment Pharmacol Ther. 2008;27:274–82. doi: 10.1111/j.1365-2036.2007.03572.x. [DOI] [PubMed] [Google Scholar]
- 17.Kramer JR, Giordano TP, Souchek J, et al. The effect of HIV coinfection on the risk of cirrhosis and hepatocellular carcinoma in U.S. veterans with hepatitis C. Am J Gastroenterol. 2005;100:56–63. doi: 10.1111/j.1572-0241.2005.40670.x. [DOI] [PubMed] [Google Scholar]
- 18.Ioannou GN, Splan MF, Weiss NS, et al. Incidence and Predictors of Hepatocellular Carcinoma in Patients With Cirrhosis. Clin Gastroenterol Hepatol. 2007;5:938–945. doi: 10.1016/j.cgh.2007.02.039. [DOI] [PubMed] [Google Scholar]
- 19.Davila JA, Henderson L, Kramer JR, et al. Utilization of surveillance for hepatocellular carcinoma among hepatitis C virus-infected veterans in the United States. Ann Intern Med. 2011;154:85–93. doi: 10.7326/0003-4819-154-2-201101180-00006. [DOI] [PubMed] [Google Scholar]
- 20.Ioannou GN, Bryson CL, Weiss NS, et al. The prevalence of cirrhosis and hepatocellular carcinoma in patients with human immunodeficiency virus infection. Hepatology. 2013;57:249–57. doi: 10.1002/hep.25800. [DOI] [PubMed] [Google Scholar]
- 21.Beste LA, Leipertz SL, Green PK, et al. Trends in Burden of Cirrhosis and Hepatocellular Carcinoma by Underlying Liver Disease in US Veterans, 2001-2013. Gastroenterology. 2015;149:1471–1482 e5. doi: 10.1053/j.gastro.2015.07.056. [DOI] [PubMed] [Google Scholar]
- 22.Kramer JR, Kanwal F, Richardson P, et al. Importance of patient, provider, and facility predictors of hepatitis C virus treatment in veterans: a national study. Am J Gastroenterol. 2011;106:483–91. doi: 10.1038/ajg.2010.430. [DOI] [PubMed] [Google Scholar]
- 23.Beste LA, Ioannou GN, Larson MS, et al. Predictors of early treatment discontinuation among patients with genotype 1 hepatitis C and implications for viral eradication. Clin Gastroenterol Hepatol. 2010;8:972–8. doi: 10.1016/j.cgh.2010.07.012. [DOI] [PubMed] [Google Scholar]
- 24.Backus LI, Boothroyd DB, Phillips BR, et al. Predictors of response of US veterans to treatment for the hepatitis C virus. Hepatology. 2007;46:37–47. doi: 10.1002/hep.21662. [DOI] [PubMed] [Google Scholar]
- 25.Kanwal F, Hoang T, Kramer JR, et al. Increasing Prevalence of HCC and Cirrhosis in Patients With Chronic Hepatitis C Virus Infection. Gastroenterology. 2011;140:1182–1188 e1. doi: 10.1053/j.gastro.2010.12.032. [DOI] [PMC free article] [PubMed] [Google Scholar]
- 26.Miller DR, Safford MM, Pogach LM. Who has diabetes? Best estimates of diabetes prevalence in the Department of Veterans Affairs based on computerized patient data. Diabetes Care. 2004;27(Suppl 2):B10–21. doi: 10.2337/diacare.27.suppl_2.b10. [DOI] [PubMed] [Google Scholar]
- 27.Yoshida EM, Sulkowski MS, Gane EJ, et al. Concordance of sustained virological response 4, 12, and 24 weeks post-treatment with sofosbuvir-containing regimens for hepatitis C virus. Hepatology. 2015;61:41–5. doi: 10.1002/hep.27366. [DOI] [PubMed] [Google Scholar]
- 28.Affairs UDoV. VA Expands Hepatitis C Drug Treatments. Vol. 2016. Washington, D.C: 2016. [Google Scholar]
- 29.Affairs UDoV. Veterans Health Administration Patient Care Services, Population Health Services. 2016 [Google Scholar]
- 30.Arora S, Thornton K, Murata G, et al. Outcomes of treatment for hepatitis C virus infection by primary care providers. N Engl J Med. 2011;364:2199–207. doi: 10.1056/NEJMoa1009370. [DOI] [PMC free article] [PubMed] [Google Scholar]
- 31.Graham J. VA Extends New Hepatitis C Drugs to All Veterans in Its Health System. JAMA. 2016;316:913–5. doi: 10.1001/jama.2016.8669. [DOI] [PubMed] [Google Scholar]
- 32.U.S. Department of Veterans Affairs. State of Care for Veterans with Chronic Hepatitis C. Washington, DC: US Department of Veterans Affairs; 2014. [Google Scholar]
- 33.Rockey DC. Gastrointestinal evaluation for premenopausal women with iron deficiency anemia: what is appropriate? [letter; comment] American. 1998;105:356–7. doi: 10.1016/s0002-9343(98)00270-8. [DOI] [PubMed] [Google Scholar]
- 34.U.S. Department of Veterans Affairs. Study may temper expectations for new hepatitis C drug. Vol. 2016. Washington DC: 2015. Available at: http://www.research.va.gov/currents/0915-3.cfm. [Google Scholar]
- 35.U.S. Department of Veterans Affairs. Initiation of Hepatitis C Virus (HCV) Treatment: Protocol for Prioritization. Vol. 2016. Washington DC: 2015. Available at: http://www.hepatitis.va.gov/pdf/provision-HCV-treatment-attachment-b.pdf. [Google Scholar]
- 36.U.S. Department of Veterans Affairs. Hepatitis C Virus (HCV) Funding and Prioritization Status Update. Vol. 2016. Washington DC: 2016. Available at: http://www.hepatitis.va.gov/pdf/choice-prioritization-update.pdf. [Google Scholar]
- 37.HCV Guidance: Recommendations for Testing, Managing, and Treating Hepatitis C. AASLD and IDSA; 2016. Available at http://www.hcvguidelines.org. Last accessed 01/16/2017. [Google Scholar]
- 38.Ward JW, Mermin JH. Simple, Effective, but Out of Reach? Public Health Implications of HCV Drugs. N Engl J Med. 2015;373:2678–80. doi: 10.1056/NEJMe1513245. [DOI] [PubMed] [Google Scholar]
- 39.Strom BL, Ba GJ, editors. Committee on a National Strategy for the Elimination of Hepatitis B and C; Board on Population Health and Public Health Practice; Health and Medicine Division; National Academies of Sciences E. Eliminating the Public Health Problem of Hepatitis B and C in the United States: Phase One Report (2016) 2016. [PubMed] [Google Scholar]
- 40.Koh C, Heller T, Haynes-Williams V, et al. Long-term outcome of chronic hepatitis C after sustained virological response to interferon-based therapy. Aliment Pharmacol Ther. 2013;37:887–94. doi: 10.1111/apt.12273. [DOI] [PMC free article] [PubMed] [Google Scholar]
- 41.Veldt BJ, Heathcote EJ, Wedemeyer H, et al. Sustained virologic response and clinical outcomes in patients with chronic hepatitis C and advanced fibrosis. Ann Intern Med. 2007;147:677–84. doi: 10.7326/0003-4819-147-10-200711200-00003. [DOI] [PubMed] [Google Scholar]
- 42.van der Meer AJ, Veldt BJ, Feld JJ, et al. Association between sustained virological response and all-cause mortality among patients with chronic hepatitis C and advanced hepatic fibrosis. JAMA. 2012;308:2584–93. doi: 10.1001/jama.2012.144878. [DOI] [PubMed] [Google Scholar]
- 43.Morgan RL, Baack B, Smith BD, et al. Eradication of hepatitis C virus infection and the development of hepatocellular carcinoma: a meta-analysis of observational studies. Ann Intern Med. 2013;158:329–37. doi: 10.7326/0003-4819-158-5-201303050-00005. [DOI] [PubMed] [Google Scholar]
- 44.Ghany MG, Nelson DR, Strader DB, et al. An update on treatment of genotype 1 chronic hepatitis C virus infection: 2011 practice guideline by the American Association for the Study of Liver Diseases. Hepatology. 2011;54:1433–44. doi: 10.1002/hep.24641. [DOI] [PMC free article] [PubMed] [Google Scholar]
- 45.Backus LI, Boothroyd DB, Phillips BR, et al. A sustained virologic response reduces risk of all-cause mortality in patients with hepatitis C. Clin Gastroenterol Hepatol. 2011;9:509–516 e1. doi: 10.1016/j.cgh.2011.03.004. [DOI] [PubMed] [Google Scholar]
- 46.Poynard T, McHutchison J, Manns M, et al. Impact of pegylated interferon alfa-2b and ribavirin on liver fibrosis in patients with chronic hepatitis C. Gastroenterology. 2002;122:1303–13. doi: 10.1053/gast.2002.33023. [DOI] [PubMed] [Google Scholar]
- 47.Rein DB, Wittenborn JS, Smith BD, et al. The cost-effectiveness, health benefits, and financial costs of new antiviral treatments for hepatitis C virus. Clin Infect Dis. 2015;61:157–68. doi: 10.1093/cid/civ220. [DOI] [PMC free article] [PubMed] [Google Scholar]
- 48.Chhatwal J, Chen Q, Kanwal F. Why We Should Be Willing to Pay for Hepatitis C Treatment. Clin Gastroenterol Hepatol. 2015;13:1711–3. doi: 10.1016/j.cgh.2015.06.005. [DOI] [PMC free article] [PubMed] [Google Scholar]
- 49.Younossi ZM, Park H, Saab S, et al. Cost-effectiveness of all-oral ledipasvir/sofosbuvir regimens in patients with chronic hepatitis C virus genotype 1 infection. Aliment Pharmacol Ther. 2015;41:544–63. doi: 10.1111/apt.13081. [DOI] [PubMed] [Google Scholar]
- 50.Do A, Mittal Y, Liapakis A, et al. Drug Authorization for Sofosbuvir/Ledipasvir (Harvoni) for Chronic HCV Infection in a Real-World Cohort: A New Barrier in the HCV Care Cascade. PLoS One. 2015;10:e0135645. doi: 10.1371/journal.pone.0135645. [DOI] [PMC free article] [PubMed] [Google Scholar]
- 51.Barua S, Greenwald R, Grebely J, et al. Restrictions for Medicaid Reimbursement of Sofosbuvir for the Treatment of Hepatitis C Virus Infection in the United States. Ann Intern Med. 2015;163:215–23. doi: 10.7326/M15-0406. [DOI] [PubMed] [Google Scholar]
- 52.Vallet-Pichard A, Mallet V, Nalpas B, et al. FIB-4: an inexpensive and accurate marker of fibrosis in HCV infection. comparison with liver biopsy and fibrotest Hepatology. 2007;46:32–6. doi: 10.1002/hep.21669. [DOI] [PubMed] [Google Scholar]
Associated Data
This section collects any data citations, data availability statements, or supplementary materials included in this article.