

Abstract
Objective
We assessed mobility disability trajectories before death in a large sample of very old adults using two analytic approaches to determine how well they correspond.
Design
Decedent sample from the Health, Aging and Body Composition Study (Health ABC). Data were collected between 1997 and 2015.
Setting
A population-based sample of 3075 participants, randomly selected from well-functioning White Medicare beneficiaries and all African American community residents meeting age criteria (70–79 years) in Pittsburgh, PA, and Memphis, TN.
Participants
Of the 1991 participants who died by the end of the study, 1410 were interviewed for three years prior to death, including an interview six months before dying.
Exposures
Participants were interviewed in person or by phone at least every six months throughout the study.
Measurements
We analyzed self-reported mobility collected prospectively at six month intervals during the last three years of life. We derived trajectories in two ways: first by averaging decline within decedent groups pre-specified by clinical conditions and, second, by estimating trajectory models using maximum-likelihood semiparametric modeling.
Results
Classification by clinical conditions (sudden death, terminal, organ failure and frailty) accounted for 98% of decedents and produced groups with different characteristics. Five disability trajectories were identified: late decline, progressive disability, moderate disability, early decline, and persistent disability. Disability trajectory and clinical condition grouping both confirmed previous research but were only marginally related.
Conclusions
Derived disability trajectories and grouping by clinical conditions both provide useful information about different facets of the end-of-life experience. The lack of fit between them suggests a need for greater attention to heterogeneity in disability in the period before death.
Keywords: end of life, trajectories, disability, mobility, functional decline
INTRODUCTION
In the 1960s, sociologists Glaser and Strauss observed patients dying in a hospital setting and described different trajectories of dying: abrupt, surprise deaths; expected deaths (both short-term and lingering); and entry-reentry deaths1. A graphical representation of these ideas was included in the Institute of Medicine’s 1997 report ‘Approaching Death’2 and clinicians widely accepted the scheme as congruent with their own experience. Our early research provided empirical support for the classification scheme3,4. However, more recent work has challenged the usefulness of clinical groupings, using latent trajectory modeling of disability to argue that the course of disability in the last year of life does not follow a predictable pattern based on the condition leading to death5. We conducted a head-to-head comparison of the two approaches using the same data from a single sample of decedents to determine the degree to which previous findings were the result of approach rather than decedent characteristics.
METHODS
Sample
We derived our sample from the Health, Aging and Body Composition (Health ABC) panel study. Participants were recruited by mail in 1997–1998 from a random sample of White Medicare beneficiaries and all African American community residents in Pittsburgh and Memphis who met the age criteria. At baseline, the 3,075 participants were aged 70–79 and met the following eligibility criteria: no difficulty walking one-quarter of a mile or walking up 10 steps, no difficulty performing mobility-related activities of daily living (ADLs), no life-threatening cancers with active treatment within the past 3 years, and no plans to move from the study area for the next 3 years. The institutional review boards at the University of Pittsburgh, University of Tennessee Health Science Center, and University of California at San Francisco approved the study protocol, and written informed consent was obtained from all participants. At baseline, the cohort was 48.4% male and 41.6% African American. Background on the cohort is available at https://healthabc.nia.nih.gov.
By the completion of Year 17 of the study, 1991 participants were identified as deceased. Of these, 1555 had been interviewed six months prior to dying Our final analytic sample comprised the 1410 of those who died in Year 4 of the study or later, allowing three years of data for assessment of disability trajectories. As Table 1 indicates, our analytic sample was very similar to the full set of decedents.
Table 1.
Decedent Characteristics by Clinical Condition and Latent Trajectory Groups
| variable | Decedents | Age at death | Female | African American | Chronic Conditions* | Died in hospital | Died in nursing home |
|---|---|---|---|---|---|---|---|
| n (%) | median | % | % | n (SD) | % | % | |
| All decedents | 1991 | 84 | 46.6 | 43.6 | 2.5 (1.3) | 36.5 | 27.0 |
| With 3 years of data | 1410 (70.8) | 85 | 46.9 | 40.7 | 2.5 (1.3) | 35.7 | 26.6 |
| assigned trajectory (n=1410) | |||||||
| sudden | 82 (5.8) | 84 | 47.7 | 43.9 | 1.2 (.65) | 52.4 | 9.8 |
| terminal | 398 (24.7) | 83 | 43.4 | 45.7 | 2.5 (1.27) | 31.9 | 19.5 |
| organ failure | 419 (29.7) | 85 | 43.7 | 35.8 | 3.3 (1.18) | 46.8 | 25.1 |
| frailty | 544 (38.6) | 86 | 51.7 | 40.6 | 2.2 (1.06) | 35.5 | 35.3 |
| other** | 17 (1.7) | ||||||
| p<.001 | p<.04 | p=.04 | p<.001 | p<.001 | p<.001 | ||
| latent trajectory (n=1410) | |||||||
| late decline | 293 (20.8) | 83 | 39.6 | 38.6 | 2.1 (1.2) | 44.7 | 15.4 |
| progressive decline | 153 (10.9) | 84 | 34.6 | 34.6 | 2.3 (1.1) | 33.3 | 26.8 |
| moderate disability | 190 (13.5) | 84 | 41.1 | 48.4 | 2.6 (1.3) | 37.9 | 22.6 |
| early decline | 257 (18.2) | 85 | 47.9 | 36.2 | 2.6 (1.2) | 30.7 | 30.7 |
| persistent disability | 517 (36.7) | 86 | 56.3 | 43.1 | 2.8 (1.3) | 33.1 | 32.3 |
| p < .001 | p < .001 | p =.03 | p < .001 | p = .002 | p < .001 |
mean number of the 7 following conditions: hypertension, diabetes, chronic lung disease, congestive heart failure, cancer, history of a myocardial infarction, stroke
removed from group comparisons
Measures
Health ABC participants were seen or contacted by phone every six months during the first 14 years of the study and interviewed by phone every three months during the last three years of data collection (Years 15–17). Interview data regularly included self-reported mobility, health care utilization, and chronic illness. After a participant died, investigators obtained the death certificate and interviewed next-of-kin about the final months of the decedent’s life. Underlying cause of death was adjudicated by a panel of physicians using recent hospitalization records with the death certificate and the narrative interview.
Our primary outcome measure is mobility, specifically the lack of difficulty walking a quarter mile. Questions about activities of daily living were asked less frequently than mobility questions, but we examined ADL independence among the subset of decedents for whom data were available. Explanatory variables include the adjudicated underlying cause of death and self-reported diseases and falls.
Analyses
First, we used clinical conditions to pre-define four decedent groups consistent with the graphical representation derived from the Glaser and Straus study (Supplemental Figure 1): ‘sudden’,’ terminal’, ‘organ failure’ and ‘frailty’. We initially identified all decedents for whom there had ever been a report of dementia, stroke, pneumonia, or a fall. We derived this list from a group of “conditions of frailty” found by Haan et al to be associated with readmissions and in-hospital mortality6. We labeled this group ‘frailty’ consistent with the Haan approach, though we recognized that the term is more generally associated with a specific phenotype7. We next identified those for whom there had ever been a report of congestive heart failure or chronic obstructive lung disease. Members of this group may have already been identified in the ‘frailty’ group, but were pulled from that group because the specific diagnosis of congestive heart failure or chronic obstructive lung disease makes them more likely to fit the “entry-re-entry” trajectory described by Glaser and Strauss. Then we identified as ‘terminal’ those decedents whose underlying cause of death was listed as cancer. Lastly, we identified the ‘sudden’ death group, collecting decedents who had never reported or been identified as having had a stroke, pneumonia, a fall, a myocardial infarction, chronic obstructive lung disease, congestive heart failure or dementia. These decedents may not have died abruptly, but their death was ‘not expected’ from the health data collected for this study. Decedents who were not selected by this scheme for any of the four groups were clustered into an ‘other’ group. We examined demographics, utilization and functional decline separately for each clinical condition group, reporting summary statistics as frequency count (%) or mean (SD). Differences among groups were tested using χ2 or one-way analysis of variance.
Second, we used a latent class model approach among decedents with three years of data (n=1410) to identify decedent groups based on trajectories of self-reported mobility disability evaluated every 6 months during the last three years prior to death. Mobility disability was defined as dichotomous difficulty walking a quarter mile. The Bayesian Information Criterion (BIC) was used to compare models with a different number of latent classes and varying degrees of polynomial trend for each class. Add-in SAS procedure (PROC TRAJ) was utilized to conduct the latent class model fitting. Statistical analyses were conducted using SAS version 9.3 (SAS institute, Cary, NC).
RESULTS
Distribution and characteristics of the decedent groups
Table 1 displays the characteristics of the 1410 decedents, divided into the 4 clinical groups and then into the 5 latent trajectory groups. Assigning decedents (n=1410) by pre-specified clinical conditions resulted in the following distribution: 5.8% sudden death, 24.7% terminal, 29.7% organ failure, and 38.6% frailty, proportions consistent with recent national statistics for major causes of death in old age8. Only 17 decedents (1.7%) were not classified by this scheme. The four clinical groups differed significantly in age, gender, race, the number of chronic conditions and the location of death. Members of the ‘sudden death’ group (5.8% of decedents) died at a younger age and were less likely to be hypertensive or have diabetes. More than half of these decedents died in a hospital. For this group, the most frequently adjudicated underlying cause of death was atherosclerotic cardiovascular disease (41.5%) and more of this group died of sepsis than those in any of the other groups. On average, decedents for whom cancer was the adjudicated underlying cause of death were also younger and were less likely than members of the other groups to die in the hospital. Members of the ‘organ failure’ group were less likely to be African American and more likely to have died in the hospital. Compared to members of the other groups, those in the ‘frailty’ group were older, more likely to be female, and more likely to have died in a nursing home.
Using latent trajectory modeling, we identified five distinct trajectories over the three years before death. As shown in Figure 1, these trajectories include late decline (20.8%), progressive disability (10.9%), moderate disability (13.5%), early decline (18.2%), and persistent disability (36.7%). Members of the ‘late decline’ group (20.8% of decedents) died at a younger age, were more likely to be a high school graduate, and were more likely to die in the hospital. Members of the ‘persistent disability’ group were older, more likely to be female, had the highest number of chronic illnesses, and were more likely to die in a nursing home. African Americans were more likely to fall in the moderate disability group.
Figure 1.
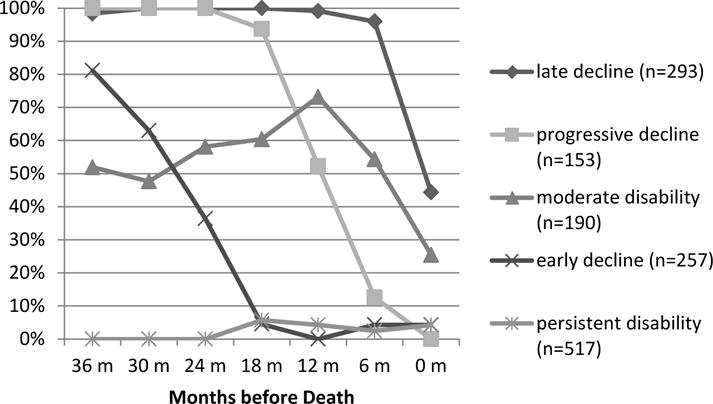
Percent of Each Latent Trajectory Group Able to Walk a Quarter Mile Without Difficulty by Month before Death
The five latent trajectory groups described above gave the best fit, each fit by one of a quadratic or cubic polynomial. The Bayesian Information Criterion (BIC) for the best 4, 5 and 6 classes models were −3871.63, −3868.81 and −3885.81, respectively. For each trajectory group, the mean and median probability of assigned membership exceeded 0.80 except for the progressive disability group (mean=0.66, median=0.68). Unlike the other latent class groups, where at least 78% of members had a posterior probability of assignment (PPA) > 0.7 (78% to 86%), in the progressive disability group, only 40% met this criterion. Nevertheless, individuals who were assigned to the progressive disability group had a probability of assignment to this group that was still on average 2.5 times higher than their probability of assignment to the next best group. Graphical displays for goodness of fit and overlap among the latent trajectory groups are available from the authors.
Disability trajectories among the clinical decedent groups
Overall, mobility and independence in activities of daily living decreased among all of the decedents over the 3 years before death. Among the 1410 decedents with three years of data, 56% reported no difficulty walking a quarter mile 3 years before death; only 31% continued to have no difficulty 6 months before death; and, according to family members interviewed after death occurred, only 15% were able to walk a quarter mile right up until death. Indeed, the slopes of decline, though not the level of disability, were very similar among key mobility and ADL variables (Supplemental Figure S2).
Figure 2 illustrates the differences among the clinical condition groups in the proportion that were able to walk a quarter mile without difficulty, climb 10 steps without difficulty, and perform three activities of daily living (transferring, bathing and dressing) without help at 6 month intervals prior to death, including the next-of-kin report of mobility for the time leading up to death. Cancer decedents and those in the ‘sudden’ death group had similar rates of ability 3 years before death, while more cancer decedents lost ability in the last year of life than in the ‘sudden’ death group. Compared to the terminal and sudden death groups, those in the ‘frailty’ and ‘organ failure’ groups were less able throughout the 3 years before death. Those with organ failure were slightly more impaired in mobility over the entire period. Decline was especially evident in all four groups in the last 6 months of life.
Figure 2.
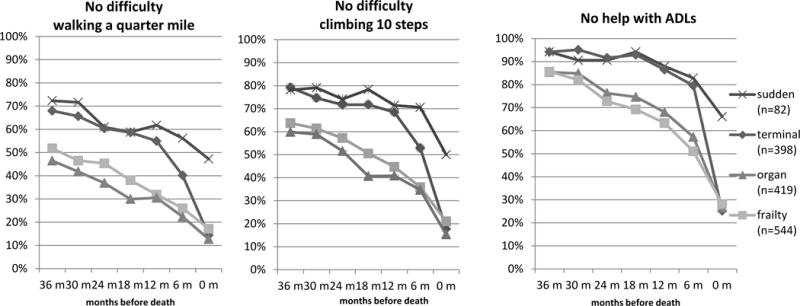
Percent of Each Clinical Decedent Group with No Mobility Difficulty or ADL Disability by Month before Death
Among the latent disability groups, 95% of the late decline group reported being able to walk a quarter mile without difficulty at the interview 6 months before death and, according to the next-of-kin, 50% had no difficulty right up until death. Of the 36.7% who experienced persistent disability, fewer than 5% were able to walk a quarter mile without difficulty at any point during the last three years of life. Decedents in the progressive disability group functioned well in the third year before death, but with each subsequent 6 month interview, more and more reported mobility disability. In both the early decline and moderate disability groups, only 60–70% reported no difficulty walking a quarter mile three years before death. For those in the early decline group, that proportion declined to 10% by 18 months before death. The moderate disability group remained more stable, declining primarily in the last six months of life.
Comparison of the group classification schemes
As shown in Table 1, both approaches to the end-of-life experience identified subgroups of participants that differed significantly in sociodemographic features, number of comorbid conditions, and location of death. As demonstrated in Figure 3, none of the latent trajectory groups captured a majority of any of the clinically-defined decedent groups. However the sudden death group was more likely to experience the late decline trajectory (46.3%, p < .01 relative to other trajectories). Likewise, the organ failure and frailty decedent groups were more likely to experience persistent disability (46.8% and 40.6%, respectively, p < .01 relative to other trajectories).
Figure 3.
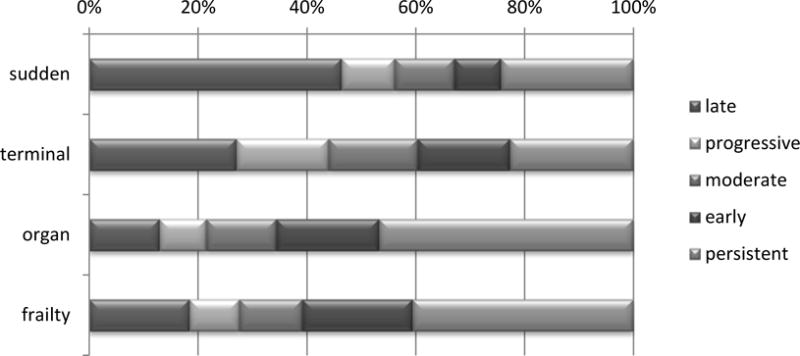
Percent of Each Clinical Group Belonging to Each Latent Trajectory Group
DISCUSSION
We analyzed trajectories at the end of life using two different typologies with the same data from a single sample of decedents. Confirming earlier analyses3, the clinical conditions approach efficiently separated the decedents into groups with different demographic characteristics, utilization profiles, and patterns of functional decline. The latent trajectories approach, by definition, created groups with differing patterns of decline in mobility, and these groups also had different demographic characteristics and utilization profiles. Both approaches captured the inevitable decline at the end of life. Similar to the previous research by the Precipitating Events Project (PEP) investigators5, we found very little overlap between the two sets of results, confirming that clinical conditions do not adequately predict the trajectory of mobility decline.
The lack of overlap does not negate the validity or value of either analytic approach. The clinical conditions scheme, which creates groups that differ significantly in healthcare utilization and average functional decline, has served to expand the concept of end of life from a simplistic terminal phase of illness to a highly variable phase of life. These trajectories have been used to underscore the need for a variety of health service models for those in advanced age9. The hospice model of care works well for the terminal illness trajectory, but the volatile nature of organ failure calls for careful case management and a 24-hour hotline to help heart failure and lung disease patients, among others, avoid serious disease exacerbations10. The empirical evidence suggesting that the largest proportion of decedents will fit a profile of having variable health events associated with diminishing physical resilience and a prolonged period of mobility and ADL disability at the end of life challenges policy makers to provide various mechanisms for the long-term supportive care that will be needed by a significant proportion of older adults.
Latent trajectory modeling of mobility disability, on the other hand, demonstrates that clinical conditions leading to death are only one of many factors that influence the course of physical decline. Investigators have used this approach to identify a long list of variables that contribute to decline in mobility and ADL independence, including demographic characteristics (age, gender, education, socioeconomic status)11, injuries12, hospitalizations13, level of physical activity14, cognitive function15,16, social exchanges and depressive symptoms17,18 and the total burden of chronic illness19. The complex number of factors affecting physical function and the lack of correspondence to clinical conditions suggests a need for interventions target function regardless of diagnosis.
Both approaches rely on retrospective analysis once death has occurred. Neither provides information that allows the prospective match of an individual to a specific pattern of decline. Instead, these results are part of an incremental step forward in our understanding the approach of death as a highly variable phase of life.
The statistical methods used by both the clinical grouping scheme and the latent trajectory modeling smooth out fluctuation rather than identify it. Although early research suggests volatility as depicted in the graphic of organ failure20,21, we provide no empirical support for this. Indeed, a preliminary examination of the number of transitions between reports of difficulty or no difficulty walking a quarter mile found no differences between the organ failure group and any of the other groups. This warrants further investigation to determine if advances in the clinical treatment of these conditions have smoothed the course of disability for most patients at the end of life or whether other indicators would better capture any ‘volatility’ in health or function.
It is important to note that our analyses differ from the Precipitating Events Project (PEP) in two important ways. First, the process for operationalizing and ordering clinical conditions differed. The Glaser and Strauss classification of deaths as “expected but lingering” has been interpreted in many ways3–5,9,22. The PEP investigators identified two groups of decedents likely to fit this pattern: those who had a diagnosis of advanced dementia and those who fit the frailty phenotype. We defined ‘frailty’ more broadly, using an approach previously shown to differentiate elders with high health services needs6. Like the PEP team, we used a sequential approach to identify the groups, but our order differed and we did not remove decedents from the pool before identifying the next group. Our approach instead allowed decedents to move ‘up the ladder’ to be counted in the group with characteristics more likely to dominate the course of events at the end of life. A second major difference is that we present the average functional decline of each of the decedent groups based on clinical condition, while the PEP report did not do so. The visual representation of clinical group data has face validity and lends empirical support to the concepts underlying our interpretation of the Glaser and Strauss typology.
Our study provides additional evidence that the two after-death analytic approaches –grouping decedents by clinical condition and examining disability with latent trajectory modeling –used with the same set of data, have only partial overlap. The clinical condition scheme has value in supporting the need for a variety of health services to meet the needs of different groups at the end of life, and the latent trajectory modeling approach affirms that functional decline at the end of life is not simply the result of a clinical diagnosis. Both add to our understanding of health and function at the end of life. Our study is a reminder that investigations yielding potentially conflicting results may instead represent different facets of a complex phenomenon.
Supplementary Material
Supplemental Figure S1: Graphical Representation of Proposed Trajectories of Dying
Supplemental Figure S2: Decline Compared among Function Variables for the Entire Sample (n=1410)
Acknowledgments
Financial Disclosure: This research was supported by National Institute on Aging (NIA) Contracts N01-AG-6-2101; N01-AG-6-2103; N01-AG-6-2106; NIA grant R01-AG028050, and National Institute of Nursing Research (NINR) grant R01-NR012459, and supported in part by the Intramural Research Program of the NIH, National Institute on Aging.
Footnotes
DR. JUNE R LUNNEY (Orcid ID : 0000-0002-2024-7989)
Impact Statement: This paper demonstrates that two decedent classification schemes showing little overlap are not necessarily contradictory but rather informative about different facets of the end-of-life experience.
Conflict of Interest: None of the authors on this manuscript have any conflicts of interest or financial disclosures to report.
Author Contributions: JRL conceptualized the research question, analyzed the data, interpreted the results, and wrote the manuscript. SMA, DI, SS, ABN, and TH provided consultation on methodology and helped with analysis interpretation. RB performed the statistical data analysis and contributed to the interpretation of results. SMA, RB, DI, SS, ABN and TH provided critical revisions to the manuscript. All authors approved the final version of the submitted and published manuscript and take responsibility for the integrity of the data and the accuracy of the data analysis.
Sponsor’s Role: None.
Reference List
- 1.Glaser B, Strauss AL. Time for Dying. Chicago: Aldine Publishing Company; 1968. [Google Scholar]
- 2.Field M, Cassel CK. Approaching Death: Improving Care at the End of Life. Washington, DC: National Academy Press; 1997. [PubMed] [Google Scholar]
- 3.Lunney JR, Lynn J, Hogan C. Profiles of older medicare decedents. J Am Geriatr Soc. 2002;50:1108–1112. doi: 10.1046/j.1532-5415.2002.50268.x. [DOI] [PubMed] [Google Scholar]
- 4.Lunney JR, Lynn J, Foley DJ, et al. Patterns of functional decline at the end of life. JAMA. 2003;289:2387–2392. doi: 10.1001/jama.289.18.2387. [DOI] [PubMed] [Google Scholar]
- 5.Gill TM, Gahbauer EA, Han L, et al. Trajectories of disability in the last year of life. N Engl J Med. 2010;362:1173–1180. doi: 10.1056/NEJMoa0909087. [DOI] [PMC free article] [PubMed] [Google Scholar]
- 6.Haan MN, Selby JV, Quesenberry CP, Jr, et al. The impact of aging and chronic disease on use of hospital and outpatient services in a large HMO: 1971-1991 [see comments] J Am Geriatr Soc. 1997;45:667–674. doi: 10.1111/j.1532-5415.1997.tb01468.x. [DOI] [PubMed] [Google Scholar]
- 7.Fried LP, Tangen CM, Walston J, et al. Frailty in older adults: evidence for a phenotype. J Gerontol A Biol Sci Med Sci. 2001;56:M146–M156. doi: 10.1093/gerona/56.3.m146. [DOI] [PubMed] [Google Scholar]
- 8.Kochanek KD, Murphy SL, Xu J, et al. Deaths: Final Data for 2014. Natl Vital Stat Rep. 2016;65:1–122. [PubMed] [Google Scholar]
- 9.Lynn J. Perspectives on care at the close of life. Serving patients who may die soon and their families: the role of hospice and other services. JAMA. 2001;285:925–932. doi: 10.1001/jama.285.7.925. [DOI] [PubMed] [Google Scholar]
- 10.Boult C, Green AF, Boult LB, et al. Successful models of comprehensive care for older adults with chronic conditions: evidence for the Institute of Medicine’s “retooling for an aging America” report. J Am Geriatr Soc. 2009;57:2328–2337. doi: 10.1111/j.1532-5415.2009.02571.x. [DOI] [PubMed] [Google Scholar]
- 11.Liang J, Wang CN, Xu X, et al. Trajectory of functional status among older Taiwanese: Gender and age variations. Soc Sci Med. 2010;71:1208–1217. doi: 10.1016/j.socscimed.2010.05.007. [DOI] [PMC free article] [PubMed] [Google Scholar]
- 12.Bell TM, Wang J, Nolly R, et al. Predictors of functional limitation trajectories after injury in a nationally representative U.S. older adult population. Ann Epidemiol. 2015;10 doi: 10.1016/j.annepidem.2015.08.012. [DOI] [PubMed] [Google Scholar]
- 13.Gill TM, Allore HG, Holford TR, et al. Hospitalization, restricted activity, and the development of disability among older persons. JAMA. 2004;292:2115–2124. doi: 10.1001/jama.292.17.2115. [DOI] [PubMed] [Google Scholar]
- 14.Chen YM, Chen DR, Chiang TL, et al. Determinants of rate of change in functional disability: An application of latent growth curve modeling. Arch Gerontol Geriatr. 2016;64:21–8. doi: 10.1016/j.archger.2015.11.012. Epub;%2015 Dec 29.:21-28. [DOI] [PubMed] [Google Scholar]
- 15.Dodge HH, Du Y, Saxton JA, et al. Cognitive domains and trajectories of functional independence in nondemented elderly persons. J Gerontol A Biol Sci Med Sci. 2006;61:1330–1337. doi: 10.1093/gerona/61.12.1330. [DOI] [PMC free article] [PubMed] [Google Scholar]
- 16.Hochstetler H, Trzepacz PT, Wang S, et al. Empirically Defining Trajectories of Late-Life Cognitive and Functional Decline. J Alzheimers Dis. 2016;50:271–282. doi: 10.3233/JAD-150563. [DOI] [PMC free article] [PubMed] [Google Scholar]
- 17.Mavandadi S, Rook KS, Newsom JT. Positive and negative social exchanges and disability in later life: an investigation of trajectories of change. J Gerontol B Psychol Sci Soc Sci. 2007;62:S361–S370. doi: 10.1093/geronb/62.6.s361. [DOI] [PMC free article] [PubMed] [Google Scholar]
- 18.Taylor MG, Lynch SM. Trajectories of impairment, social support, and depressive symptoms in later life. J Gerontol B Psychol Sci Soc Sci. 2004;59:S238–S246. doi: 10.1093/geronb/59.4.s238. [DOI] [PubMed] [Google Scholar]
- 19.Taylor MG, Lynch SM. Cohort differences and chronic disease profiles of differential disability trajectories. J Gerontol B Psychol Sci Soc Sci. 2011;66:729–738. doi: 10.1093/geronb/gbr104. [DOI] [PMC free article] [PubMed] [Google Scholar]
- 20.Clipp EC, Pavalko EK, Elder GH. Trajectories of Health: In Concept and Empirical Pattern. Behavior, Health, and Aging. 1992;2:159–179. [Google Scholar]
- 21.Fox E, Landrum-McNiff K, Zhong Z, et al. Evaluation of prognostic criteria for determining hospice eligibility in patients with advanced lung, heart, or liver disease. SUPPORT Investigators. Study to Understand Prognoses and Preferences for Outcomes and Risks of Treatments [see comments] JAMA. 1999;282:1638–1645. doi: 10.1001/jama.282.17.1638. [DOI] [PubMed] [Google Scholar]
- 22.Covinsky KE, Eng C, Lui LY, et al. The Last 2 Years of Life: Functional Trajectories of Frail Older People. J Am Geriatr Soc. 2003;51:492–498. doi: 10.1046/j.1532-5415.2003.51157.x. [DOI] [PubMed] [Google Scholar]
Associated Data
This section collects any data citations, data availability statements, or supplementary materials included in this article.
Supplementary Materials
Supplemental Figure S1: Graphical Representation of Proposed Trajectories of Dying
Supplemental Figure S2: Decline Compared among Function Variables for the Entire Sample (n=1410)